A review of optical coherence tomography angiography (OCTA)
←
→
Page content transcription
If your browser does not render page correctly, please read the page content below
de Carlo et al. International Journal of Retina and Vitreous (2015) 1:5
DOI 10.1186/s40942-015-0005-8

 REVIEW                                                                                                                                       Open Access

A review of optical coherence tomography
angiography (OCTA)
Talisa E de Carlo1,2, Andre Romano3,4, Nadia K Waheed1 and Jay S Duker1*

  Abstract
  Optical coherence tomography angiography (OCTA) is a new, non-invasive imaging technique that generates volumetric
  angiography images in a matter of seconds. This is a nascent technology with a potential wide applicability for retinal
  vascular disease. At present, level 1 evidence of the technology’s clinical applications doesn’t exist. In this paper, we
  introduce the technology, review the available English language publications regarding OCTA, and compare it
  with the current angiographic gold standards, fluorescein angiography (FA) and indocyanine green angiography
  (ICGA). Finally we summarize its potential application to retinal vascular diseases. OCTA is quick and non-invasive,
  and provides volumetric data with the clinical capability of specifically localizing and delineating pathology along
  with the ability to show both structural and blood flow information in tandem. Its current limitations include a
  relatively small field of view, inability to show leakage, and proclivity for image artifact due to patient movement/
  blinking. Published studies hint at OCTA’s potential efficacy in the evaluation of common ophthalmologic diseases such
  age related macular degeneration (AMD), diabetic retinopathy, artery and vein occlusions, and glaucoma. OCTA can
  detect changes in choroidal blood vessel flow and can elucidate the presence of choroidal neovascularization (CNV) in
  a variety of conditions but especially in AMD. It provides a highly detailed view of the retinal vasculature, which allows
  for accurate delineation of the foveal avascular zone (FAZ) in diabetic eyes and detection of subtle microvascular
  abnormalities in diabetic and vascular occlusive eyes. Optic disc perfusion in glaucomatous eyes is notable as well
  on OCTA. Further studies are needed to more definitively determine OCTA’s utility in the clinical setting and to
  establish if this technology may offer a non-invasive option of visualizing the retinal vasculature in detail.
  Keywords: Age-related macular degeneration, Diabetic retinopathy, Fluorescein angiography, Glaucoma,
  Indocyanine angiography, Optical coherence tomography angiography, Optic disc, Retina, Retinal vessel occlusion

Introduction                                                                        OCT b-scans represent strictly erythrocyte movement in
Optical coherence tomography angiography (OCTA) is                                  retinal blood vessels [1-4].
a new non-invasive imaging technique that employs                                     OCTA requires higher imaging speeds than most cur-
motion contrast imaging to high-resolution volumetric                               rently available OCT systems can provide in order to ob-
blood flow information generating angiographic images in                            tain a densely sampled volume. Conventional OCT device
a matter of seconds. OCTA compares the decorrelation                                scanning speeds would result in too much trade-off be-
signal (differences in the backscattered OCT signal inten-                          tween decreased field of view, lower image quality, and
sity or amplitude) between sequential OCT b-scans taken                             greatly increased scanning time.
at precisely the same cross-section in order to construct a
map of blood flow. Axial bulk motion from patient move-
ment is eliminated so sites of motion between repeated                              Comparing OCTA with FA and ICGA
                                                                                    Fluorescein angiography (FA) and indocyanine green
                                                                                    angiography (ICGA) are both invasive test that require
                                                                                    intravenous administration of dye and imaging up to
                                                                                    10–30 minutes [5-9]. They provide two-dimensional
* Correspondence: jduker@tuftsmedicalcenter.org                                     image sets that allow for dynamic visualization of blood
1
 New England Eye Center and Tufts Medical Center, Tufts University, 260
Tremont Street, Biewend Building, 9 - 11th Floor, Boston, MA 02116, USA             flow with a wide field of view. Therefore, patterns of dye
Full list of author information is available at the end of the article              leakage, pooling, and staining can be appreciated and
                                       © 2015 de Carlo et al.; licensee BioMed Central. This is an Open Access article distributed under the terms of the Creative
                                       Commons Attribution License (http://creativecommons.org/licenses/by/4.0), which permits unrestricted use, distribution, and
                                       reproduction in any medium, provided the original work is properly credited. The Creative Commons Public Domain
                                       Dedication waiver (http://creativecommons.org/publicdomain/zero/1.0/) applies to the data made available in this article,
                                       unless otherwise stated.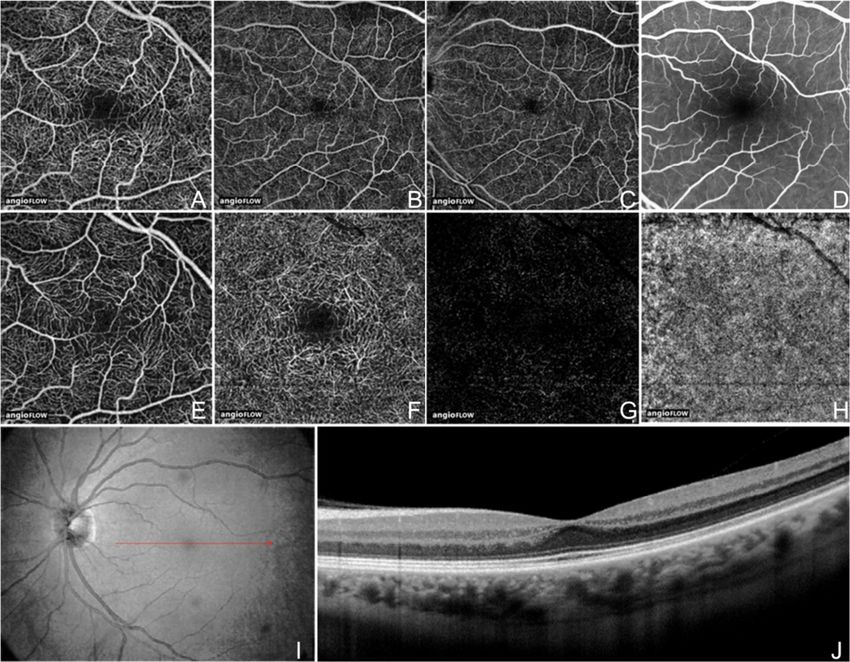
de Carlo et al. International Journal of Retina and Vitreous (2015) 1:5                                                              Page 2 of 15

are well-documented in the literature [10]. FA remains
the gold standard for the detection of choroidal neovas-
cularization (CNV), as well as retinal neovascularization
such as neovascularization of the disc (NVD) and neo-
vascularization elsewhere (NVE) [11-13]. However, ret-
inal pathology can be obscured by this leakage as well as
hemorrhage or media opacities, and localization of the
depth of the lesion and size delineation of neovasculari-
zation can be difficult due to dye leakage and poor stere-
opsis, and because the imaging modalities are not depth
resolved. As a result, segmentation of different layers is
not routinely possible with FA or ICGA. Therefore, iden-
tification of the axial location of pathology requires an
understanding of patterns of blockage and leakage [10].
For example, differentiation between type 1 CNV, which
is found between the retinal pigment epithelium (RPE)
and Bruch’s membrane, and type 2 CNV, which is found
in the subretinal space above the RPE, requires under-                     Figure 1 OCTA Wide-Field Montage of a Normal Eye. Optical
standing that the RPE blocks underlying fluorescence so                    coherence tomography angiography (OCTA) wide-field montage of the
type 1 CNV requires a larger amount of dye to accumu-                      normal right eye of a 56 year old Caucasian man. Images were acquired
late before hyperfluorescence is apparent [14].                            using the Angiovue software of the RTVue XR Avanti (Optovue, Inc.,
   FA and ICGA have other drawbacks that can limit their                   Fremont, CA) and montaged using Adobe Photoshop (San Jose, CA).
                                                                           This allows for a larger field of view much like fluorescein and
widespread use. Since they are invasive, relatively expen-                 indocyanine green angiography while maintaining improved
sive, and time-consuming, they are not ideal techniques to                 resolution (de Carlo TE et al., unpublished data in review).
use on a regular basis in a busy clinical setting. Although
considered safe, the dyes pose risks ranging from nausea
to allergic reactions, including anaphylaxis in rare in-
stances. Aside from allergic reactions of which the likeli-               TE et al., unpublished data in review). Carl Zeiss, Inc (Carl
hood increases with frequency of use, indocyanine green                   Zeiss Meditec, Dublin, CA) is developing an automatic
dye is contraindicated in pregnancy and kidney disease                    wide-field montage software, which employs motion track-
[15-17]. For the evaluation of patients requiring frequent                ing to track the eyes and stitch images together.
follow-up exams or of those that may not tolerate injec-                     OCTA provides flow information at a fixed point in time.
tion of intravenous dye, a rapid non-invasive technique to                Although leakage is not appreciable, exact delineation and
visualize retinal and choroidal vessels would be beneficial.              size measurements can be performed for pathology such as
   OCTA in comparison is a non-invasive technique that                    CNV (de Carlo TE et al., unpublished data in review)
acquires volumetric angiographic information without                      [19]. This is especially useful for identification of type 1
the use of dye. Each three-dimensional scan set takes ap-                 CNV where localization is inferential and therefore may be
proximately six seconds to obtain. The en-face images                     inaccurate with FA/ICGA. Retinal blood flow on OCTA
(OCT angiograms) can then be scrolled outward from                        can be obscured by hemorrhage as this decreases the abil-
the internal limiting membrane (ILM) to the choroid to                    ity of light to penetrate into the deeper layers of the eye.
visualize the individual vascular plexus and segment the                     OCTA provides both structural and functional (i.e. blood
inner retina, outer retina, choriocapillaris, or other area               flow) information in tandem. The “corresponding” OCT
of interest. The en-face acquisition areas currently range                b-scans can be co-registered with the simultaneous OCT
from 2 × 2 mm to 12 × 12 mm with the scan quality                         angiograms so the operator is able to scroll through the
greatly decreased with a widened field of view since the                  OCT angiogram like a cube scan. As a result, the precise
same number of OCT b-scans is used for all scanning                       location of pathology can be viewed on the corresponding
areas. The 12 x 12 mm scan is only available on research                  OCT b-scans. The axial resolution of the corresponding
prototypes. The 3 × 3 mm OCT angiograms appear to                         OCT b-scans are lower quality than the typical highly-
be higher resolution than the currently available FA/                     sampled line scans and are similar to the resolution of
ICGA images, and a study by Matsunaga et al. deduced                      individual OCT b-scans within a volumetric cube scan.
that they were at least equivalent in showing important                   Both the retinal and the choroidal microvasculature
vascular detail [18]. Use of the montage technique allows                 can be visualized using OCTA while FA is used for see-
for a larger field of view much like FA/ICGA while                        ing the retinal vessels and ICGA is more ideal for im-
maintaining this improved resolution (Figure 1; de Carlo                  aging the choroid.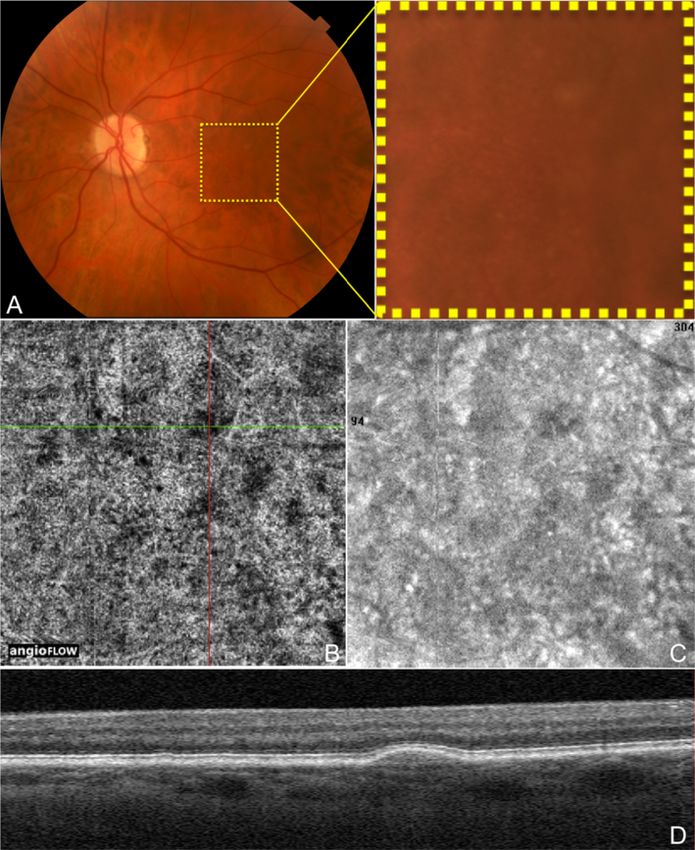
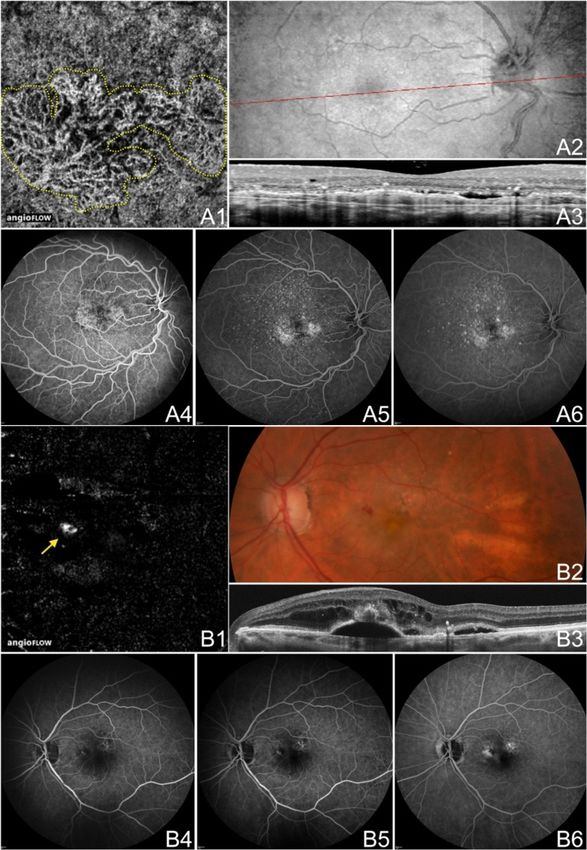
de Carlo et al. International Journal of Retina and Vitreous (2015) 1:5                                                            Page 3 of 15

  Using the present technology, OCTA is more prone to                     object in the retina, some non-vascular structures such
artifact than FA or ICGA. The larger retinal vessels cause                as fine tissue may also cause a decorrelation signal, es-
a “ghost image” referred to as a shadow artifact, when seg-               pecially if the patient is moving. For example, the edges
menting deeper layers, especially the outer retina. This                  of a retinal pigment epithelial detachment (RPED) often
can make it more difficult to appreciate the presence of                  show up on OCTA as white noise artifact in cases of in-
abnormal vasculature in the deeper layers. Because OCTA                   creased patient movement. It is postulated that because the
uses the principle that movement in the back of the eye                   RPE is a fine structure, in areas of disruption such as a
represents blood flow, it is prone to motion artifact. White              RPED, it can presumably move and therefore be detected
lines (representing decorrelation signal over the entire                  on the OCT angiogram.
b-scan) appear in areas of bulk patient movement such                        On the other hand, OCTA can also miss areas of slow
as when the patient loses fixation or moves. Conversely,                  blood flow such as in microaneurysms or fibrotic CNV.
blinks appear as a black line across the OCT angiogram                    Since OCTA relies on change between consecutive b-scans,
because the OCT signal is blocked from reaching the                       it will detect flow only above a minimum threshold, the
retina and the software, therefore, detects no move-                      slowest detectable flow, which is determined by the time
ment. Although erythrocytes should be the only moving                     between the two sequential OCT b-scans. Lesions that have

 Figure 2 OCT Angiogram Fields of View and Segmentation Layers on Angiovue. The normal left eye of a 56 year old Caucasian man using
 the Angiovue optical coherence tomography angiography (OCTA) software of the RTVue XR Avanti (Optovue, Inc., Fremont, CA). (A) Full-thickness
 (internal limiting membrane to Bruch’s membrane) 3 x 3 mm OCT angiogram. (B) Full-thickness 6 x 6 mm OCT Angiogram. (C) Full-thickness
 8 x 8 mm OCT Angiogram. (D) Fluorescein angiography cropped to approximately 8 x 8 mm or 30 degrees demonstrates less capillary detail than
 A-C. (E) 3 x 3 mm OCT angiogram of the “Superficial” inner retina. (F) 3 x 3 mm OCT angiogram of the “Deep” inner retina. (G) 3 x 3 mm OCT
 angiogram of the outer retina shows absence of vasculature. The white represents noise. (H) 3 x 3 mm OCT angiogram of the choriocapillaris is
 generally homogenous. There is black shadowing from retinal vessels. (I) En-face intensity OCT image. (J) Highly-sampled OCT b-scan image.
de Carlo et al. International Journal of Retina and Vitreous (2015) 1:5                                                            Page 4 of 15

flow below the slowest detectable flow would therefore not                FA [3]. OCTA imaging of the perifoveal region was re-
be visualized using this imaging technique. Increasing the                ported by Matsunaga et al., demonstrating that the
time between consecutive OCT b-scans could allow for in-                  ability to see the normal retinal vasculature was equiva-
creased flow detection but would offer a trade-off due to in-             lent to that of FA [18].
creased movement artifact. One of the advantages of a
higher speed system is that multiple volumetric sets can be               Review
obtained at each cross-section so the threshold can be al-                OCTA of normal eyes
tered later by selecting different time frames between                    The most widely available prototype OCTA system is the
the OCT b-scans to determine the optimal image quality.                   AngioVue software of the RTVue XR Avanti spectral-
Therefore if a low-flow vessel is undetectable by using the               domain OCT (SD-OCT) (Optovue, Inc, Fremont, CA),
first and second OCT b-scans at a given cross section, the                which uses a split-spectrum amplitude decorrelation angi-
image may be processed using the first and third OCT                      ography (SSADA) algorithm. The device obtains volumetric
b-scans to increase the time between the OCT b-scans                      scans of 304 × 304 A-scans at 70,000 A-scans per second
thereby decreasing the minimum threshold.                                 in approximately 3.0 seconds. The software offers the op-
   A couple of publications have qualitatively compared                   tion of 2 × 2 mm, 3 × 3 mm, 6 × 6 mm, and 8 × 8 mm
OCTA with FA. Spaide et al. described the peripapillary                   OCT angiograms (Figure 2A-C) and automated seg-
retinal vascular layers in 12 normal eyes, finding that                   mentation of these full-thickness retinal scans into the
OCTA provided improved visualization of all the vascu-                    “superficial” and “deep” inner retinal vascular plexuses,
lar layers including the radial peripapillary and deep                    outer retina, and choriocapillaris (Figure 2E-H). The
capillary networks that were not well-distinguished on                    OCT angiogram segmentation of the superficial inner

 Figure 3 OCT Angiogram Fields of View and Segmentation Layers on the SS-OCT Protype. The normal right eye of a 26 year old Caucasian
 woman using a prototype swept source optical coherence tomography angiography (OCTA) system (Department of Electrical Engineering and
 Computer Science and Research Laboratory of Electronics, Massachussetts Insitute of Technology, Cambridge, MA). (A) Full-thickness (internal
 limiting membrane to Bruch’s membrane) 3 x 3 mm OCT angiogram. (B) Full-thickness 6 x 6 mm OCT angiogram. (C) Corresponding OCT b-scan.
 (D) 3 x 3 mm OCT angiogram of the retinal nerve fiber layer plexus of the inner retina. (E) 3 x 3 mm OCT angiogram of the ganglion cell layer
 plexus of the inner retina. (F) 3 x 3 mm OCT angiogram of the “deep” inner retina.
de Carlo et al. International Journal of Retina and Vitreous (2015) 1:5                                                                         Page 5 of 15

retina contains a projection of the vasculature in the                          Technology using a swept-source OCT (SS-OCT) device
retinal nerve fiber layer (RNFL) and ganglion cell layer                        (Department of Electrical Engineering and Computer
(GCL) (Figure 2E). The deep inner retina OCT angio-                             Science and Research Laboratory of Electronics, Massa-
gram segmentation shows a composite of the vascular                             chussetts Institute of Technology, Cambridge, MA). This
plexuses at the border of the inner plexiform layer                             ultra-high speed prototype employs a vertical cavity surface
(IPL) and inner nuclear layer (INL) and the border of                           emitting laser (VCSEL) operating at 1060 nm wavelength
the INL and outer plexiform layer (OPL) (Figure 2F).                            which allows increased light penetration into pigmented
  The OCTA prototype with the fastest acquisition                               tissues and improved choroidal blood flow visualization
rate was developed by the Massachusetts Institute of                            compared to the light source used in SD-OCT. The

 Figure 4 OCTA and Color Fundus Photo of Drusen in Non-Neovascular AMD. The left eye of a 72 year old Caucasian man with non-neovascular
 age-related macular degeneration using the Angiovue optical coherence tomography angiography (OCTA) software of the RTVue XR Avanti (Optovue, Inc.,
 Fremont, CA). (A) Color fundus photo zoomed in to an approximately 3 x 3 mm area centered at the macula showing hard and soft drusen. (B) 3 x 3 mm
 OCT angiogram of the choriocapillaris centered at the macula as in A. The green and red lines represent the x and y axis OCT b-scans respectively which
 cross at a soft druse demonstrating an area of decreased signal in the choriocapillaris underlying the druse. (C) 3 x 3 mm en-face structural OCT of the
 choriocapillaris centered at the macula as in A-B. This image was simultaneously obtained during the same scan as the OCT angiogram in B. This structural
 OCT is still able to show the choriocapillaris changes at the location of the soft drusen in B, but detail is overall limited. (D) Corresponding x axis OCT
 b-scan at the cross-section demonstrated by the green line in B showing the soft druse. The corresponding OCT b-scans were simultaneously obtained
 during the same scan as the OCT angiogram in B.
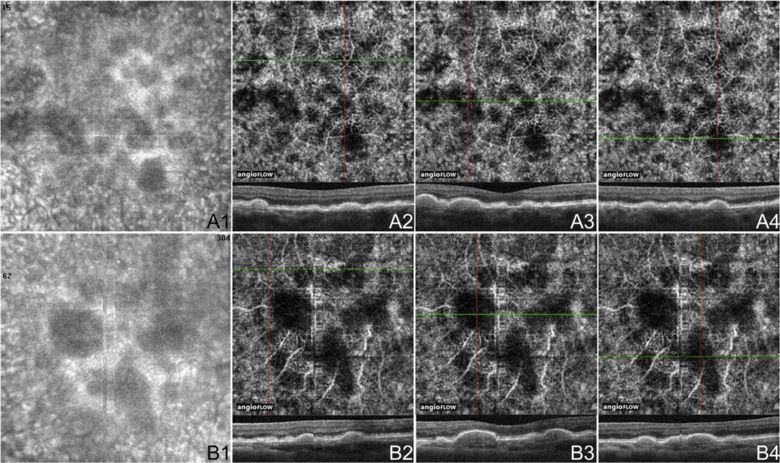
de Carlo et al. International Journal of Retina and Vitreous (2015) 1:5                                                                              Page 6 of 15

 Figure 5 OCTA of Drusen in Non-Neovascular AMD Cases. (A) 3 x 3 mm en-face images of the right eye of a 74 year old Caucasian man with
 non-neovascular age-related macular degeneration (AMD) using the Angiovue optical coherence tomography angiography (OCTA) software of the
 RTVue XR Avanti (Optovue, Inc., Fremont, CA). (A1) En-face structural OCT demonstrating areas of choriocapillaris alteration. (A2-4) OCT angiograms of
 the choriocapillaris and corresponding x-axis OCT b-scans at the cross-sections shown by the green line of the OCT angiograms. The three soft drusen
 shown are associated with areas of decreased signal in the choriocapillaris, which could indicate flow impairment. (B) 3 x 3 mm en-face images of the
 left eye of an 80 year old Asian woman with non-neovascular AMD using the Angiovue OCTA software of the RTVue XR Avanti (Optovue, Inc., Fremont,
 CA). (B1) En-face structural OCT demonstrating areas of choriocapillaris changes. (B2-4) OCT angiograms of the choriocapillaris and corresponding
 x-axis OCT b-scans at the cross-sections shown by the green line of the OCT angiograms. The druse in B2 is not associated with choriocapillaris loss.
 The other two soft drusen shown correspond to areas of decreased signal in the choriocapillaris, which could indicate flow impairment.

 Figure 6 OCTA of GA in Non-Neovascular AMD. 71 year old Caucasian man with geographic atrophy (GA) due to non-neovascular age-related
 macular degeneration using the Angiovue optical coherence tomography angiography (OCTA) software of the RTVue XR Avanti (Optovue, Inc.,
 Fremont, CA). (A) 6 x 6 mm en-face images of the right eye. (A1) En-face structural OCT at the level of the RPE demonstrating GA. The area of
 GA is circumscribed in yellow, which is overlaid over the images in A2 and A3. (A2) En-face structural OCT at the level of the choriocapillaris demonstrating
 alteration in a similar area as the GA. (A3) OCT angiogram at the level of the choriocapillaris demonstrating flow impairment in a similar area as the GA. Larger
 choroidal vessels have been push inward into the area of choriocapillaris alteration so are seen in this 10micrometer slice. Detail is greatly improved over that
 of the en-face structural OCT. (A4) Corresponding OCT b-scan shows the loss of RPE causing increased intensity below Bruch’s membrane which
 is characteristic of GA. (B) 3 x 3 mm en-face images of the left eye. (B1) En-face structural OCT at the level of the RPE demonstrating GA. The
 area of GA is circumscribed in yellow, which is overlaid over the images in B2 and B3. (B2) En-face structural OCT at the level of the choriocapillaris
 demonstrating alteration in a similar area as the GA. (B3) OCT angiogram at the level of the choriocapillaris demonstrating flow impairment in a similar
 area as the GA. Larger choroidal vessels have been push inward into the area of choriocapillaris alteration so are seen in this 10micrometer slice. Detail
 is greatly improved over that of the en-face structural OCT. (B4) Corresponding OCT b-scan shows the loss of RPE causing increased intensity below
 Bruch’s membrane which is characteristic of GA.
de Carlo et al. International Journal of Retina and Vitreous (2015) 1:5                                                                  Page 7 of 15

SS-OCTA system obtains scans of 500 × 500 A-scans                            OCTA of dry (Non-Neovascular) AMD
at 400,000 A-scans per second in approximately 3.8 sec-                      Dry age-related macular degeneration (AMD) is charac-
onds. This ultra-high speed allows for imaging of wider                      terized by drusen, pigmentary changes, and photoreceptor
fields of view. The prototype can be manipulated to obtain                   and RPE loss, called geographic atrophy (GA). Decreased
OCT angiograms up to 12 × 12 mm, however, it is most                         foveolar choroidal blood flow is associated with AMD and
commonly used to create 3 × 3 mm and 6 × 6 mm OCT                            increased drusen extent, and it has been hypothesized that
angiograms of great detail (Figure 3A-B). Full-thickness                     the choroidal blood flow may predict disease progression
scans are manually segmented into the superficial (plexus                    [14]. Choi et al. (unpublished data, presented in part at
at the RNFL), intermediate (plexus at the GCL), and                          the Association for Research in Vision and Ophthalmol-
deep (plexuses at IPL/INL and INL/OPL borders) inner                         ogy annual meeting, May 2014, Orlando, Florida) demon-
retinal vascular plexuses, outer retina, choriocapillaris,                   strated OCTA findings in dry AMD. Areas of impaired
and choroidal layers (Figure 3D-F). Using this OCTA sys-                     choriocapillaris flow typically extended beyond the bor-
tem, the choriocapillaris and choroidal vessels were de-                     ders of the GA. Eyes with dry AMD were shown to have a
scribed in normal eyes by Choi et al [2].                                    generalized decrease in choriocapillaris density, which was

 Figure 7 OCTA and FA/ICGA of CNV in Neovascular AMD. The left eye of a 67 year old Caucasian man with choroidal neovascularization (CNV)
 due to neovascular age-related macular degeneration using the Angiovue optical coherence tomography angiography (OCTA) software of the RTVue
 XR Avanti (Optovue, Inc., Fremont, CA). (A) 6 x 6 mm OCT angiogram segmented so both the choriocapillaris and the outer retina are shown. A circular
 net of abnormal vessels are shown surrounded by relatively homogenous choriocapillaris. The abnormal vessels exist both below and above Bruch’s
 membrane (in the outer retina). (B) En-face structural OCT with a red line corresponding to the highly-sampled OCT b-scan in C. (C) 12 mm highly
 sampled OCT b-scan through the fovea demonstrates a large retinal pigment epithelial detachment, subretinal fluid, disruption of Bruch’s membrane,
 and hyper-reflective material characteristic of CNV. (D) Indocyanine green angiography early, intermediate, and late frames show increasing
 hyper-fluorescence and pooling of dye in the CNV. (E) Fluorescein angiography intermediate and late frames show increasing hyper-fluorescence and
 pooling of the CNV.
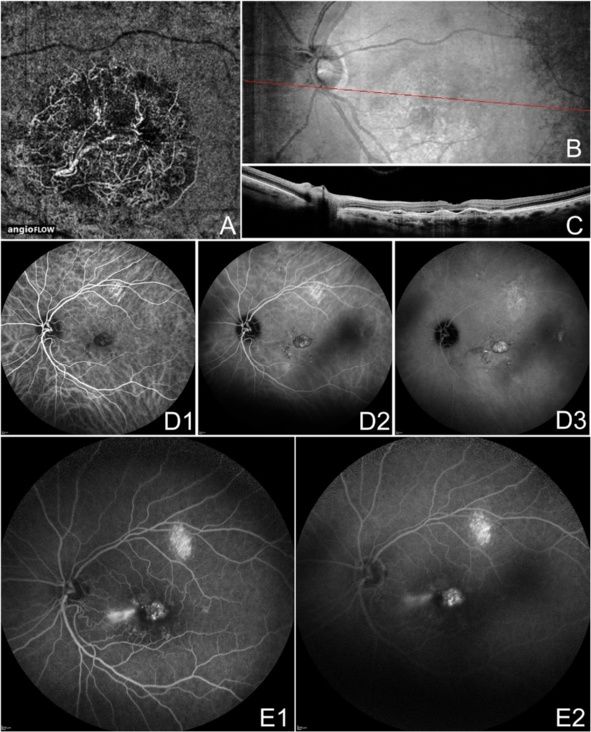
de Carlo et al. International Journal of Retina and Vitreous (2015) 1:5                                                                     Page 8 of 15

 Figure 8 OCTA and FA of CNV in Neovascular AMD. (A) The right eye of a 63 year old Caucasian man with choroidal neovascularization (CNV)
 due to neovascular age-related macular degeneration (AMD) using the Angiovue optical coherence tomography angiography (OCTA) software of the
 RTVue XR Avanti (Optovue, Inc., Fremont, CA). (A1) 3 x 3 mm OCT angiogram segmented so both the choriocapillaris and the outer retina are shown.
 Two nets of abnormal vessels are shown surrounded by relatively homogenous choriocapillaris. The abnormal vessels exist both below and above
 Bruch’s membrane (in the outer retina). (A2-3) En-face structural OCT with a red line corresponding to a 12 mm highly sampled OCT b-scan (cropped
 to 3 mm) through the macula. The OCT b-scan demonstrates a retinal pigment epithelial detachment (RPED), subretinal fluid, an intraretinal cyst, and
 hyper-reflective material characteristic of CNV. (A4-6) Fluorescein angiography (FA) early, intermediate, and late frames showing increasing
 hyper-fluorescence and staining of the CNV. (B) The left eye of an 89 year old Caucasian woman with CNV type three (retinal angiomatous proliferation,
 RAP) due to neovascular AMD using the Angiovue OCTA software of the RTVue XR Avanti (Optovue, Inc., Fremont, CA). (B1) 6 x 6 mm OCT angiogram
 segmented at the outer retina showing a round RAP lesion (yellow arrow). A feeder vessel from a retinal vessel was noted (not shown). (B2) Color fundus
 photo demonstrating hemorrhage in the region of the RAP lesion. (B3) 6 mm highly sampled OCT b-scan through the macula shows subretinal and
 intraretinal fluid and a round ball of hyper-reflective tissue above a serous RPED. (B4-6) FA early, intermediate, and late frames showing
 increasing hyper-fluorescence and pooling in the CNV.
de Carlo et al. International Journal of Retina and Vitreous (2015) 1:5                                                                    Page 9 of 15

sometimes associated with drusen. Figures 4 and 5 dem-                        visualize and quantify CNV that had been seen on FA in
onstrate discrete areas of decreased signal at the chorioca-                  five eyes [19]. Then in November 2014, Moult and Choi
pillaris level below many but not all drusen in three eyes.                   et al. described CNV in 16 of 19 eyes with neovasculariza-
These areas of alteration did not appear to be due to sha-                    tion, noting that the majority of these eyes (14/16, 88%)
dowing (from material in the drusen), and some choroidal                      also demonstrated choriocapillaris alteration surrounding
vessels were appreciated below these areas. However, fur-                     the CNV [20]. De Carlo et al. described qualitative and
ther studies would be necessary to determine if the chor-                     quantitative characteristics of CNV in 48 eyes [21]. The
iocapillaris changes associated with the drusen are true                      group determined sensitivity and specificity of the proto-
areas of flow impairment. Choriocapillaris flow alterations                   type AngioVue software, using FA as the ground truth, to
are also shown in two eyes along the border of GA in                          be 50% (4/8) and 91% (20/22) respectively, hypothesizing
Figure 6.                                                                     that the low sensitivity was due to small sample size and
                                                                              blockage from large amounts of retinal hemorrhage in
OCTA of wet (Neovascular) AMD                                                 some patients. Figures 7 and 8 illustrate three examples of
Several publications concerning OCTA of eyes with wet                         CNV, including one type 3 CNV (retinal angiomatous pro-
AMD appear in the literature. In July 2014 Jia et al. first                   liferation, RAP), on OCTA confirmed with FA/ICGA,
described the ability of a prototype SS-OCTA system to                        using the Angiovue OCTA software of the RTVue XR

 Figure 9 OCTA of CNV in Neovascular AMD. (A) The left eye of an 89 year old Caucasian man with choroidal neovascularization (CNV) due to
 neovascular age-related macular degeneration (AMD) using the swept source optical coherence tomography angiography (OCTA) prototype
 (Department of Electrical Engineering and Computer Science and Research Laboratory of Electronics, Massachussetts Insitute of Technology,
 Cambridge, MA). (A1) 3 x 3 mm OCT angiogram of the outer retina with manual removal of the retinal vessel ghost artifact. A sea-fan appearing CNV is
 seen. (A2) Corresponding OCT b-scan showing a retinal pigment epithelial detachment, disruption of Bruch’s membrane, and hyper-reflective material
 characteristic of CNV. (B) The left eye of a 70 year old Caucasian man with treatment-naïve choroidal neovascularization (CNV) due to neovascular
 age-related macular degeneration (AMD) using the swept source OCTA prototype (Department of Electrical Engineering and Computer Science and
 Research Laboratory of Electronics, Massachussetts Insitute of Technology, Cambridge, MA). (B1) 3 x 3 mm OCT angiogram of the outer retina with
 manual removal of the retinal vessel ghosting artifact. A sea-fan appearing CNV is seen. (B2) Red-free fundus photo exhibiting a lesion of the same
 shape and location as the CNV seen in B1.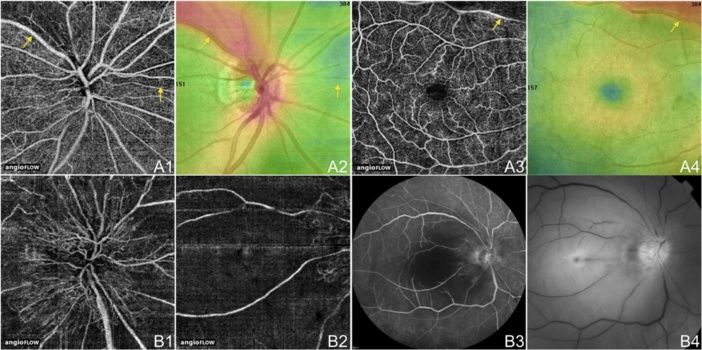
de Carlo et al. International Journal of Retina and Vitreous (2015) 1:5 Page 10 of 15
Avanti (Optovue, Inc., Fremont, CA). Figure 9 shows two area, showing that they were sequentially enlarged in each
OCTA examples of CNV, one of which was treatment stages of diabetic retinopathy (normal eyes to PDR). The
naïve, using the SS-OCT prototype (Department of Elec- data showed that OCTA visualized the majority but not all
trical Engineering and Computer Science and Research of the microaneurysms visualized by FA likely because
Laboratory of Electronics, Massachussetts Insitute of OCTA is limited by the principle of slowest detectable flow.
Technology, Cambridge, MA). However, OCTA was able to appreciate some microaneur-
ysms that were not detected by FA. OCTA also successfully
OCTA of diabetes detected other abnormalities that were not evident on FA
There are few published papers as of early 2015 on such as areas of retinal non-perfusion, reduced capillary
OCTA of diabetic retinopathy. Choi et al. (unpublished density, and increased vessel tortuosity. de Carlo et al.
data) demonstrated that OCTA of diabetic eyes ranging (unpublished data in review) described a wide-field OCTA
from no retinopathy to proliferative diabetic retinopathy montage of an eye with newly proliferative diabetic retinop-
(PDR) demonstrated choriocapillaris abnormalities and/or athy. The wide-field montage OCTA image also success-
retinal microvascular abnormalities such as microaneur- fully allowed visualization of an enlarged FAZ, perifoveal
ysms, vascular remodeling adjacent to the foveal avascular intercapillary area, and multiple microaneurysms. It also
zone (FAZ), enlarged FAZ, and capillary tortuosity and provided a larger field of view allowing more peripheral
dilation. OCTA and FA were compared in unpublished detection of microvascular changes, early NVE, and areas
data by Salz et al. The group supported the utility of of capillary non-perfusion including areas too small to
OCTA in evaluating FAZ and the perifoveal intercapillary visualize on FA.
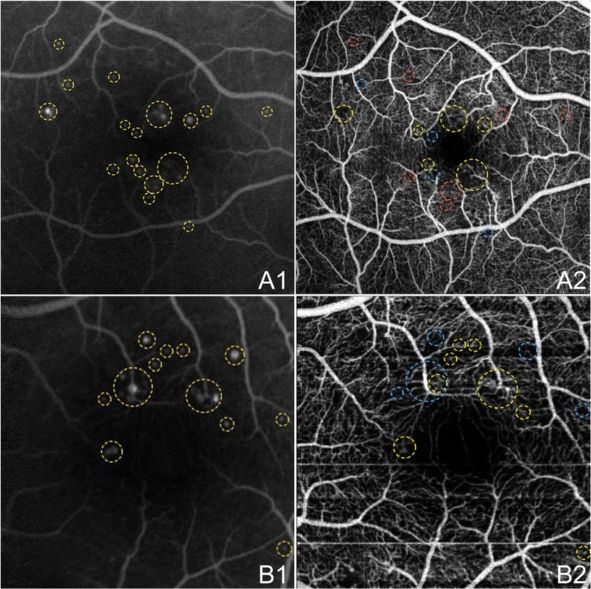
Figure 10 OCTA and FA of Microaneurysms in NPDR. The right eye (A) and left eye (B) of a 45 year old Caucasian man with non-proliferative
diabetic retinopathy using the swept source optical coherence tomography angiography (OCTA) prototype (Department of Electrical Engineering and
Computer Science and Research Laboratory of Electronics, Massachussetts Insitute of Technology, Cambridge, MA). (A1) Fluorescein angiography (FA)
cropped to approximately 6 x 6 mm. Aneurysms are circled in yellow. (A2) Full-thickness (internal limiting membrane to Bruch’s membrane) 6 x 6 mm
OCT angiogram. FAZ appears enlarged. Aneurysms that are seen on FA in A1 that are also seen on OCTA are circled in yellow. Aneurysms on FA that are
seen as areas of capillary non-perfusion on OCTA are circled in blue. Areas where aneurysms are seen on FA, but show normal vasculature on OCTA are
circled in red. (B1) FA cropped to approximately 3 x 3 mm. Aneurysms are circled in yellow. (B2) Full-thickness 3 x 3 mm OCT angiogram, which provides
improved detail over 6 x 6 mm OCT angiograms, demonstrates higher sensitivity in detecting micro vascular abnormalities. FAZ appears
enlarged. Aneurysms that are seen on FA in B1 that are also seen on OCTA are circled in yellow. Aneurysms on FA that are seen as areas of capillary
non-perfusion on OCTA are circled in blue.de Carlo et al. International Journal of Retina and Vitreous (2015) 1:5 Page 11 of 15
Figure 10 shows an enlarged FAZ on OCTA and com- abnormalities such as microaneurysms, telangiectasis,
pares OCTA and FA in the identification of microaneurysms and anastamoses.
in two eyes with non-proliferative diabetic retinopathy Figure 13 shows OCT angiograms of an acute branch
(NPDR). Capillary non-perfusion and other retinal micro- retinal artery occlusion (BRAO) and a subacute central
vascular abnormalities are demonstrated in Figure 11. retinal artery occlusion (CRAO). The BRAO demonstrates
OCTA examples of NVD and NVE in PDR eyes are wedge-shaped areas of capillary non-perfusion that correl-
shown in Figure 12. ate to areas of abnormalities on the retinal thickness map.
This illustrates the potential use of OCTA in pinpointing
areas of ischemia and edema. The CRAO shows diffuse
OCTA of artery and vein occlusion capillary non-perfusion in areas supplied by the central
Retinal vascular occlusions have yet to be described in retinal artery as seen on the same-day FA. Flow is still
the literature using OCTA as an imaging modality. seen in the major retinal vessels. Around the optic disc,
However, preliminary work at the New England Eye there is an absence of blood flow in the superficial disc
Center of Boston, MA shows that OCTA may be useful for vasculature supplied by the central retinal artery but the
evaluating these diseases. Unpublished data in review by de lamina cribosa blood flow remains intact. As OCTA pro-
Carlo et al. described a case of branch retinal vein occlusion vides a snapshot in time, it does not demonstrate delayed
(BRVO) using a wide-field montage technique. The OCTA arteriovenous transit time as FA does.
showed a large wedge-shaped area of capillary non- A case of BRVO and a case of central retinal vein occlu-
perfusion in the inferotemporal macula with clear de- sion (CRVO) are illustrated in Figure 14. OCTA of the
lineation of the boundary of ischemia, and vascular BRVO shows capillary non-perfusion superotemporally
Figure 11 OCTA of NPDR. The right eye (A) and left eye (B) of a 58 year old Caucasian man with non-proliferative diabetic retinopathy and diabetic
macular edema (DME) using the Angiovue optical coherence tomography angiography (OCTA) software of the RTVue XR Avanti (Optovue, Inc., Fremont,
CA). (A1) Full-thickness (internal limiting membrane to Bruch’s membrane) 6 x 6 mm OCT angiogram shows microvascular abnormalities such as areas of
capillary non-perfusion (yellow arrows), capillary loops, and microaneurysms. (A2) En-face structural OCT with a red line corresponding to
the highly-sampled OCT b-scan in A3. (A3) 12 mm highly sampled OCT b-scan through the fovea demonstrating DME and hard exudates.
(B1) Full-thickness 3 x 3 mm OCT angiogram, which provides improved detail over 6 x 6 mm OCT angiograms, shows microvascular abnormalities
such as areas of capillary non-perfusion (yellow arrows), capillary loops, and microaneurysms. (B2) En-face structural OCT with a red line corresponding
to the highly-sampled OCT b-scan in B3. (B3) 12 mm highly sampled OCT b-scan through the fovea demonstrating DME and hard exudates.de Carlo et al. International Journal of Retina and Vitreous (2015) 1:5 Page 12 of 15
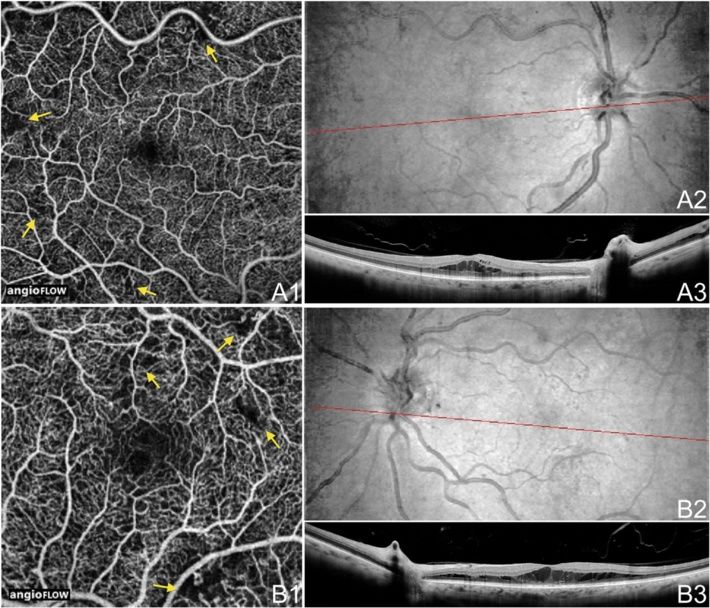
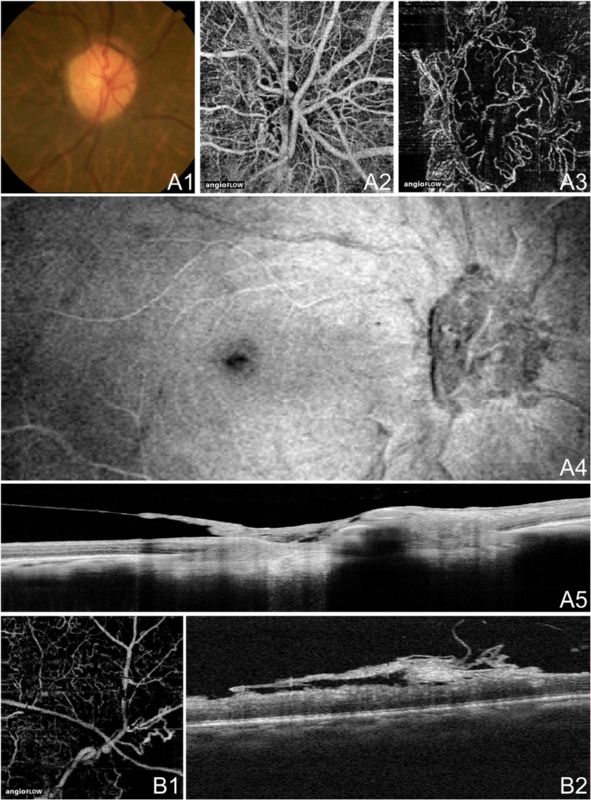
Figure 12 OCTA of Neovascularization in PDR. (A) The right eye of a 74 year old African woman with neovascularization of the disc (NVD)
due to proliferative diabetic retinopathy (PDR) using the Angiovue optical coherence tomography angiography (OCTA) software of the RTVue XR
Avanti (Optovue, Inc., Fremont, CA). (A1) Color fundus photo demonstrating fine neovascular vessels over the optic disc. (A2) Full-thickness (internal
limiting membrane to Bruch’s membrane) 3 x 3 mm OCT angiogram at the optic disc. Wispy NVD is difficult to appreciate. (A3) 3 x 3 mm OCT
angiogram at the optic disc segmented with the inner boundary in the vitreous above the NVD and the outer boundary slightly below the
internal limiting membrane (ILM). The NVD is clearly appreciable. (A4) En-face structural OCT showing abnormal tissue at the optic disc.
(A5) Highly-sampled OCT b-scan of the optic disc where abnormal tissue is observed extending above the ILM into the vitreous cavity. (B) The right
eye of a 46 year old African woman with neovascularization elsewhere (NVE) due to proliferative diabetic retinopathy (PDR) using the Angiovue optical
coherence tomography angiography (OCTA) software of the RTVue XR Avanti (Optovue, Inc., Fremont, CA). (B1) 3 x 3 mm OCT angiogram with the
inner boundary in the vitreous and the outer boundary at Bruch’s membrane. Abnormal vessels are seen in an area of capillary non-perfusion. Image
quality is limited by artifact from movement (horizontal and vertical lines). (B2) Corresponding OCT b-scan showing abnormal tissue above the ILM
extending into the vitreous cavity.
along the superior arcade extending into the FAZ, and tel- microvascular network is attenuated in both the super-
angiectatic vessels, capillary loops, and possible microaneur- ficial disc vasculature and the deeper lamina cribosa.
ysms at the border of the ischemic areas. The OCTA of the Averaging the decorrelation signal in OCT angiograms
chronic CRVO demonstrates diffuse capillary non-perfusion approximates the area of microvasculature and allows
continuous with the FAZ and telangiectatic vessels. the user to calculate the flow index, which is decreased
in eyes with glaucoma. The flow index has been shown
OCTA of glaucoma to have both a very high sensitivity and specificity in
OCTA is a useful tool for evaluating optic disc perfusion differentiating glaucomatous eyes from normal eyes
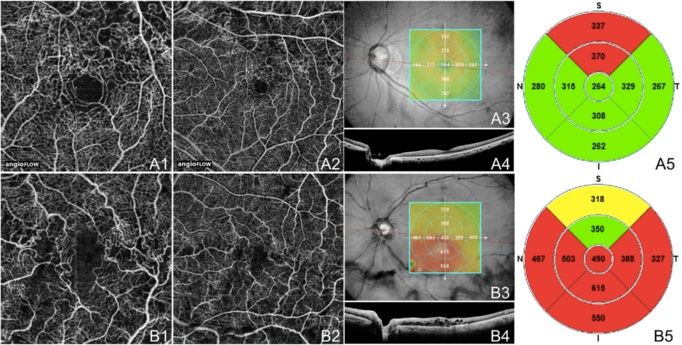
in glaucomatous eyes. The normally dense peripapillary [22,23].de Carlo et al. International Journal of Retina and Vitreous (2015) 1:5 Page 13 of 15 Figure 13 OCTA of BRAO and CRAO. (A) The right eye of a 70 year old Caucasian man with an acute branch retinal artery occlusion using the Angiovue optical coherence tomography angiography (OCTA) software of the RTVue XR Avanti (Optovue, Inc., Fremont, CA). (A1) Full-thickness (internal limiting membrane to Bruch’s membrane) 4.5 x 4.5 mm OCT angiogram of the optic disc showing decreased capillary perfusion superotemporal and nasal to the disc (yellow arrows). (A2) 4.5 x 4.5 mm en-face OCT thickness map showing retinal thickening in red and thinning in blue (yellow arrows) that correspond to the decreased capillary perfusion in A1. (A3) Full-thickness 6 x 6 mm OCT angiogram illustrating decreased capillary perfusion superotemporal and nasal to the disc (yellow arrow) as in A1. (A4) 6 x 6 mm en-face OCT thickness map showing retinal thickening in red (yellow arrow) that correspond to the decreased capillary perfusion in A3. (B) The right eye of an 81 year old Caucasian man with a subacute central retinal artery occlusion using the Angiovue optical coherence tomography angiography (OCTA) software of the RTVue XR Avanti (Optovue, Inc., Fremont, CA). (B1) Full-thickness 4.5 x 4.5 mm OCT angiogram of the optic disc showing diffusely decreased peripapillary capillary perfusion. (B2) Full-thickness 6 x 6 mm OCT angiogram illustrating decreased capillary perfusion in the macula. Only the large retinal and peripapillary vessels demonstrate blood flow. (B3) Fluorescein angiography is hypo-fluorescent in the macula and peripapillary region due to the decreased ability for the fluorescein dye to reach these areas because of low blood flow. The vessels appear attenuated. (B4) Red-free fundus photo demonstrates attenuation of the vessels especially in the macular and peripapillary regions. Figure 14 OCTA of BRVO and CRVO. (A) The left eye of a 61 year old Asian woman with a chronic branch retinal vein occlusion using the Angiovue optical coherence tomography angiography (OCTA) software of the RTVue XR Avanti (Optovue, Inc., Fremont, CA). (A1) Full-thickness (internal limiting membrane to Bruch’s membrane) 3 x 3 mm OCT angiogram showing capillary non-perfusion superotemporal extending into the foveal avascular zone (FAZ) and telangiectatic vessels at the border of the ischemic areas. (A2) Full-thickness 6 x 6 mm OCT angiogram demonstrating that the capillary non-perfusion is along the superior arcade. The edges of the ischemia are bordered by telangiectatic vessels, capillary loops, and possible microaneurysms. (A3) En-face structural OCT with a retinal thickness map and a red line corresponding to the highly-sampled OCT b-scan in A4. (A4) 12 mm highly sampled OCT b-scan through the fovea which appears relatively unaffected. (A5) Retinal thickness map demonstrating superior thickening due to edema. (B) The left eye of a 72 year old Caucasian man with a chronic central retinal vein occlusion using the Angiovue OCTA software of the RTVue XR Avanti (Optovue, Inc., Fremont, CA). (B1) Full-thickness 3 x 3 mm OCT angiogram showing diffuse capillary non-perfusion continuous with the FAZ and telangiectatic vessels. (B2) Full-thickness 6 x 6 mm OCT angiogram demonstrating telangiectatic vessels and diffuse capillary non-perfusion especially along the inferior arcade. (B3) En-face structural OCT with a retinal thickness map and a red line corresponding to the highly-sampled OCT b-scan in B4. (B4) 12 mm highly sampled OCT b-scan through the fovea which shows macular edema and disruption of the photoreceptor layer. (B5) Retinal thickness map demonstrating thickening that is greatest inferiorly.
de Carlo et al. International Journal of Retina and Vitreous (2015) 1:5                                                                                   Page 14 of 15

Conclusions                                                                              Dr. Andre J. Witkin who each provided one patient case included in this
OCTA is a new technology that has great potential for use                                review.

in the clinical setting. Compared with FA and ICGA, the                                  Author details
current retinal angiographic gold standards, OCTA advan-                                 1
                                                                                          New England Eye Center and Tufts Medical Center, Tufts University, 260
tages are that it is non-invasive, acquires volumetric scans                             Tremont Street, Biewend Building, 9 - 11th Floor, Boston, MA 02116, USA.
                                                                                         2
                                                                                          Department of Electrical Engineering and Computer Science, and Research
that can be segmented to specific depths, uses motion                                    Laboratory of Electronics, Massachusetts Institute of Technology, Cambridge,
contrast instead of intravenous dye, can be obtained                                     MA 02139, USA. 3Department of Ophthalmology, Federal University of São
within seconds, provides accurate size and localization                                  Paulo, Escola Paulista de Medicina, São Paulo, Brazil. 4Retina Service, Neovista
                                                                                         Eye Center, Americana, Brazil.
information, visualizes both the retinal and choroidal
vasculature, and shows structural and blood flow infor-                                  Received: 6 February 2015 Accepted: 10 March 2015
mation in tandem. Disadvantages of OCTA are its limited
field of view, inability to view leakage, increased potential
for artifacts (blinks, movement, vessel ghosting), and inabil-                           References
                                                                                         1. Kim DY, Fingler J, Zawadzki RJ, Park SS, Morse LS, Schwartz DM, et al.
ity to detect blood flow below the slowest detectable flow.                                  Optical Imaging of the chorioretinal vasculature in the living human eye.
   OCTA has been shown to be a useful imaging modality                                       Proc Natl Acad Sci. 2013;110:14354–9.
for the evaluation of common ophthalmologic diseases                                     2. Choi W, Mohler KJ, Potsaid B, Lu CD, Liu JJ, Jayaraman V, et al.
                                                                                             Choriocapillaris and Choroidal Microvasculature Imaging with Ultrahigh
such AMD, diabetic retinopathy, artery and vein occlu-                                       Speed OCT Angiography. Plos One. 2013;8:e81499.
sions, and glaucoma. In some cases OCTA has even been                                    3. Schwartz DM, Fingler J, Kim DY, Zawadzki RJ, Morse LS, Park SS, et al.
shown to detect pathology not seen on FA. In the future,                                     Phase-variance optical coherence tomography: a technique for noninvasive
                                                                                             angiography. Ophthalmology. 2014;121:180–7.
faster scanning speeds would be crucial to obtain larger                                 4. Spaide RF, Klancnik JM, Cooney MJ. Retinal Vascular Layers Imaged by
fields of view with higher resolution. More studies are                                      Fluorescein Angiography and Optical Coherence Tomography Angiography.
needed to determine OCTA’s utility in the clinical setting                                   JAMA Ophthalmol. 2014; E1-6. doi:10.1001/jamaophthalmol.2014.3616.
                                                                                         5. Novotny HR, Alvis DL. A method of photographing fluorescence in
and to determine if this technology may offer a non-                                         circulating blood in the human retina. Circulation. 1961;24:82–6.
invasive option of visualizing the retinal vasculature in                                6. Novotny HR, Alvis D. A method of photographing fluorescence in
detail.                                                                                      circulating blood of the human eye. Tech Doc Rep SAMTDR USAF Sch
                                                                                             Aerosp Med. 1960;60–82:1–4.
                                                                                         7. Kogure K, Choromokos E. Infrared absorption angiography. J Appl Physiol.
Abbreviations                                                                                1969;26(1):154–7.
AMD: Age-related macular degeneration; BRAO: Branch retinal artery occlusion;            8. Yannuzzi LA, Slakter JS, Sorenson JA, Guyer DR, Orlock DA. Digital
BRVO: Branch retinal vein occlusions; CRAO: Central retinal artery occlusion;                indocyanine green videoangiography and choroidal neovascularization.
CRVO: Central retinal vein occlusions; CSCR: Central serous chorioretinopathy;               Retina. 1992;12(3):191–223.
CNV: Choroidal neovascularization; FA: Fluorescein angiography; FAZ: Foveal              9. Staurenghi G, Bottoni F, Giani A. Clinical Applications of Diagnostic
avascular zone; GCL: Ganglion cell layer; GA: Geographic atrophy; ICGA: Indocyanine          Indocyanine Green Angiography. In: Ryan SJ, Sadda SR, Hinton DR, editors.
green angiography; INL: Inner nuclear layer; IPL: Inner plexiform layer; ILM: Internal       Retina. London: Elsevier Saunders; 2013. p. 51–81.
limiting membrane; NVE: Neovascularization elsewhere; NVD: Neovascularization of         10. Johnson RN, Fu AD, McDonald HR, Jumper M, Ai E, Cunningham ET, et al.
the disc; NPDR: Non-proliferative diabetic retinopathy; OCT: Optical coherence               Fluorescein Angiography: Basic Principles and Interpretation. In: Ryan SJ,
tomography; OCTA: Optical coherence tomography angiography; OPL: Outer                       Sadda SR, Hinton DR, editors. Retina. London: Elsevier Saunders;
plexiform layer; RPED: Retinal pigment epithelial detachment; PCV: Polypoidal                2013. p. 2–50.
choroidal vasculopathy; PDR: Proliferative diabetic retinopathy; RAP: Retinal            11. Do DV, Gower EW, Cassard SD, Boyer D, Bressler NM, Bressler SB, et al.
angiomatous proliferation; RNFL: Retinal nerve fiber layer; RPE: Retinal pigment             Detection of New-Onset Choroidal Neovascularization Using Optical
epithelium; SD-OCT: Spectral domain optical coherence tomography; SSADA:                     Coherence Tomography: the AMD DOC Study. Ophthalmology.
Split-spectrum amplitude decorrelation angiography; SS-OCT: Swept source optical             2012;119:771–8.
coherence tomography; VCSEL: Vertical cavity surface emitting laser.                     12. Kotsolis AI, Killian FA, Ladas ID, Yannuzzi LA. Fluorescein Angiography
                                                                                             and Optical Coherence Tomography Concordance for Choroidal
Competing interests                                                                          Neovascularization in Multifocal Choroiditis. Br J Ophthalmol.
Financial Support: This work was supported in part by a Research to Prevent                  2010;94:1506–8.
Blindness Unrestricted grant to the New England Eye Center/Department of                 13. Do DV. Detection of New-Onset Choroidal Neovascularization. Curr Opin
Ophthalmology, Tufts University School of Medicine, and the Massachusetts                    Ophthalmol. 2013;24:224–7.
Lions Clubs.                                                                             14. Bressler NM, Bressler SB. Neovascular (Exudative or “Wet”) Age-Related
Financial Disclosure: Jay S. Duker is a consultant for and receives research                 Macular Degeneration. In: Ryan SJ, Sadda SR, Hinton DR, editors. Retina.
support from Carl Zeiss Meditech, Inc. and OptoVue, Inc.; André Romano is a                  London: Elsevier Saunders; 2013. p. 1183–212.
consultant for and receives research support from OptoVue, Inc.                          15. Yuan A, Kaiser PK. Branch Vein Occlusion. In: Ryan SJ, editor. Retina. 5th ed.
                                                                                             China: Saunders; 2013. p. 1029–38.
                                                                                         16. Kwiterovich KA, Maquire MG, Murphy RP, Schachat AP, Bressler NM,
Authors’ contributions                                                                       Bressler SB, et al. Frequency of adverse systemic reactions after fluorescein
TED drafted the article and created the figures. AR, NKW, and JSD each                       angiography. Results of a prospective study. Ophthalmology.
contributed to the conception and design of the article and critically revised
                                                                                             1991;98:1139–42.
the manuscript. All authors read and approved the final manuscript.                      17. Lopez-Saez MP, Ordoqui E, Tornero P, Baeza A, Sainza T, Zubeldia JM, et al.
                                                                                             Fluorescein-Induced Allergic Reaction. Ann Allergy Asthma Immunol.
Acknowledgements                                                                             1998;81:428–30.
The authors gratefully acknowledge Dr. James G. Fujimoto, Eric Moult, Chen               18. Matsunaga D, Puliafito CA, Kashani AH. OCT Angiography in Healthy Human
Lu, Jonathan Liu, Alex Cable, and Vijaysekhar Jayaraman for developing the                   Subjects. Ophthalmic Surg Lasers Imaging Retina. 2014;45(6):510–5.
prototype SS-OCTA system and processing the images used in three of our                  19. Jia Y, Bailey ST, Wilson DJ, Tan O, Klein ML, Flaxel CJ, et al. Quantitative
figures. Additionally we gratefully acknowledge Dr. Caroline R. Baumal and                   Optical Coherence Tomography Angiography of Choroidal
de Carlo et al. International Journal of Retina and Vitreous (2015) 1:5 Page 15 of 15
Neovascularization in Age-Related Macular Degeneration. Ophthalmology.
2014;121:1435–44.
20. Moult E, Choi W, Waheed NK, Adhi M, Lee B, Lu CD, et al. Ultrahigh-Speed
Swept-Source OCT Angiography in Exudative AMD. Ophthalmic Surg Lasers
Imaging Retina. 2014;45(6):496–505.
21. de Carlo TE, Bonini Filho MA, Chin AT, Adhi M, Ferrara D, Baumal CR, et al.
Spectral Domain Optical Coherence Tomography Angiography (OCTA) of
Choroidal Neovascularization. Ophthalmology. In press.
22. Jia Y, Morrison JC, Tokayer J, Tran O, Lombardi L, Baumann B, et al.
Quantitative OCT Angiography of Optic Nerve Head Blood Flow. Biomed
Opt Express. 2012;3(12):3127–37.
23. Jia Y, Wei E, Wang X, Zhang X, Morrison JC, Parikh M, et al. Optical
Coherence Tomography Angiography of Optic Disc Perfusion in Glaucoma.
Ophthalmology. 2014;7(121):1322–32.
Submit your next manuscript to BioMed Central
and take full advantage of:
• Convenient online submission
• Thorough peer review
• No space constraints or color figure charges
• Immediate publication on acceptance
• Inclusion in PubMed, CAS, Scopus and Google Scholar
• Research which is freely available for redistribution
Submit your manuscript at
www.biomedcentral.com/submitYou can also read