Age and Hydration of Competing Horses Influence the Outcome of Elite 160 km Endurance Rides - Refubium
←
→
Page content transcription
If your browser does not render page correctly, please read the page content below
ORIGINAL RESEARCH
                                                                                                                                                  published: 14 May 2021
                                                                                                                                          doi: 10.3389/fvets.2021.668650

                                             Age and Hydration of Competing
                                             Horses Influence the Outcome of
                                             Elite 160 km Endurance Rides
                                             Lena Bollinger 1*, Alexander Bartel 2 , Alina Küper 2 , Corinna Weber 3 and Heidrun Gehlen 1
                                             1
                                               Equine Clinic, Internal Medicine, Freie Universität Berlin, Berlin, Germany, 2 Institute for Veterinary Epidemiology and
                                             Biostatistics, Freie Universität Berlin, Berlin, Germany, 3 Laboklin Veterinary Laboratory Diagnostics, Bad Kissingen, Germany

                                             High elimination rates and the concern for horse welfare are important issues in
                                             endurance riding. An improved understanding of the causes of elimination could increase
                                             completion rates in this sport. We have identified pre-ride risk factors that allow an
                                             assessment of potential elimination before the ride. A longitudinal cohort study was
                                             performed among 49 healthy horses competing in the 160 km endurance ride at the 2016
                                             World Championship of Endurance Riding in Samorin/Slovakia. Blood samples were
                                             drawn before the ride. For statistical evaluation, horses were categorized in three groups:
                                             finishers, lame and metabolically eliminated horses. Risk factors were calculated for
                                             each group using multinomial logistic regression. A 1% increase in hematocrit levels was
                                             associated with a higher OR for elimination (lameness: OR 1.26, p = 0.017; metabolic:
                            Edited by:
                                             OR 1.34, p = 0.010). Furthermore, increased potassium values correlated negatively
                     Micaela Sgorbini,       with the race outcome. For a 1 mmol/l increase in potassium, the lameness OR was
                University of Pisa, Italy
                                             4.21, p = 0.039 and metabolic OR was 1.15, p = 0.848. Eight-year-old horses had
                        Reviewed by:
                                             a 100% elimination rate and survival analyses showed a significantly higher hazard for
              Eduard Jose-Cunilleras,
            Autonomous University of         elimination (p = 0.025). We thus conclude that age and hydration affect the outcome of
                      Barcelona, Spain       elite endurance rides. Further investigation of age as a risk factor seems to be clinically
                   Giuseppe Piccione,
            University of Messina, Italy
                                             relevant and adjustments of FEI qualification modes may be appropriate.
                   *Correspondence:          Keywords: endurance horse, endurance riding, World Championship, long-distance riding, infusion, risk
                        Lena Bollinger       factor, elimination, age requirements equestrian sports
          lbollinger@zedat.fu-berlin.de

                  Specialty section:         INTRODUCTION
       This article was submitted to
   Comparative and Clinical Medicine,        The demanding sport of endurance riding has come under scrutiny due to questions of horse
              a section of the journal       welfare and lethal injuries in the past decade (1–5). After the disastrous World Equestrian Games
      Frontiers in Veterinary Science
                                             in Tryon/USA in 2018, the World Equestrian Federation (FEI) began seeking solutions to improve
         Received: 16 February 2021          horse welfare as well as the public reputation of the sport (6). Elimination rates at international
            Accepted: 13 April 2021          rides have remained consistently high over the last years ranging between 50 and 80% while the
            Published: 14 May 2021
                                             speeds of the races have increased (5, 7).
                               Citation:        Following physical exercise, specific changes in metabolic reactions occur in athletic horse
        Bollinger L, Bartel A, Küper A,      leading to several changes in the body, mainly in the circulatory, respiratory, endocrine, and
    Weber C and Gehlen H (2021) Age
                                             neuromuscular systems (8). Changes taking place in these systems simultaneously and in an
  and Hydration of Competing Horses
Influence the Outcome of Elite 160 km
                                             integrated manner are aimed at maintaining homeostasis in the body (9). However, long-term
                     Endurance Rides.        physical exertion may result in disturbances of homeostasis, such as energy depletion and changes
             Front. Vet. Sci. 8:668650.      in fluids, electrolytes and acid-base balance, with negative consequences for health status and
      doi: 10.3389/fvets.2021.668650         performance of horse.

Frontiers in Veterinary Science | www.frontiersin.org                               1                                                May 2021 | Volume 8 | Article 668650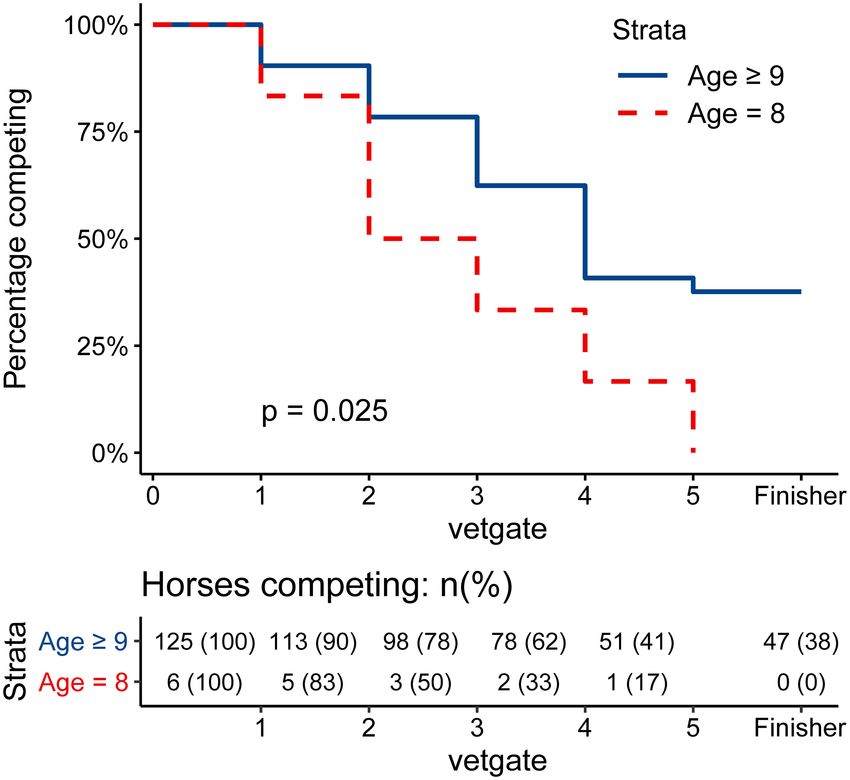
Bollinger et al.                                                                                                   Risk Factors in Endurance Rides

    In 2009, Jami Whiting (10) published an article outlining the          groups compared to finishers and whether certain pre-ride
special physiological characteristics of endurance horses after            parameters point to a later elimination. It seeks to provide
elimination. The author stated that many well-trained endurance            a better understanding of the risk factors leading to high
horses have low resting hematocrit levels compared to horses               elimination rates and horse fatalities. Furthermore, the study
of other disciplines. Therefore, even mild hematocrit elevations           offers recommendations for adapting FEI rules to improve overall
point to a severe problem (4, 11). This supports the argument              horse welfare.
of Fielding et al. who observed only small changes in laboratory
parameters in 30 endurance horses treated for colic following a
160 km ride (12). In addition, Whiting addressed the importance            MATERIALS AND METHODS
of sufficient hydration but did not further investigate water loss
and associated transportation stress (10). Despite the lack of any         During the 2016 World Championship of Endurance Riding
scientific foundation, infusions before the race are a common              in Samorin/Slovakia, blood samples were taken from 49
practice at international rides as riders hope to increase water           participating horses.
reserves in order to improve performance.                                      Participation in our study was voluntary and free of charge
    Stull and Rodiek and Padalino et al. performed research                for the participants. Information on the study was sent to
on transportation stress and measured correlating changes in               all starting national federations in advance via email, which
different blood parameters (13, 14). Hematocrite (HCT) and                 forwarded the information to their athletes. In addition, a
creatine kinase (CK) increased during transportation. At the               social media post was placed to reach as many participants
same time, white blood cells (WBC) showed a progressive                    as possible. Owner-informed consent was obtained before any
increase. They suspected these responses to influence the                  animal examination and sampling. The study was performed in
energy availability for athletic performance following a lengthy           accordance with EU Directive 2010/63/EU, the German Animal
transportation of horses (7). Horses of the Padalino study showed          Welfare Legislation and the guidelines of the Freie Universität
increased heart and respiratory rates, capillar refill time and            Berlin on the protection of animals used for scientific purposes.
neutrophil count (10).                                                     Diagnostic blood collection is a common pre-ride procedure
    Other risk factors for elimination may include venue- and              in elite equine athletes and constitutes a standard clinical
environment-related aspects (15), riding strategy (16), or high            veterinary practice. According to the mentioned legal regulations,
running speeds (17). Fielding et al. found breeds like Appaloosas          the study cannot legally beclassified as an animal experiment.
or Quarter horses to have a higher risk of elimination compared            Sampling therefore does not need any separate ethical approval,
to Arabians and crossbreeds. They considered this might be                 according to German legislation, as it is a common part of
due to a higher body mass index (18). In another retrospective             performance monitoring in endurance riding in accordance with
evaluation, it was suspected that age plays a role, but data               good veterinary practice. The blood sampling was performed by
for 160 km rides was only available for metabolic eliminations             trained veterinarians, while the owners or legal representatives
without any age relation (19). Among endurance riders, the view            (FEI licensed and accredited trainers) were present.
is common that horses reach their performance peak between 11                  The horses included in the study started for a total of 23
and 13 years of age. This is supported by a study comparing the            nations (Algeria, Australia, Bahrain, Belgium, Chile, Colombia,
metabolism of six-year-old horses with the metabolism of horses            Croatia, Denmark, Ecuador, Germany, United Kingdom,
with a mean age of 10.2 ± 2.0 years (20). Among humans, a recent           Hungary, Italy, Malaysia, Netherlands, Norway, Portugal, Russia,
study defined the best finishing age for ultra-marathon runners            South Africa, Sweden, Thailand, Uruguay, USA). Relevant
between 35 and 45 years (21). Taking this into consideration—              information of the horses’ signalment (sex, age, breed, color) was
along with high speeds as well as horse fatalities—the questions           taken from the FEI Horse Database. According to the FEI Data,
arise whether most horses even reach their best performance age            40 horses were purebred or crossbred Arabians. Four horses were
and how long horses can actually endure in this sport (22, 23).            listed as “other” and five horses were referred to as “unknown”
However, there is no valid data on how many horses fail to reach           in the database (Table 1).
the actively competing age of 10 or older and how long they                    According to qualification criteria, all horses were at least 8
perform in endurance riding.                                               years old and had successfully finished at least one 160 km ∗∗∗
    During the statistical evaluation, only few of the past                three star ride with a minimum average speed of 14 km/h in the
publications related to endurance riding used confounder                   past 24 months, and two 120 km ∗∗ two start rides or higher in
adjustment (17, 18). Special focus must be placed on the non-              their career (15, 26). All horses were up to date on influenza
confounder study of Trigo et al. which found HCT, plasma                   vaccines as required by the FEI.
protein and CK to be valid parameters for risk assessment (24).                During the race, the average outside temperature was 18.9◦ C
Nevertheless, as elimination risk seems to be the result of multiple       with 83% humidity. The track was mostly flat with no significant
factors, confounder adjustment is indispensable.                           hills. The weather was partly cloudy with repeating rain showers
    To our knowledge, there have not been any scholarly                    and moderate wind speed.
publications using data of international championships, which                  The time between transportation, arrival at the venue and
provide a study population of the world’s best horses. This                blood sampling differed among the horses ranging from 5 days
study addresses the questions (25) whether lameness and                    before to the morning of the day before the start. All samples
metabolic status are linked by distinguishing between the two              were drawn between 9:33 a.m. and 8:38 p.m.: 32.7% between

Frontiers in Veterinary Science | www.frontiersin.org                  2                                       May 2021 | Volume 8 | Article 668650
Bollinger et al. Risk Factors in Endurance Rides
TABLE 1 | Distributional characteristics of the study population and summary statistics of blood values.
Finished Lameness Metabolic Missing
n 18 20 11
Sex (%) 8 (44.4) 11 (55.0) 7 (63.6) 0%
Male
Female 10 (55.6) 9 (45.0) 4 (36.4)
Age [median (range)] Years 12.0 (9.0, 16.0) 11.0 (8.0, 17.0) 11.0 (8.0, 17.0) 0%
Weight [median (range)] kg 405.0 (345.0, 440.0) 402.0 (350.0, 450.0) 408.0 (380.0, 450.0) 0%
Time between blood sampling Days 2.8 (1.1) 2.7 (0.9) 3.0 (0.8) 0%
and race [mean (SD)]
Breed (%) 8 (44.4) 10 (50.0) 6 (54.5) 0%
Purebred Arabians
Anglo-Arabians 2 (11.1) 5 (25.0) 0 (0.0)
Shagya-Arabians 2 (11.1) 2 (10.0) 0 (0.0)
Arabian Partbreds 1 (5.6) 0 (0.0) 3 (27.3)
Other 2 (11.1) 1 (5.0) 1 (9.1)
Unknown 3 (16.7) 2 (10.0) 1 (9.1)
Infusion (%) 4 (26.7) 13 (65.0) 8 (72.7) 6.1%
No
Yes 11 (73.3) 7 (35.0) 3 (27.3)
Median (range) 106 /mm3 6.9 (5.8, 8.6) 8.0 (6.2, 11.0) 7.7 (5.8, 9.4) 0%
RBC
HGB g/dl 12.1 (9.8, 14.2) 13.1 (10.8, 17.7) 12.9 (9.6, 15.7) 0%
HCT % 32.8 (26.7, 39.5) 37.8 (28.8, 50.0) 37.0 (28.2, 45.4) 0%
MCV µm3 47.0 (45.0, 52.0) 48.0 (45.0, 51.0) 48.0 (46.0, 50.0) 0%
MCH pg 16.9 (15.2, 21.1) 16.8 (15.4, 19.0) 16.7 (14.4, 19.1) 0%
MCHC g/dl 35.6 (33.9, 41.5) 35.0 (33.2, 41.3) 34.6 (30.7, 39.7) 0%
RDW % 17.0 (16.1, 18.1) 17.0 (15.8, 18.2) 17.5 (16.3, 17.8) 0%
PLT 103 /mm3 173.0 (120.0, 213.0) 185.5 (130.0, 214.0) 182.0 (157.0, 217.0) 0%
MPV µm3 5.6 (5.1, 6.1) 5.6 (5.2, 6.4) 5.5 (5.0, 5.8) 0%
WBC 103 /mm3 8.0 (5.6, 12.3) 9.1 (5.6, 14.3) 8.4 (5.1, 13.5) 0%
LYM 103 /mm3 2.2 (1.3, 3.4) 2.5 (1.5, 5.0) 2.6 (1.5, 3.2) 0%
LYM % % 29.4 (22.1, 38.1) 27.5 (17.6, 37.4) 28.7 (20.4, 37.4) 0%
MON % % 5.3 (2.6, 7.8) 5.6 (2.3, 8.7) 5.8 (1.9, 8.7) 0%
GRA 103 /mm3 5.0 (3.3, 8.5) 6.2 (3.8, 9.0) 5.8 (3.3, 9.2) 0%
GRA % % 66.2 (54.2, 74.4) 67.4 (56.2, 77.7) 65.7 (56.8, 77.5) 0%
EOS % % 1.5 (0.5, 3.8) 1.5 (0.7, 8.0) 1.7 (0.7, 4.6) 0%
Potassium mmol/l 3.2 (1.8, 4.8) 3.6 (2.5, 4.4) 3.4 (2.0, 4.0) 0%
Sodium mmol/l 135.0 (131.0, 138.0) 135.0 (131.0, 138.0) 134.0 (130.0, 138.0) 2%
Total calcium mmol/l 3.1 (2.9, 3.3) 3.1 (2.9, 3.3) 3.1 (3.0, 3.3) 0%
CK U/l 244.5 (164.0, 420.0) 314.5 (214.0, 1217.0) 250.0 (184.0, 432.0) 0%
WBC, white blood cells; LYM, absolute lymphocytes; LYM%, relative lymphocytes, MON, absolute monocytes; MON%, relative monocytes (MON%); EOS%, relative eosinophils; GRA,
absolute granulocytes; GRA%, relative granulocytes; RBC, red blood cells; HBG, hemoglobin; MCV, mean corpuscular volume; MCHC, mean corpuscular hemoglobin concentration;
MCH, mean corpuscular hemoglobin; RDW, red cell distribution width; PLT, absolute thrombocytes; MPV, mean platelet volume; CK, creatine kinase.
9 a.m. and 2 p.m. and 67.3% between 3 p.m. and 9 p.m. Before unknown, so these animals were excluded from the statistical
the sampling, each horse underwent a general examination in evaluation of the “infusion” variable.
accordance with the endurance rules, excluding gait. Heartrate, Overall, 9.8 ml jugular venous blood was collected using the
skin turgor, mucosal membrane, back and girth, gut sounds and Braun vacutainer R system (Melsungen, Germany) with a 20-
muscle turgor were recorded. Horses were not fastened. Weight gauge-needle. Each horse was sampled with one 4 ml 13 × 75 mm
was measured using standardized weight measuring tape. PET hemogard K2 EDTA 1.8 mg/ml tube and one 4 ml 13 ×
The horses’ presenters (rider, owner, groom, or team vet) were 75 mm PET hemogard lithium heparin 17 IU/ml.
asked to report any treatment the horse had undergone within the Two laboratory technicians conducted the blinded testing at
last 7 days, especially fluid substitution directly prior to traveling the temporary laboratory set up at the venue. EDTA blood was
or directly after arriving at the venue. For three horses this was used for hematology evaluation in the Scil VET ABC (Viernheim,
Frontiers in Veterinary Science | www.frontiersin.org 3 May 2021 | Volume 8 | Article 668650Bollinger et al. Risk Factors in Endurance Rides
Germany): white blood cells (WBC), absolute lymphocytes TABLE 2 | Dropout percentage by age.
(LYM), relative lymphocytes (LYM%), absolute monocytes
Age in years All competing horses Study population
(MON), relative monocytes (MON%), relative eosinophils
(EOS%), absolute granulocytes (GRA), relative granulocytes Dropout (%) n Dropout (%) n
(GRA%), red blood cells (RBC), hemoglobin (HGB), mean
8 100 6 100 4
corpuscular volume (MCV), mean corpuscular hemoglobin
concentration (MCHC), mean corpuscular hemoglobin (MCH), 9 62.5 24 75 8
red cell distribution width (RDW), absolute thrombocytes 10 42.9 21 42.9 7
(PLT) and mean platelet volume (MPV) were measured. A 11 70 20 71.4 7
12 61.9 21 57.1 7
lithium-heparin tube was used for the commercially available
biochemistry panel in the VetScanVS2 (Abaxis, USA) with an 13 57.1 14 33.3 6
14 83.3 12 50 2
Equine Profile rotor with full blood to measure sodium (Na+),
15 66.7 6 66.7 3
potassium (K+), creatin kinase (CK) and calcium (Ca+2).
16 66.7 3 50 2
Chloride was not included in the rotor and therefore could not be
17 75 4 100 3
measured. According to requirements of Abaxis, Lithium heparin
was spinned off at 4,000 g/4 min if hematocrit was >50% and then
plasma was used for the Equine Profile Rotor. If hematocrit wasBollinger et al. Risk Factors in Endurance Rides
Forty-nine horses were included in the study. None of the resulted in a small decrease of the effect on the overall blood
horses showed abnormalities in the pre-sampling examination values. This is an indicator that pre- or post-transport infusion
and all passed the pre-ride inspection. Of the 49 horses only explains a small portion of the observed value changes.
(23 mares/26 geldings), 11 horses (22.45%) were eliminated
for metabolic issues, 20 horses (40.82%) were eliminated for
lameness issues and 18 horses (36.73%) finished the race. The DISCUSSION
median age of the horses sampled was 12.0 (9.0, 16.0) for
finishers, 11.0 (8.0, 17.0) for lame and 11.0 (8.0, 17.0) for We analyzed race results, blood parameters and pre-race
metabolic horses. treatments of 49 horses competing in the World Championship
The median weight of the horses was 405.0 (345.0, 440.0) kg of Endurance Riding. To our knowledge, this was the first
for finishers, 402.0 (350.0, 450.0) kg for lame and 408.0 (380.0, time horses of an international endurance championship
450.0) kg for metabolic horses. were examined.
All variables presented in the following section were adjusted We hypothesized that the change of different blood values
for age, sex and weight. Only small changes in blood values prior to the ride would affect the chance of elimination.
were observed. None of the findings showed any indication of Differences among blood samples of the finishers, lame and
a pathological process. metabolic eliminated horses in electrolytes and red blood cell
The reference value for all following parameters is the median count were expected. The study showed that reduced values
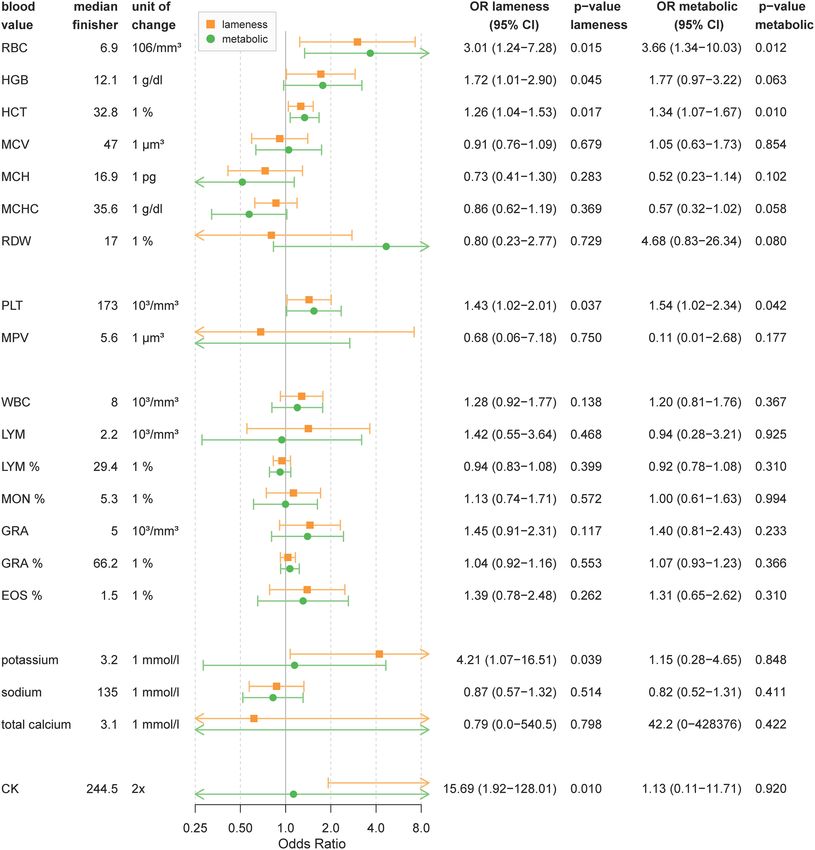
of finisher horses and can be seen in Figure 2. of red blood cell count with lowered potassium had a positive
As Figure 2 shows, for every 1% increase in hematocrit levels, impact on the outcome of the competition. Also, older horses
horses had a 1.3-times higher chance of lameness and a 1.3- with fluid substitution pre- or post-transportation had a higher
times higher chance of metabolic elimination. An increase of possibility of completing the race.
one unit of red blood cells (106 /mm3 ) resulted in a 3.0-times The fact that sampling only took place before one race,
higher chance of lameness and a 3.7-times higher chance of multiple parameters were evaluated and there were only 49
metabolic elimination. Horses with an increased hemoglobin participating horses must be kept in mind as limitations of
(g/dl) before the race had a 1.7-times higher chance of lameness this observational study. In addition, sampling times among
and a 1.8-times higher chance for metabolic elimination per one the analyzed horses were not standardized as riders were not
unit increase. A higher amount of PLT increased the chance of willing to change their regular routine due to the ride being a
elimination for lameness by 1.4 and metabolic reasons by 1.5 for championship. Further information on the “infusion” variable—
every increase by 103 /mm3 . especially precise application times and individual transportation
Horses showing a significant elevation of CK before the duration—were not provided by the presenters. A recent long-
competition had a 15.7-times higher chance of elimination term evaluation showed a consistently decreasing starting age
for lameness for every doubling of the CK value. CK did among horses since 2004 (7). The study indicated that the most
not contribute to metabolic elimination. Pre-race elevation of reliable age for finishing is between 10 and 15, with chances of
potassium increased the chance of lameness elimination to 4.2- finishing increasing with every additional year of age. As heart
times per one unit compared to finishing horses but did not affect rate variability also improves with age, it does not seem surprising
the chance of metabolic elimination. that age may affect the chance of finishing (30). Numbers of
Other measures of blood cell count or electrolytes only had starting and therefore included horses for analyzing the effect
a minor impact on the ride outcome (see Figure 2). Unadjusted of age could not be influenced by the authors and were the
OR are reported in Supplementary Table 2. highest in 10 years, except for Aachen 2006 (159 starting horses)
Eleven out of 18 horses of the finisher group (73.3%), seven and only minimally higher numbers in Euston Park 2012 (147
out of 20 horses of the lameness group (35.0%) and 3 out of 11 starting horses).
horses of the metabolic group (27.3%) had received an infusion The tendency of having horses start at a younger age
(intravenous administration of fluids) prior to or directly after must be viewed very critically. Due to current FEI endurance
transport. Horses that had received an infusion prior to or regulations and international qualification modes, horses can
directly after transport had 82% reduced odds of lameness (OR start as early as 5 years of age and may enter international
= 0.181; 95% CI 0.038–0.851; P = 0.031) and 88% reduced odds rides only 1 year later. Young horses are, therefore, at risk
(OR = 0.116; 95% CI 0.017–0.763; P = 0.025) of metabolic of not reaching the best performance age due to severe
elimination after adjusting for age, sex and weight. Horses that health issues resulting from early heavy and fast training.
had received fluid support traveled between 4 and 10 h without In the observed race, younger horses were more at risk
a recreational break. Horses traveling longer spent an overnight of metabolic elimination than older horses (compared to
break midway so individual traveling times did not exceed 10 h lameness) and it is particularly notable that none of the 8-
according to the presenter. All horses with fluid substitution year-old horses finished the race. In addition, younger horses
had received 5–10 L of 0.9% sodium chloride on the day of were also eliminated earlier from the race than older horses.
transportation. None of the horses receiving infusions after Taking these findings into consideration, we recommend to
transport were sampled on the day of arrival. reconsider the starting age for CEI ∗∗∗ 160 km races and the
As a sensitivity analysis, we adjusted the blood values using minimum period between first qualification ride and first possible
multinomial logistic regression for the infusion, which only international start.
Frontiers in Veterinary Science | www.frontiersin.org 5 May 2021 | Volume 8 | Article 668650Bollinger et al. Risk Factors in Endurance Rides FIGURE 2 | Blood value odds ratios for lameness or metabolic elimination. The figure shows odds ratios for elimination due to lameness or metabolic reasons depending on blood values based on 49 horses. Odds ratio are calculated for changes by one unit of change. OR above 1 mean that the odds of elimination increases with blood values higher than the finisher group. For OR below 1 the odds for elimination is higher for blood values lower than the finisher group. OR are shown as point estimates (circle or square) with 95% confidence intervals as error bars. Orange shows OR for lameness and green show OR for metabolic elimination. P-values below 0.05 can be considered significant. WBC, white blood cells; LYM, absolute lymphocytes; LYM%, relative lymphocytes; MON, absolute monocytes; MON%, relative monocytes (MON%); EOS%, relative eosinophils; GRA, absolute granulocytes; GRA%, relative granulocytes; RBC, red blood cells; HBG, hemoglobin; MCV, mean corpuscular volume; MCHC, mean corpuscular hemoglobin concentration; MCH, mean corpuscular hemoglobin; RDW, red cell distribution width; PLT, absolute thrombocytes; MPV, mean platelet volume; CK, creatine kinase. Further investigation of age influencing finisher rates, competitive and therefore may have had encouraged riders to especially in combination with speed, is needed. Due to the push the horses further than during normal rides (15). To make ride being a championship, the atmosphere has been more more general statements, measurements and analysis should Frontiers in Veterinary Science | www.frontiersin.org 6 May 2021 | Volume 8 | Article 668650
Bollinger et al.                                                                                                    Risk Factors in Endurance Rides

be repeated under different conditions. The sampling included              altitude training in elite compared to non-elite athletes turned out
only one ride with moderate temperatures. The number of                    not to bring any further improvement (46, 47). An explanation
participating horses for the parameter age was evaluated for the           for this quite surprising result might be that increased values
49 study horses and compared to the over-all number of 131                 of HGB, HCT, and RBC could be an indicator for a reduced
starting horses. Since these numbers were similar, we assume our           hydration status. The hydration status being a possible cause
results to be transferable. A retrospective evaluation of age and          of many problems leading to higher elimination rates is
point of elimination of older championships could give useful              supported by Whiting (10). Insufficient hydration can be
information. Further investigation of the risk factor age of the           caused by stress during transportation (14), a lack of pre-
authors is in progress.                                                    or post-transportation fluid substitution, insufficient food and
    Regarding the connection between weight and race results,              water intake, mismanagement in training, or uncomfortable
Fielding et al. have already stipulated that the risk of elimination       accommodation. With regard to clinical relevance, the authors
increases among breeds associated with a higher body mass                  see pre-ride testing of hematology and CK as a useful tool to
index (18). According to our results, the weight of the                    identify potential risk factors of elimination.
horse may influence the chance of metabolic elimination.                       The study measured total calcium as this was included in the
Although medians of weight in our study were similar among                 Equine Profile Rotor of Abaxis. For clinical use ionized calcium
the tested groups, the interval for lame horses was slightly               is preferred.
wider than for finisher horses. The weight interval for horses                 Chloride was not measured due to the use of commercially
eliminated for metabolic reasons was notably higher and wider              available testing kits on the venue. As chloride is one of
(380.0, 450.0 kg) and could not be explained by the difference             the main electrolytes altered in endurance horses the missing
in breeds.                                                                 measurement of chloride and the measurement of total calcium
    Previous studies show a wide individual range for CK in                reflect limitations in the study design.
finisher horses and CK alone does not serve as an indicator                    In order to compare hematology parameters, a standardized
for successful race completion (31, 32). Therefore isolated                testing period before the ride is necessary. Sampling times could
CK values must always be evaluated in combination with                     not be standardized due to the design of the study. As the FEI
clinical appearance and other laboratory parameters, such as               rules do not allow any needle insertion into the skin from 2 h
myeloperoxidase or elastase or in combination with HCT as listed           before the pre-ride inspection until the end of the race, sampling
below (33). Elevated pre-competition CK values in our study                of all horses 48 h before the race until 2 h before the pre-ride
population point to a significantly increased risk of elimination          inspection would have been a proper time frame in order to
due to lameness. This might be caused by muscular damage                   standardize the procedure. However, as mentioned before, this
(34) resulting from over-training, transportation stress (35),             was not possible as horses underwent individual routines the
insufficient recovery breaks (36) before the ride or reduced               handlers did not want to adjust to a study protocol. HCT values
renal elimination (37) due to dehydration (38). All these points           of >40% and CK values of 470 U/l or higher may point to
influence potential muscle performance and, as a result, may lead          uncompensated problems. Trigo et al. use HCT > 52% and CK
to lameness elimination in the race (39).                                  >12.6 ui/l as cut-off values, which seem too high according to
    The study data showed no major differences within the red              our findings (24). A possible explanation for the significantly
blood cells and related parameters of lame and metabolic horses.           different figures may be the fact that all horses in this study
However, these were significantly elevated compared to finishing           count among the world’s elite compared to more amateur horses
horses. Values of RBC, PLT, HGB, and HCT in healthy horses                 in Trigos et al.’s work. Moreover, Trigo et al.’s study included
can be affected by numerous factors, such as dilution, medical             different ride lengths in the evaluation (15∗ one star rides,
and supplemental support (e.g., iron), management, time of                 9∗∗ two star rides and 12∗∗∗ three star rides on international
sampling, exercise prior to the ride, or individual horse traits.          FEI CEI level). Taking these numbers into consideration, the
However, these factors have been consistent among all competing            authors recommend withdrawing affected horses from the race. A
horses and are, therefore, not expected to play a role. Feeding            potential treatment of these animals to improve blood values does
has been identified as increasing HCT due to the loss of fluid             not seem compatible with horse welfare, as the time frame would
in saliva and the gastrointestinal tract (40). According to the            be too short for secure and sufficient recovery. However, more
presenters, all of the horses had been offered hay continuously            testing with greater numbers of horses is necessary to validate
since arriving at the venue, which may have had a slight impact            exact figures, possibly distinguishing between ride lengths as well
on our numbers.                                                            as amateur vs. elite horses.
    Higher values of HGB and RBC in horses can also be caused by               This study cannot determine whether finisher horses had
altitude training or the administration of erythropoietin during           been hydrated sufficiently or whether eliminated horses had been
training (41, 42). Generally, elevated numbers of HGB and RBC              hydrated insufficiently prior to the race.
are considered to have a positive impact on performance (41, 42).              Our results show that low values of potassium were associated
In contrast, low values for HCT, RBC, PLT, and HBG seemed                  with a higher chance of finishing. According to our study, horses
to influence the outcome positively in our study. As altitude              with higher potassium levels are more likely to be eliminated due
training has been reported to be a common measure in human                 to lameness. This confirms the findings of Fraipoint (48). The
athletes to increase HGB and RBC and to enhance performance                underlying clinical mechanism likely is an increased potassium
(43–45), this would confirm doubts in human medicine that                  excretion in the animal’s urine, as McKeever et al. found in

Frontiers in Veterinary Science | www.frontiersin.org                  7                                       May 2021 | Volume 8 | Article 668650
Bollinger et al. Risk Factors in Endurance Rides
1987. Only 5 weeks of training induced hypervolemia, reduced Retrospective evaluations of weight, especially age combined
potassium plasma levels as well as osmotic renal clearance (49). with speed and the duration of horses’ endurance careers may
The potassium excretion is the result of an increased renal lead to valuable insights in order to improve horse welfare and
as well as fecal elimination, naturally associated with increased training in the future.
water loss (50). A decrease in hydration then leads to a reduced
blood flow, followed by reduced muscle perfusion resulting in
lameness and increased CK values. It is also possible that pre-
DATA AVAILABILITY STATEMENT
ride increased plasma values of potassium prevent further muscle Aggregate participant data that underlie the results are available
cell leakage of potassium leading to muscle fatigue (51, 52). from the corresponding author on reasonable request. Results
Another result of increased potassium might be neuromuscular data is available in the supplement and under https://inside.fei.
hyperexcitability, which could also result in elimination (53). org/fei/disc/endurance/main-events/endurance-past.
Since potassium plasma levels and HCT can be modified by
training, both values in our study represent real alterations (49).
As all nations in our study used 0.9% sodium chloride for fluid ETHICS STATEMENT
substitution, lower values of potassium in finishers may also be
the result of forced hydration due to the Na+-K+-ATPase. Ethical review and approval was not required for the animal
However, our sensitivity analysis showed that the changes study because the study was performed in accordance with EU
in blood values cannot solely be explained by pre- and Directive 2010/63/EU, the German Animal Welfare Legislation
post-transportation fluid substitution. It must be taken into and the Guidelines of the Freie Universität Berlin on the
consideration that this investigation might not be related to protection of animals used for scientific purposes. Diagnostic
the common practice of infusion 1 day before the race. Time blood collection is a common pre-ride procedure in elite
between sampling and last fluid administration differed and equine athletes and constitutes a standard clinical veterinary
6.1% of the study population could not give any information practice. According to the mentioned legal regulations, the
on fluid substitution. As feeding strategies were not assessed, it study cannot legally be classified as an animal experiment.
is also possible electrolyte values were influenced by nutritional Sampling therefore does not need any separate ethical approval,
supplementation (50). according to German legislation, as it is a common part of
Stress of transportation has been addressed as a major issue performance monitoring in endurance riding in accordance with
in other studies before and is highly likely to affect performance good veterinary practice. The blood sampling was performed by
(54). According to Padalino et al. Arabians and crossbred trained veterinarians, while the owners or legal representatives
Arabians are more susceptible to transportation stress (54). (FEI licensed and accredited trainers) were present. Written
When arriving at the venue, horses’ body reserves have been informed consent for participation was not obtained from
strained and time for compensation before the competition is the owners because Information on the study was sent to
short. Barton et al. found lactate to be lower in horses that had all starting national federations in advance via email, which
spent more time at the event venue compared to those staying forwarded the information to their athletes. In addition, a social
there for shorter periods (55). media post was placed to inform the endurance community.
This raises the question of whether pre- or post-transport fluid Verbal consent was obtained before any animal examination
substitution is an indicator for more professional management and sampling.
of a horse’s metabolism, and whether it might be a proxy
for advanced feeding, medical supplementation, transportation AUTHOR CONTRIBUTIONS
strategies and further optimization. However, we assume fluid
substitution surrounding the transport including all related LB and HG have set up the hypothesis, experimental design,
practices may have a positive effect on finishing. organized, conducted the experiments, analyzed, interpreted
the results, and wrote and revised the mauscript. AB and AK
analyzed, interpreted the results, and wrote and revised the
CONCLUSION manuscript. CW has set up the hypothesis, experimental design,
Our study for the first time assessed differences between finishers organized, conducted the experiments, and wrote and revised the
and eliminated endurance horses in a world championship. mauscript. All authors contributed to the article and approved
It indicates that more research on transportation stress the submitted version.
of endurance horses, the questionable procedure of forced
hydration and its effect on race outcome is necessary. An FUNDING
observational study fully capturing pre-race management and
transport factors that could explain our observed blood value Verein deutscher Distanzreiter (German endurance riding
changes is needed. association): 500 Euros for accomodation in Samorin.
We also recommend a randomized controlled trial for the ProSAANI Gmbh, Germany: articles of daily use such as
effect of pre-race infusion on finishing as this is a common swabs, alcohol, needles, one Abaxis VetScan2 machine and
procedure in top-level endurance horses. a Vet ABC lab machine. Sartorius Lab Instruments GmbH
Frontiers in Veterinary Science | www.frontiersin.org 8 May 2021 | Volume 8 | Article 668650Bollinger et al. Risk Factors in Endurance Rides
& Co. KG: one medical pipette and tips. Scil animal care ACKNOWLEDGMENTS
company GmbH: Rotors for the Abaxis VetScan (Equine
Profile Rotor), two Scil Vet ABC machines and one Abaxis We kindly thank all supporters who made this project possible,
VetScan2 machine, evaluation software for lab machines. especially the Open Access Funding provided by the Freie
B. Braun Melsungen AG, Germany: tubes of the vacutainer Universität Berlin.
system. Andreas Hettich GmbH & Co. KG, Germany:
two centrifuges to spin off the blood. Crowdfunded on SUPPLEMENTARY MATERIAL
Startnext/Sciencestarter: https://www.startnext.com/en/
endurancehorses - 8519 Euros -used for lab fees of blood The Supplementary Material for this article can be found
samples. Schaumann Stiftung: 3000 Euros - used for online at: https://www.frontiersin.org/articles/10.3389/fvets.
lab fees. 2021.668650/full#supplementary-material
REFERENCES outcomes (2012-2015). Vet J. (2018) 236:37–43. doi: 10.1016/j.tvjl.2018.
04.012
1. Cuckson P. Exhausted Winner Provokes New Endurance Controversy. Aurora, 18. Fielding CL, Meier CA, Balch OK, Kass PH. Risk factors for the elimination of
ON: Horse Canada (2018). endurance horses from competition. J Am Vet Med Assoc. (2011) 239:493–8.
2. Kyriacou L. UAE Endurance Season Begins With More Horse Deaths. Asnières- doi: 10.2460/javma.239.4.493
sur-Seine: Grandprix Replay (2018). 19. Bennet ED, Parkin TD. Fédération Equestre Internationale endurance events:
3. Cuckson P. FEI Aims for More Transparency Over Endurance Horse Deaths. Risk factors for failure to qualify outcomes at the level of the horse, ride and
Aurora, ON: Horse Canada (2017). rider (2010-2015). Vet J. (2018) 236:44–8. doi: 10.1016/j.tvjl.2018.04.011
4. Balch O, Habing G, Schott H, II. Fatalities associated with American 20. Luck MM, Le Moyec L, Barrey E, Triba MN, Bouchemal N, Savarin P,
endurance ride conference sanctioned endurance rides (2002-2013). Equine et al. Energetics of endurance exercise in young horses determined by
Vet J. (2014) 46:11. doi: 10.1111/evj.12267_32 nuclear magnetic resonance metabolomics. Front Physiol. (2015) 6:198.
5. FEI Endurance Reports and Statistics. (2017). Available online at: https:// doi: 10.3389/fphys.2015.00198
inside.fei.org/fei/disc/endurance/report-stats (accessed February 16, 2021). 21. Knechtle B, Nikolaidis PT. Physiology and pathophysiology in ultra-marathon
6. SGI. Statement on Equine Fatality—FEI World Equestrian GamesTM Tryon. running. Front Physiol. (2018) 9:634. doi: 10.3389/fphys.2018.00634
Lausanne: SGI (2018). 22. Coombs SL, Fisher RJ. Endurance riding in 2012: too far too fast? Vet J. (2012)
7. Di Battista C, Conte M, Pepe M, Petrizzi L, Beccati F. Epidemiology 194:270–1. doi: 10.1016/j.tvjl.2012.10.037
and risk factors for eliminations from Fédération Equestre Internationale 23. Nagy A, Dyson SJ, Murray JK. A veterinary review of endurance
endurance rides between 2004-2015 in Italy. Prev Vet Med. (2019) 170:104737. riding as an international competitive sport. Vet J. (2012) 194:288–93.
doi: 10.1016/j.prevetmed.2019.104737 doi: 10.1016/j.tvjl.2012.06.022
8. Piccione G, Arfuso F, Fazio F, Bazzano M, Giannetto C. Serum 24. Trigo P, Castejon F, Riber C, Muñoz A. Use of biochemical parameters to
lipid modification related to exercise and polyunsaturated fatty predict metabolic elimination in endurance rides. Equine Vet J Suppl. (2010)
acid supplementation in jumpers and thoroughbred horses. J Equine 38:142–6. doi: 10.1111/j.2042-3306.2010.00238.x
Vet Sci. (2014) 34:1181–7. doi: 10.1016/j.jevs.2014.07.005 25. Schott HC, Marlin DJ, Geor RJ, Holbrook TC, Deaton CM, Vincent T, et al.
9. Arfuso F, Giannetto C, Giudice E, Fazio F, Piccione G. Dynamic modulation Changes in selected physiological and laboratory measurements in elite horses
of platelet aggregation, albumin and nonesterified fatty acids during competing in a 160 km endurance ride. Equine Vet J Suppl. (2006) 38:37–42.
physical exercise in Thoroughbred horses. Res Vet Sci. (2016) 104:86–91. doi: 10.1111/j.2042-3306.2006.tb05510.x
doi: 10.1016/j.rvsc.2015.11.013 26. FEI. FEI 2016 World Endurance Championships Qualification Criteria.
10. Whiting J. The exhausted horse. Curr Ther Equine Med. (2009) 6:926–9. Lausanne: FEI (2016).
11. Carlson GP. Physiologic response to endurance exercise. In: Proc 25th Ann 27. Wood SN. Fast stable restricted maximum likelihood and marginal likelihood
Conf Am Ass Equi Pract. Yardley, PA (1980). p. 459–68. estimation of semiparametric generalized linear models. J R Stat Soc B (Stat
12. Fielding CL, Magdesian KG, Rhodes DM, Meier CA, Higgins JC. Clinical and Methodol). (2011) 73:3–36. doi: 10.1111/j.1467-9868.2010.00749.x
biochemical abnormalities in endurance horses eliminated from competition 28. Textor J, van der Zander B, Gilthorpe MS, Liskiewicz M, Ellison GT. Robust
for medical complications and requiring emergency medical treatment: 30 causal inference using directed acyclic graphs: the R package ‘dagitty’. Int J
cases (2005-2006). J Vet Emerg Crit Care (San Antonio). (2009) 19:473–8. Epidemiol. (2016) 45:1887–94. doi: 10.1093/ije/dyw341
doi: 10.1111/j.1476-4431.2009.00441.x 29. FEI Championships in Endurance—Past Editions. (2012). Available online
13. Stull CL, Rodiek AV. Physiological responses of horses to 24 hours of at: https://inside.fei.org/fei/events/championships/endurance-past (accessed
transportation using a commercial van during summer conditions. J Anim February 16, 2021).
Sci. (2000) 78:1458–66. doi: 10.2527/2000.7861458x 30. Younes M, Robert C, Barrey E, Cottin F. Effects of age, exercise duration,
14. Padalino B, Raidal SL, Carter N, Celi P, Muscatello G, Jeffcott L, and test conditions on heart rate variability in young endurance horses. Front
et al. Immunological, clinical, haematological and oxidative responses to Physiol. (2016) 7:155. doi: 10.3389/fphys.2016.00155
long distance transportation in horses. Res Vet Sci. (2017) 115:78–87. 31. Volfinger L, Lassourd V, Michaux JM, Braun JP, Toutain PL. Kinetic
doi: 10.1016/j.rvsc.2017.01.024 evaluation of muscle damage during exercise by calculation of
15. Nagy A, Murray JK, Dyson SJ. Horse-, rider-, venue- and environment- amount of creatine kinase released. Am J Physiol. (1994) 266:R434–41.
related risk factors for elimination from Fédération Equestre Internationale doi: 10.1152/ajpregu.1994.266.2.R434
endurance rides due to lameness and metabolic reasons. Equine Vet J. (2014) 32. Wilberger MS, McKenzie EC, Payton ME, Rigas JD, Valberg SJ. Prevalence of
46:294–9. doi: 10.1111/evj.12170 exertional rhabdomyolysis in endurance horses in the Pacific Northwestern
16. Marlin D, Williams J. Equine endurance race pacing strategy and United States. Equine Vet J. (2015) 47:165–70. doi: 10.1111/evj.12255
performance in 120-km single-day races. J Equine Vet Sci. (2018) 67:87–90. 33. Serteyn D, Sandersen C, Lejeune J-P, La Rebière Pouyade G de, Ceusters J,
doi: 10.1016/j.jevs.2018.03.013 Mouithys-Mickalad A, et al. Effect of a 120 km endurance race on plasma and
17. Bennet ED, Parkin TD. Fédération Equestre Internationale (FEI) muscular neutrophil elastase and myeloperoxidase concentrations in horses.
endurance events: riding speeds as a risk factor for failure to qualify Equine Vet J Suppl. (2010) 38:275–9. doi: 10.1111/j.2042-3306.2010.00269.x
Frontiers in Veterinary Science | www.frontiersin.org 9 May 2021 | Volume 8 | Article 668650Bollinger et al. Risk Factors in Endurance Rides
34. Kuipers H. Exercise-induced muscle damage. Int J Sports Med. (1994) 15:132– 47. Jensen K, Nielsen TS, Fiskestrand A, Lund JO, Christensen NJ, Sechef NH.
5. doi: 10.1055/s-2007-1021034 High-altitude training does not increase maximal oxygen uptake or work
35. Wessely-Szponder J, Bełkot Z, Bobowiec R, Kosior-Korzecka U, Wójcik M. capacity at sea level in rowers. Sand J Med Sci Sports. (2007) 3:256–62.
Transport induced inflammatory responses in horses. Pol J Vet Sci. (2015) doi: 10.1111/j.1600-0838.1993.tb00391.x
18:407–13. doi: 10.1515/pjvs-2015-0052 48. Fraipont A, van Erck E, Ramery E, Richard E, Denoix J-M, Lekeux
36. Machado M, Willardson JM. Short recovery augments magnitude of muscle P, et al. Subclinical diseases underlying poor performance in endurance
damage in high responders. Med Sci Sports Exerc. (2010) 42:1370–4. horses: diagnostic methods and predictive tests. Vet Rec. (2011) 169:154.
doi: 10.1249/MSS.0b013e3181ca7e16 doi: 10.1136/vr.d4142
37. Castejón F, Trigo P, Muñoz A, Riber C. Uric acid responses to endurance 49. McKeever KH, Schurg WA, Jarrett SH, Convertino VA. Exercise training-
racing and relationships with performance, plasma biochemistry induced hypervolemia in the horse. Med Sci Sports Exerc. (1987) 19:21–7.
and metabolic alterations. Equine Vet J Suppl. (2006) 36:70–3. doi: 10.1249/00005768-198702000-00005
doi: 10.1111/j.2042-3306.2006.tb05516.x 50. Jansson A, Lindholm A, Lindberg JE, Dahlborn K. Effects of potassium intake
38. Ozkan I, Ibrahim CH. Dehydration, skeletal muscle damage and inflammation on potassium, sodium and fluid balance in exercising horses. Equine Vet J
before the competitions among the elite wrestlers. J Phys Ther Sci. (2016) Suppl. (1999) 30:412–7. doi: 10.1111/j.2042-3306.1999.tb05257.x
28:162–8. doi: 10.1589/jpts.28.162 51. Kilburn KH. Muscular origin of elevated plasma potassium during exercise. J
39. Muñoz A, Cuesta I, Riber C, Gata J, Trigo P, Castejón FM. Trot asymmetry Appl Physiol. (1966) 21:675–8. doi: 10.1152/jappl.1966.21.2.675
in relation to physical performance and metabolism in equine endurance 52. Hess TM, Kronfeld DS, Carter RA, Treiber KH, Byrd BM, Staniar WB, et al.
rides. Equine Vet J Suppl. (2006) 36:50–4. doi: 10.1111/j.2042-3306.2006.tb0 Does usefulness of potassium supplementation depend on speed? Equine Vet
5512.x J Suppl. (2006) 36:74–9. doi: 10.1111/j.2042-3306.2006.tb05517.x
40. Snow DH, Kerr MG, Nimmo MA, Abbott EM. Alterations in blood, sweat, 53. Padalino B, Hall E, Raidal S, Celi P, Knight P, Jeffcott L, et al. Health problems
urine and muscle composition during prolonged exercise in the horse. Vet and risk factors associated with long haul transport of horses in Australia.
Rec. (1982) 110:377–84. doi: 10.1136/vr.110.16.377 Animals (Basel). (2015) 5:1296–310. doi: 10.3390/ani5040412
41. McKeever KH, McNally BA, Hinchcliff KW, Lehnhard RA, Poole DC. 54. Padalino B, Raidal SL, Hall E, Knight P, Celi P, Jeffcott L, et al. Risk factors in
Effects of erythropoietin on systemic hematocrit and oxygen transport equine transport-related health problems: a survey of the Australian equine
in the splenectomized horse. Respir Physiol Neurobiol. (2016) 225:38–47. industry. Equine Vet J. (2017) 49:507–11. doi: 10.1111/evj.12631
doi: 10.1016/j.resp.2016.02.001 55. Barton MH, Williamson L, Jacks S, Norton N. Body weight, hematologic
42. Wickler SJ, Anderson TP. Hematological changes and athletic performance in findings, and serum and plasma biochemical findings of horses competing
horses in response to high altitude (3,800 m). Am J Physiol Regul Integr Comp in a 48-, 83-, or 159-km endurance ride under similar terrain and weather
Physiol. (2000) 279:R1176–81. doi: 10.1152/ajpregu.2000.279.4.R1176 conditions. Am J Vet Res. (2003) 64:746–53. doi: 10.2460/ajvr.2003.64.746
43. Durussel J, Daskalaki E, Anderson M, Chatterji T, Wondimu DH,
Padmanabhan N, et al. Haemoglobin mass and running time trial Conflict of Interest: CW was employed by the company Laboklin GmbH &
performance after recombinant human erythropoietin administration in Co. KG.
trained men. PLoS ONE. (2013) 8:e56151. doi: 10.1371/journal.pone.0
056151 The remaining authors declare that the research was conducted in the absence of
44. Levine BD, Stray-Gundersen J. “Living high-training low”: effect of moderate- any commercial or financial relationships that could be construed as a potential
altitude acclimatization with low-altitude training on performance. J Appl conflict of interest.
Physiol. (1997) 83:102–12. doi: 10.1152/jappl.1997.83.1.102
45. Wolski LA, McKenzie DC, Wenger HA. Altitude training for improvements in Copyright © 2021 Bollinger, Bartel, Küper, Weber and Gehlen. This is an open-access
sea level performance. Is the scientific evidence of benefit? Sports Med. (1996) article distributed under the terms of the Creative Commons Attribution License (CC
22:251–63. doi: 10.2165/00007256-199622040-00004 BY). The use, distribution or reproduction in other forums is permitted, provided
46. Gore C, Craig N, Hahn A, Rice A, Bourdon P, Lawrence S, et al. Altitude the original author(s) and the copyright owner(s) are credited and that the original
training at 2690 m does not increase total Haemoglobin mass or sea level publication in this journal is cited, in accordance with accepted academic practice.
VO2max in world champion track cyclists. J Sci Med Sport. (1998) 1:156–70. No use, distribution or reproduction is permitted which does not comply with these
doi: 10.1016/S1440-2440(98)80011-X terms.
Frontiers in Veterinary Science | www.frontiersin.org 10 May 2021 | Volume 8 | Article 668650You can also read