AN EVOLUTIONARY PORTRAIT OF THE PROGENITOR SARS-COV-2 AND ITS DOMINANT OFFSHOOTS IN COVID-19 PANDEMIC
←
→
Page content transcription
If your browser does not render page correctly, please read the page content below
An Evolutionary Portrait of the Progenitor SARS-CoV-2 and Its
             Dominant Offshoots in COVID-19 Pandemic
             Sudhir Kumar ,*,1,2,3 Qiqing Tao ,1,2 Steven Weaver,1,2 Maxwell Sanderford,1,2
             Marcos A. Caraballo-Ortiz,1,2 Sudip Sharma,1,2 Sergei L.K. Pond,*,1,2 and Sayaka Miura*,1,2
             1
              Institute for Genomics and Evolutionary Medicine, Temple University, Philadelphia, PA, USA
             2
              Department of Biology, Temple University, Philadelphia, PA, USA
             3
              Center for Excellence in Genome Medicine and Research, King Abdulaziz University, Jeddah, Saudi Arabia
             *Corresponding authors: E-mails: s.kumar@temple.edu; spond@temple.edu; sayaka.miura@temple.edu.
             Associate editor: Meredith Yeager

                                                                                                                                                                       Downloaded from https://academic.oup.com/mbe/article/38/8/3046/6257226 by guest on 05 November 2021
             Abstract
             Global sequencing of genomes of severe acute respiratory syndrome coronavirus 2 (SARS-CoV-2) has continued to reveal
             new genetic variants that are the key to unraveling its early evolutionary history and tracking its global spread over time.
             Here we present the heretofore cryptic mutational history and spatiotemporal dynamics of SARS-CoV-2 from an analysis
             of thousands of high-quality genomes. We report the likely most recent common ancestor of SARS-CoV-2, reconstructed
             through a novel application and advancement of computational methods initially developed to infer the mutational
             history of tumor cells in a patient. This progenitor genome differs from genomes of the first coronaviruses sampled in
             China by three variants, implying that none of the earliest patients represent the index case or gave rise to all the human
             infections. However, multiple coronavirus infections in China and the United States harbored the progenitor genetic
             fingerprint in January 2020 and later, suggesting that the progenitor was spreading worldwide months before and after
             the first reported cases of COVID-19 in China. Mutations of the progenitor and its offshoots have produced many
             dominant coronavirus strains that have spread episodically over time. Fingerprinting based on common mutations
             reveals that the same coronavirus lineage has dominated North America for most of the pandemic in 2020. There
             have been multiple replacements of predominant coronavirus strains in Europe and Asia as well as continued presence of
             multiple high-frequency strains in Asia and North America. We have developed a continually updating dashboard of
             global evolution and spatiotemporal trends of SARS-CoV-2 spread (http://sars2evo.datamonkey.org/).
             Key words: coronavirus, web tool, phylogeny.

             Introduction                                                                           sequenced early on (December 2019 and January 2020)
Article

                                                                                                    (Andersen et al. 2020; Castells et al. 2020; Gomez-Carballa
             The early evolutionary history of severe acute respiratory syn-                        et al. 2020; Lai et al. 2020; Mavian et al. 2020; Morel et al.
             drome coronavirus 2 (SARS-CoV-2), which causes COVID-19,                               2021; Pipes et al. 2021; Wenzel 2020). Without a reliable root
             remains unclear despite an unprecedented scope of global                               of the SARS-CoV-2 phylogeny, the most recent ancestor se-
             genome sequencing of SARS-CoV-2 and a multitude of phy-                                quence cannot be accurately reconstructed, and it is also not
             logenetic analyses (Forster et al. 2020; Lemey et al. 2020;                            possible to assess the genetic diversity of SARS-CoV-2 that
             Rambaut, Holmes, et al. 2020; Tang et al. 2020; Worobey et                             existed at the time of its first outbreak. Consequently, we
             al. 2020; Chiara et al. 2021; da Silva Filipe et al. 2021;                             cannot determine if any of the coronaviruses isolated to
             Komissarov et al. 2021; Lemieux et al. 2021; Pekar et al.                              date carry the genome of the progenitor of all human
             2021). Sophisticated investigations have shown that tradi-
Fast Track

                                                                                                    SARS-CoV-2 infections. Knowing the progenitor genome
             tional molecular phylogenetic analyses do not produce reli-                            will also help determine how close the earliest patients sam-
             able evolutionary inferences about the early history of SARS-                          pled in China are to “patient zero,” that is, the first human
             CoV-2 due to low sequence divergence, a limited number of                              transmission case.
             phylogenetically informative sites, and the ubiquity of se-                               The orientation and order of early mutations giving rise to
             quencing errors (De Maio et al. 2020; Mavian et al. 2020;                              common coronavirus variants will also be compromised if the
             Turakhia et al. 2020). In particular, the root of the SARS-                            earliest coronavirus isolates are incorrectly used to root the
             CoV-2 phylogeny remains elusive (Morel et al. 2021; Pipes                              SARS-CoV-2 phylogenies (Dearlove et al. 2020; Fauver et al.
             et al. 2021) because the closely related nonhuman coronavi-                            2020; StefanelLi et al. 2020; Tang et al. 2020). Some investiga-
             rus (outgroups) are more than 1,100 base differences from                              tions of COVID-19 patients and their coronaviruses’ genomes
             human SARS-CoV-2 genomes, as compared with fewer than                                  already reported the presence of multiple variants (Lu et al.
             30 differences between human SARS-CoV-2 genomes’                                       2020), as genomes of viral samples from December 2019 in
             ß The Author(s) 2021. Published by Oxford University Press on behalf of the Society for Molecular Biology and Evolution.
             This is an Open Access article distributed under the terms of the Creative Commons Attribution License (http://creativecommons.org/
             licenses/by/4.0/), which permits unrestricted reuse, distribution, and reproduction in any medium, provided the original work is
             properly cited.                                                                                                                       Open Access
             3046                             Mol. Biol. Evol. 38(8):3046–3059 doi:10.1093/molbev/msab118 Advance Access publication May 4, 2021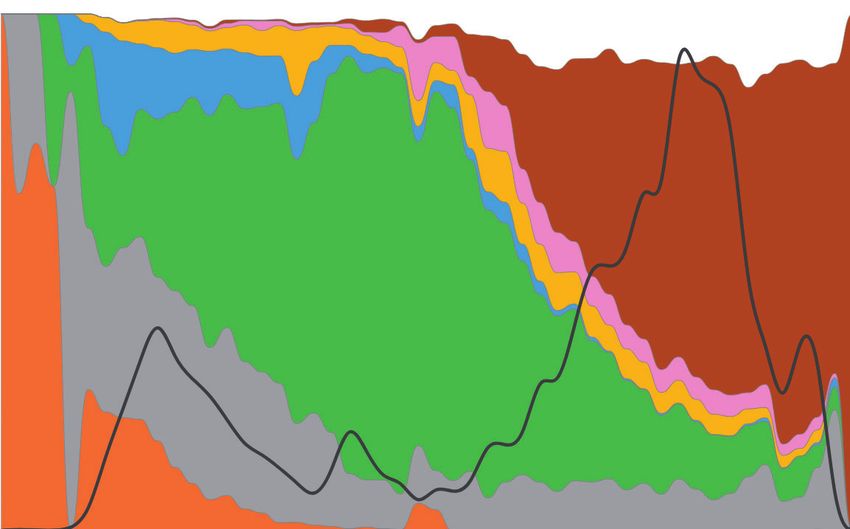
Progenitor SARS-CoV-2 and Its Dominant Offshoots in COVID-19 Pandemic . doi:10.1093/molbev/msab118                    MBE
China had as many as five differences. These observations           approach. We also devised a bootstrap procedure to place
require an explicit test to see if one of the early sampled         confidence limits on the inferred mutation order in which
coronavirus genomes was the progenitor of all the strains           bootstrap replicate data sets are generated by sampling
infecting humans.                                                   genomes with replacement.
   Traditionally, ancestral sequences are estimated using a            Here we present results from analyses of two snapshots of
rooted phylogeny (Yang et al. 1995; Nei and Kumar 2002).            the fast-growing collection of SARS-CoV-2 genomes to make
This ancestral sequence can then be compared with the se-           inferences and assess the robustness of the inferred muta-
quenced genomes to locate the one that is most similar to           tional histories to the growing genome collection that is
the inferred progenitor and/or placed closest to the root in        expanding at an unprecedented rate. We first present results
the phylogeny. However, as noted above, attempts using ad           from the 29KG data set and then evaluate the concordance of
hoc and traditional methods are fraught with difficulties and       the mutational history inferred by using an expanded 68KG
have not produced consistent and robust results (Morel et al.       data set, which establishes that the conclusions are robust to
2021; Pipes et al. 2021). Some methods also incorporate sam-        the sampling of genomes. The first snapshot was retrieved

                                                                                                                                     Downloaded from https://academic.oup.com/mbe/article/38/8/3046/6257226 by guest on 05 November 2021
pling times in phylogenetic inference, but they will automat-       fromGISAID (Shu and Mccauley 2017) on July 7, 2020 and
ically favor placing the earliest sampled genomes at or near        consisted of 60,332 genomes. Of these, 29,681 were selected
the root of the tree. This fact introduces circularity in testing   because they were longer than the 28,000 bases threshold we
the hypothesis that the earliest sampled genomes were an-           imposed (29KG data set) and did not include an excessive
cestral because sampling time is used in the inference proce-       number of unresolved bases in any genomic regions. This
dure (Pipes et al. 2021; Pekar et al. 2021).                        second snapshot was acquired on October 12, 2020 from
                                                                    GISAID and contained 133,741 genomes, of which 68,057
                                                                    genomes met the inclusion criteria (68KG data set).
Results and Discussion                                                 We then applied mutational fingerprints inferred using the
A Mutational Order Approach for SARS-CoV-2                          68KG data set to an expanded data set of 172,480 genomes
We applied a mutational order approach (MOA) to directly            (sampled on December 30, 2020; 172KG) to track global spa-
reconstruct the ancestral sequence and the mutational his-          tiotemporal dynamics SARS-CoV-2. We have also set up a live
tory of CoV-2 genomes (Jahn et al. 2016; Ross and Markowetz         dashboard showing regularly updated results because the
2016; Miura et al. 2018). MOA does not infer phylogeny as an        processes of data analysis, manuscript preparation, and peer
intermediate step. It is often used to build the evolutionary       review of scientific articles are much slower than the pace of
history of tumor cells that evolve clonally and without re-         expansion of SARS-CoV-2 genome collection. Also, we pro-
combination. This approach is suitable for analyzing SARS-          vide a simple “in-the-browser” tool to classify any SARS-CoV-
CoV-2 genomes because of their quasi-species evolutionary           2 genome based on key mutations derived by the MOA anal-
behavior (clonal) and the lack of evidence of significant re-       ysis (http://sars2evo.datamonkey.org/).
combination within human outbreaks (Richard et al. 2020),
both of which preserve the collinearity of variants in genomes.
Although reports of recombination among circulating SARS-           Mutational History and Progenitor of SARS-COV-2
CoV-2 genomes have begun to appear (Jackson et al. 2020),           We used MOA to reconstruct the history of mutations that
the fraction of circulating recombinant strains is likely very      gave rise to 49 common single nucleotide variants (SNVs) in
small and geographically limited and will not affect analyses       the 29KG data set. These variants occur with >1% variant
conducted on sequences sampled in 2020. This feature per-           frequency (vf > 1%)—a threshold chosen to avoid including
mits effective use of shared co-occurrence of variants in           variants that may be due to sequencing errors (fig. 1a). To
genomes and the frequencies of individual variants for infer-       simplify notation, we used the inferred mutation history to
ring the mutational history, notwithstanding the presence of        denote key groups of mutations by assigning Greek symbols
sequencing errors and other artifacts (Kim and Simon 2014;          (l, , a, b, c, d, and e) to them. Individual mutations were
Jahn et al. 2016) (see Materials and Methods).                      assigned numbers and letters based on the reconstructed
   We advanced MOA to make it applicable for analyzing              order and their parent-offspring relationships (table 1). We
SARS-CoV-2 genomes. Thus was needed because the normal              estimated the timing of mutation for each mutation based on
cell sequence in tumors provides the ancestral (noncancer-          the timestamp of the viral samples’ genome sequences in
ous) genome sequence to orient the mutational changes, but          which it first appeared (table 1, see Materials and
such a direct ancestor is not available for coronaviruses in        Methods). The inferred mutation order was in excellent
which the closest outgroup sequences are over 30 times more         agreement with the temporal pattern of the first appearance
different than any two SARS-CoV-2 strains. Also, SARS-CoV-2         of variants in the 29KG data set. The timestamp of 47 out of
genome evolution may not satisfy the perfect phylogeny as-          49 mutations was greater than or equal to the timestamp of
sumption because some genomic positions have likely expe-           the corresponding preceding mutation in mutational history.
rienced multiple and recurrent mutations (van Dorp et al.           The exceptions were seen for two low-frequency offshoot
2020; Martin et al. 2021). So, we used shared co-occurrence of      mutations (b3b and b3c; see Materials and Methods). This
variants among genomes to reduce the impact of the viola-           concordance provides independent validation of the recon-
tion of the perfect phylogeny assumption and select muta-           structed mutation graph because neither sampling dates nor
tion orientations and histories in the maximum likelihood           locations were used in MOA analysis.
                                                                                                                             3047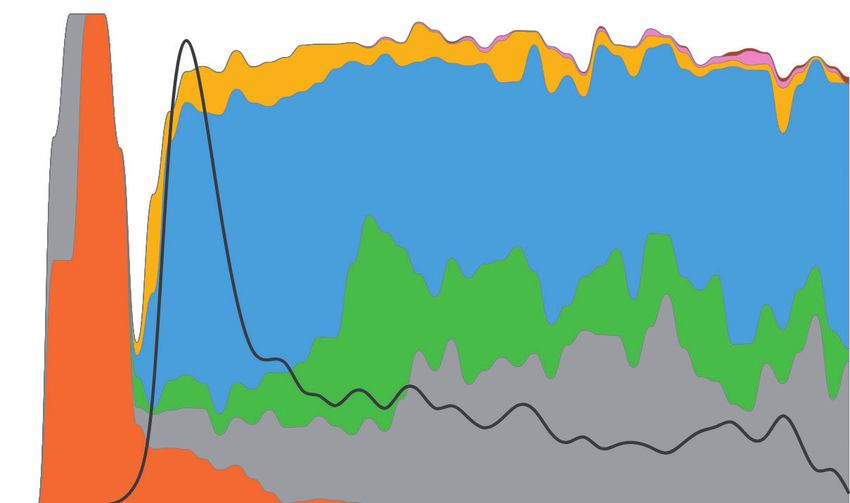
Kumar et al. . doi:10.1093/molbev/msab118                                                                                                      MBE
 (a)                                                                                         New variants occurred in the genomic background of the
    Number of SNVs
                       10,000                                               4,376         variants preceding them in the reconstructed mutation his-
                                                                      966                 tory with a very high propensity (co-occurrence index, COI >
                                                                420
                                                                                          84%; fig. 2), except for one low-frequency offshoot mentioned
                            100                         49 80                             above (b3b; COI ¼ 54%). Overall, these results suggest a
                                                   18
                                         6   9                                            strong signal to infer a sequential mutational history, even
                                                                                          though a small minority of sequences at a position may have
                                1                                                         experienced homoplasy or recurrent mutations. Indeed, a
                                                                                          bootstrap analysis involving genome resampling to assess
                                                                                          the robustness of the mutation history produced high boot-
                                                  SNV frequency                           strap confidence levels (BCLs) for key groups of mutations as
 (b)                                                                                      well as many offshoots (fig. 2; BCL > 95%).
   Number of genomes

                                                                                                                                                              Downloaded from https://academic.oup.com/mbe/article/38/8/3046/6257226 by guest on 05 November 2021
                       5000
                       4000
                       3000
                                                                                          Episodic Evolution and Selection
                                                                                          The order of some mutations in the mutational history is not
                       2000
                                                                                          established with high BCLs, for example, the relative order of
                       1000
                                                                                          e1, e2, and e3 mutations. This is because the three e variants
                            0
                                                                                          almost always occur together (7,624 genomes), and the in-
                                    0    2   4    6     8 10 12 14 16 18 20 22 24 26 28
                                                                                          termediate combinations of e variants were found in only 42
                                                 Weeks aer December 24, 2019             genomes. Similarly, the count of genomes harboring all three
                                                                                          b variants (22,739 genomes) far exceeded those with two or
 (c)                                                                                      fewer b variants (201 genomes). There is a strong temporal
  differences from proCoV2

                                             NCBI reference
                                4                                                         tendency of variants to be sampled together (e.g., e1–e3 and
                                                     GISAID reference
      Number of base

                                3            15                                           a1a–a1d), suggesting an episodic spread of variants (Wald–
                                2                                                         Wolfowitz run tests P  0.01; see Materials and Methods)
                                        Earliest sample
                                1
                                        (Wuhan-1)
                                                                                          that does not allow for determining the precise order of
                                                                                    2
                                0                                                         some mutations’ appearance. Episodic variant spread may
                                                                                          be caused by founder effects, positive selection, or both
                                                                                          (e.g., MacLean et al. 2021). It may also be an artifact of highly
                                                          Sampling date                   uneven regional and temporal genome sequencing that will
                                                                                          produce a biased representative sample of the actual world-
 (d)                                                                                      wide population (fig. 1b).
                                                                                              In this mutation history, the ratio of nonsynonymous to
   Number of genomes

                       8

                       6                                                                  synonymous changes (N/S) is 1.9, which is almost ten times
                                                                                          larger than their ratio of 0.18 for the inferred proCoV2 and
                       4
                                                                                          observed Bat CoV proteins. The McDonald–Kreitman test
                       2                                                                  (McDonald and Kreitman 1991) rejected the similarity of
                       0                                                                  molecular evolutionary patterns observed within the SARS-
                            12 22 28 32 36 41 45 52 60 69 77 83 87 93 98                  CoV-2 population (29KG data set) and between human
                                             Days aer December 24, 2019
                                                                                          proCoV2 and the bat coronavirus. However, the selective in-
                                                                                          terpretation of such a difference is complicated by the fact
FIG. 1. Counts of SNVs and genomes in the 29KG data set. (a)                              that polymorphisms in SARS-CoV-2 genomes are affected by
Cumulative count of SNVs presented in the 29KG genome data set                            molecular mechanisms (e.g., RNA editing) (Giorgio et al. 2020;
at different frequencies. (b) The number of genomes in the 29KG                           Rice et al. 2021), not just selection, and slightly deleterious
collection that were isolated weekly during the pandemic. (c) The                         alleles can become common when there is a population ex-
number of base differences from proCoV2 (see fig. 2) for genomes                          pansion (Casals and Bertranpetit 2012). Furthermore, selec-
sampled in December 2019 and January 2020. The 18 genomes sam-                            tion may have played a significant role during the divergence
pled in December 2019 in China (red) have three common SNVs
                                                                                          of human CoV-2 and bat CoV sequences (MacLean et al.
different from proCoV2. In contrast, six genomes sampled in
January 2020 in China (Asia, red) and the United States (North
                                                                                          2021; Martin et al. 2021; Tegally et al. 2021). Nevertheless,
America, blue) show no base differences. Multiple genomes (2 and                          N/S patterns derived from common variants show that mo-
15) were sampled on two different days. (d) Temporal and spatial                          lecular evolutionary patterns observed within SARS-CoV-2
distribution of strains identical to proCoV2 at the protein sequence                      genomes infecting humans differ from those spanning the
level, that is, they have only l mutations. The color scheme used to                      divergence between the bat RaTG13 and SARS-CoV-2
mark sampling locations is shown in panel b.                                              genomes, even though positive selection in the early SARS-

3048
Progenitor SARS-CoV-2 and Its Dominant Offshoots in COVID-19 Pandemic . doi:10.1093/molbev/msab118 MBE
Table 1. SARS-CoV-2 variants in 29KG dataset.
Mutant Mutant Gene Genomic Nucleotide Amino acid Time Variant Genomes First
(major) (minor) Position change change (days) Frequency mapped location
l1 ORF1ab 2416 U>C 0 98.1% 0 China, Asia
l2 ORF1ab 19524 U>C 0 98.6% 0 China, Asia
l3 S 23929 U>C 0 98.4% 18 China, Asia
a1 ORF1ab 18060 U>C 0 95.1% 849 China, Asia
a1a N 28657 C>U 63 1.3% 2 France, Europe
a1b ORF1ab 9477 U>A F>Y 63 1.2% 3 France, Europe
a1c N 28863 C>U S>L 63 1.2% 5 France, Europe
a1d ORF3a 25979 G>U G>V 63 1.2% 344 France, Europe
a2 ORF1ab 8782 U>C 0 91.0% 47 China, Asia
a3 ORF8 28144 C>U S>L 0 90.8% 1115 China, Asia
a3a ORF1ab 1606 U>C 43 1.7% 501 United Kingdom, Europe
Downloaded from https://academic.oup.com/mbe/article/38/8/3046/6257226 by guest on 05 November 2021
a3b ORF1ab 11083 G>U L>F 24 9.2% 376 China, Asia
a3c N 28311 C>U P>L 64 1.9% 3 South Korea, Asia
a3d ORF1ab 13730 C>U A>V 71 1.8% 3 Taiwan/Malaysia, Asia
a3e ORF1ab 6312 C>A T>K 71 1.7% 483 Taiwan/Malaysia, Asia
a3f ORF3a 26144 G>U G>V 28 5.1% 121 China, Asia
a3g ORF1ab 14805 C>U 54 6.0% 334 United Kingdom, Europe
a3h ORF1ab 17247 U>C 64 2.0% 580 Switzerland, Europe
a3i ORF1ab 2558 C>U P>S 54 1.7% 26 United Kingdom, Europe
a3j ORF1ab 2480 A>G I>V 54 1.6% 462 United Kingdom, Europe
b1 ORF1ab 3037 C>U 31 77.0% 11 China, Asia
b2 S 23403 A>G D>G 31 77.1% 36 China, Asia
b3 ORF1ab 14408 C>U P>L 41 76.9% 3032 Saudi Arabia, Middle
East
b3a ORF1ab 20268 A>G 64 5.7% 1213 Italy, Europe
b3b N 28854 C>U S>L 29 3.1% 527 China, Asia
b3c ORF1ab 15324 C>U 29 2.3% 678 China, Asia
b3d ORF3a 25429 G>U V>L 77 1.7% 485 United Kingdom, Europe
b3e N 28836 C>U S>L 74 1.6% 3 Switzerland, Europe
b3f ORF1ab 13862 C>U T>I 74 1.6% 50 Switzerland, Europe
b3g ORF1ab 10798 C>A D>E 86 1.4% 414 United Kingdom, Europe
c1 ORF3a 25563 G>U Q>H 41 29.8% 884 Saudi Arabia, Middle
East
c1a ORF1ab 18877 C>U 41 4.0% 757 Saudi Arabia, Middle
East
c1b M 26735 C>U 41 1.5% 439 Saudi Arabia, Middle
East
d1 ORF1ab 1059 C>U T>I 54 23.0% 5157 Singapore, Asia
d1a S 24368 G>U D>Y 75 1.3% 389 Sweden, Europe
d1b ORF8 27964 C>U S>L 76 2.7% 790 USA, North America
d1c ORF1ab 11916 C>U S>L 72 1.6% 166 USA, North America
d1d ORF1ab 18998 C>U A>V 72 1.0% 305 USA, North America
e1 N 28881 G>A R>K 54 25.7% 2 United Kingdom, Europe
e2 N 28882 G>A R>K 54 25.7% 2 United Kingdom, Europe
e3 N 28883 G>C G>R 54 25.7% 5365 United Kingdom, Europe
e3a ORF1ab 313 C>U 66 2.1% 608 USA, North America
e3b ORF1ab 19839 U>C 64 1.5% 452 Switzerland, Europe
e3c M 27046 C>U T>M 69 1.6% 453 Worldwide
e3d ORF1ab 10097 G>A G>S 69 2.5% 5 Denmark, Europe
e3e S 23731 C>U 69 2.5% 403 Denmark, Europe
e3f N 28580 G>U D>Y 69 1.2% 353 Chile, South America
m1 ORF1ab 17858 A>G Y>C 59 4.7% 32 USA, North America
m2 ORF1ab 17747 C>U P>L 59 4.7% 1374 USA, North America
*Amino acid change is shown only for non-synonymous change.
CoV-2 pandemic history may have been limited (Chiara et al. globally, henceforth proCoV2, and was likely carried by the
2021; MacLean et al. 2021). “first detectable” case of human transmission in the COVID-
19 pandemic (index case). A comparison of proCoV2 with
The Progenitor Genome and the Index Case Wuhan-1 genomes revealed three differences in 49 positions
The root of the mutation tree is the most recent common analyzed, which was also true for other reference genomes
ancestor (MRCA) of all the genomes analyzed, which gave rise (fig. 1c). This suggests that the Wuhan-1 (EPI_ISL 402123) and
to two early coronavirus lineages ( and a; fig. 2). The MRCA the other earliest sampled genomes are derived coronavirus
genome was the progenitor of all SARS-CoV-2 infections strains that arose from proCoV2 after the divergence of and
3049Kumar et al. . doi:10.1093/molbev/msab118 MBE
98% 100%
S:n.U>C
1 2 3
33% 33%
proCoV2
1ab:n.U>C 1ab:n.U>C
N:n.C>U 1ab:p.F>Y
99% 99%
1ab:n.U>C
1a 1b
1 100% 34%
60% 97%
99%
2 1 100% 100%
100% N:p.S>L 1c
1ab:n.U>C
1ab:p.P>L 1ab:p.Y>C 68% 99%
2
3a:p.G>V 1d
Downloaded from https://academic.oup.com/mbe/article/38/8/3046/6257226 by guest on 05 November 2021
100% 100%
1ab:p.L>F
1ab:p.A>V N:p.P>L
100%
8:p.S>L
89% 84% 98%
3b 3a
3d 90%
3c
99% 100% 3 100%
1ab:p.T>K 1ab:n.U>C
100% 100%
3e
3f 3a:p.G>v Wuhan-1
1ab:n.C>U
1
100% 79%
1ab:p.P>S
100% 52% 100%
3i 1ab:n.C>U
3g
100%
S:p.D>G
3a:p.V>L 2 1ab:n.A>G N:p.S>L
3j 3h 54%
3d 52% 100%
1ab:p.I>V 1ab:n.U>C 3a 100% 3b
1ab:p.P>L
1ab:p.D>E 1ab:p.T>I N:p.S>L
100% 99% 100% 3 97%
3g 3f 3e 3c
86% 86% 86% 100%
1ab:n.C>U 1ab:n.C>U
M:n.C>U
N:p.R>K
3a:p.Q>H
93% 98%
1b
1a 1 1
100% 100%
100% 99% 59% 100%
Asia South America Africa 1ab:p.A>V 1ab:p.S>L
1ab:p.T>I
Europe North America Oceania
N:p.R>K
100% 98%
Middle East 1d 1c 1 2
100% 100%
100% 98% 78% 100%
8:p.S>L
N:p.G>R
1b
90% 100% 97%
S:p.D>Y 1a 3 3d 3e 3f
59.5% 96.5% 96.5%
62% 98%
1ab:p.G>S S:n.C>U N:p.D>Y
3a 3b 3c
1ab:n.C>U 1ab:n.U>C M:p.T>M
FIG. 2. Mutational history graph of SARS-CoV-2 from the 29KG data set. Thick arrows mark the pathway of widespread variants (frequency, vf
3%), and thin arrows show paths leading to other common mutations (3% > vf > 1%). The pie-chart sizes are proportional to variant frequencies in
the 29KG data set, with pie-charts shown for variants with vf > 3% and pie color based on the world’s region where that mutation was first
observed. A circle is used for all other variants, with the filled color corresponding to the earliest sampling region. The COI (black font) and the BCL
(blue font) of each mutation and its predecessor mutation are shown next to the arrow connecting them. Underlined BCL values mark variant
pairs for which BCLs were estimated for groups of variants (see Materials and Methods) because of the episodic nature of variant accumulation
within groups resulting in lower BCLs (Progenitor SARS-CoV-2 and Its Dominant Offshoots in COVID-19 Pandemic . doi:10.1093/molbev/msab118 MBE
a lineages (fig. 2). According to the mutational history, the MRCA than that detectable by considering a smaller subset of
Wuhan-1 strain evolved by three successive a mutations (two sequences from China.
synonymous and one nonsynonymous) in proCoV2 (a1, a2, The mutational history from proCoV2 to Wuhan-1 ge-
and a3). This progression is statistically supported (BCL ¼ nome points to the presence of measurable coronavirus di-
100%), which is made possible by the presence of 896 inter- versity before the earliest recognized coronavirus outbreak in
mediate genomes containing one or two a variants in the December 2019 (fig. 1). The presence of such diversity has
29KG data set. Importantly, three closely related nonhuman been acknowledged and analyzed, for example, Pekar et al.
coronavirus genomes (bats and pangolin) all have the same (2021), but variants present in this diverse population were
base at these positions as does the proCoV2 genome, suggest- not identified. Our analyses clearly show that the ancestors of
ing that the ancestral genome did not contain a variants. the Wuhan-1 genome gave rise to a diversity of Wuhan-1’s
Furthermore, genomes with variants of proCoV2 do not sibling coronavirus lineages (a3a–a3j; figs. 1 and 3). These sib-
contain the other 47 variants, all of which occurred on the ling coronavirus lineages were detected in China in January
genomic background containing a1–a3. These facts support 2020 (a3b and a3f) and February 2020 in Asia (a3c–a3e) and
Downloaded from https://academic.oup.com/mbe/article/38/8/3046/6257226 by guest on 05 November 2021
the inference that coronaviruses lacking a variants were the Europe (a3a, a3g–a3j) (table 1). Thousands of genomes in the
ancestors of Wuhan-1 and other genomes sampled in 29KG data set belong to siblings and ancestors of Wuhan-1
December 2019 in China (fig. 1c). Therefore, we conclude (table 1 and fig. 3, yellow box). However, the paucity of
that Wuhan-1 was not the direct ancestor of all the early genomes sampled in 2019 makes it impossible to establish
coronavirus infections globally. the date and location of origin precisely, but some must have
A comparison of the proCoV2 genetic fingerprint (49 posi- originated before the first detection of the outbreak. Notably,
tions) in the 29KG collection revealed three matches in China the evolution of a3 was preceded by the evolution of a2 and
(Fujian, Guangdong, and Hangzhou) and three in the United a1 lineages, with a1 spawning multiple offshoots first detected
States (Washington) in January 2020 (fig. 1c). One more in Europe in February 2020 (a1a–a1d). The lineage, detected
match was found in New York in March 2020. The mutant in the United States in February 2020, is an even earlier de-
of proCoV2 was first sampled 59 days after the Wuhan-1 scendant of proCoV2 and is a sibling of the a lineage (table 1
strain. This means that the progenitor coronavirus spread and fig. 3). These lineages may not have been detected earlier
and mutated in the human population for months after because of the lack of sequencing in 2019, and it is likely that
the first reported COVID-19 cases. Furthermore, comparisons some originated early and spread around the world, whereas
of the protein sequences encoded by the proCoV2 genome others evolved from proCoV2 or its early descendant in dif-
revealed 131 other genomic matches, which contained only ferent parts of the world. Again, thousands of these corona-
synonymous differences from proCoV2. A majority (89 virus genomes were found throughout the world (fig. 3,
genomes) of these matches were from coronaviruses sampled yellow box). None of these genomes contained the widely
in China and other Asian countries (fig. 1d). The first sequence studied spike protein mutant (D614G), a b mutation that
was sampled 12 days after Wuhan-1. Multiple matches were occurred in the genomes carrying all three a variants and was
found in all sampled continents and detected as late as April first seen in late January 2020. Therefore, the proCoV2
2020 in Europe. These spatiotemporal patterns suggest that (MRCA) and a large diversity of its early descendants were
proCoV2 already possessed the repertoire of protein sequen- all able to spread in the global human population.
ces needed to infect, spread, and persist in the global human
population (see also MacLean et al. 2021).
Estimated Timing of MRCA and the Index Case
Because proCoV2 is three bases different from the Wuhan-1
Coronavirus Diversity before the First Coronavirus Outbreak genome, we estimate that the divergence of the earliest var-
The progenitor of all genomes sequenced from human coro- iants of proCoV2 occurred 5.8–8.1 weeks earlier, based on the
navirus infections (MRCA, proCoV2) is three bases different range of estimated mutation rates of coronavirus genomes
from the Wuhan-1 genome, which extends the ancestry before (see Materials and Methods). This timeline puts the presence
late November/early December 2020 date that has been sug- of proCoV2 in late October 2019, which is consistent with the
gested by Pekar et al. (2021). Their inference was based on report of a fragment of spike protein identical to Wuhan-1 in
analyzing SARS-CoV-2 genomes from the first 4 months of early December in Italy, among other evidence (Giovanetti et
coronavirus infections in China with a strict molecular clock al. 2020; Li, Wang, et al. 2020; van Dorp et al. 2020; Amendola
in which they placed coronavirus genomes from December et al. 2021). The sequenced segment of the spike protein is
2019 at the root of their phylogeny (Pekar et al. 2021). Their short (409 bases). It does not span positions in which 49
most likely root position is the same as the Wuhan-1 position major early variants were observed, which means that the
in our mutation history (figs. 1 and 3), which is not surprising Italian spike protein fragment can only confirm the existence
because their data set did not include more than 1,000 of proCoV2 before the first coronavirus detection in China.
genomes that comprise the early diverging lineage (fig. 3). Our timings of MRCA (tMRCA) is 1 month older than the
The genomes containing the lineage, sampled in North date for the MRCA of genomes presented by Pekar et al.
America, descended from an earlier ancestor that also gave (2021) because their analysis is restricted to the ancestry of
rise to the genome (a lineage) at the root of Pekar et al. the coronaviruses sampled from China only, which resulted in
(2021) phylogeny. Therefore, our analysis has revealed an earlier the exclusion of the lineage from their analysis. The
3051Kumar et al. . doi:10.1093/molbev/msab118 MBE
Bat CoV likely that the actual tIndex is much earlier than tMRCA be-
1 (32)
cause proCoV2 likely increased in frequency over time before
1- 3 2 (1,374) reaching a human host, and it is possible that one of its
(18)
immediate ancestor first infected a human. Based on an ap-
proCoV2 1 (849) proximately 1-month difference between MRCA and Index
1a - 1d (354)
dates in Pekar et al. (2021), it is tempting to speculate that
2 (47)
tIndex could have been as early as September 2019 for our
(1,115)
3
(501) SARS-CoV-2 phylogeny. This speculation requires more ex-
3a
3b (376)
tensive analysis and experimental confirmation in the future.
3c- 3e (489)
3f (121)
Analysis of the 68KG Database Snapshot
Wuhan-1
3g (334)
3h (580) Next, we analyzed a later snapshot of SARS-CoV-2 genome
Downloaded from https://academic.oup.com/mbe/article/38/8/3046/6257226 by guest on 05 November 2021
3i - 3j (488) collection acquired 3 months after the 29KG data set. This
1 (11) data set expanded the collection of coronavirus genomes
2
(36) from viral isolates collected after July 7, 2020 (16,739
3
(3,032) genomes) and added 20,004 genome sequences from viral
isolates dated before July 7, 2020. In the expanded MOA
3a (1,213)
analysis, we retained 49 variants found with frequency >1%
(527)
3b in the 29KG data set and added variants found with a fre-
3c (678)
quency >1% in the 68KG data set (84 total variants; see
3d (485)
supplementary table S1, Supplementary Material online).
3e - 3g (467)
MOA analysis of the 68KG data set produced the proCoV2
(884)
1 genome identical to that inferred using the 29KG data set (see
0.1% genomes (757)
1a Materials and Methods). We found one additional genome
0.1% - 1% genomes 1b (439) (EPI_ISL_493171) with a proCoV2 fingerprint sampled in
1% - 5% genomes 1
(5,157) Hubei, China, 4 weeks after the Wuhan-1 strain was reported.
1a
(389) The inferred mutation history from the 68KG data set was
> 5% genomes (790)
1b well-supported with high COIs and BCLs and concordant
1c - 1d (471) with the mutation history produced using the 29KG data
Synonymous mutaon 1 (2)
(2) set (fig. 4). Therefore, inferences reported above for the
frequency > 3% 2
frequency 3% 3
(5,365) 29KG data set were robust to the expanded sampling of
(608) genomes. In the expanded mutation history, two new groups
3a
Non-synonymous mutaon
3b (452)
of variants were identified (f and g). They originated in mid-
frequency > 3% (453) March 2020 and were found in a relatively high frequency in
3c
frequency 3%
3d - 3f (761) the 68KG data set (4.4% and 8.0%, respectively, supplemen-
tary table S1, Supplementary Material online). Variants in f
FIG. 3. A waterfall display of genome phylogeny recapitulating the
and g groups also showed episodic accumulation of muta-
mutation history in figure 2. The numbers of genomes mapped to
tions, for example, the count of genomes containing three f
each node are depicted by open circles (very few genomes), open
triangles (few genomes), small gray triangles (many genomes), and mutations (f1–f3; 2,955 genomes) was much larger than
large black triangles (very many genomes). The actual number of those with a subset of these variants (148 genomes). The
genomes is given in the parenthesis. The tip label is the name of episodic nature of mutational spread for 84 variants in the
the mutation on the connecting branch. Green and red branches 68KG is statistically significant (P < 108), that is, clusters of
are synonymous and nonsynonymous mutations, respectively. mutations together have become common variants (see
Thick branches mark mutations that occur with a frequency >3% Materials and Methods).
in the 29KG data set. The yellow background highlights the diversity
of coronavirus lineages that evolved from the genomes leading to
Wuhan-1 coronavirus. Coronavirus Fingerprints and Spatiotemporal
Tracking
The mutation history progression directly transforms into a
potential for not sampling such lineages is well appreciated in collection of genetic fingerprints. Each fingerprint represents a
Pekar et al. (2021). This exclusion and the use of sampling genome type containing all the variants on the path from
times in strict clock phylogenetic analyses would naturally that tip node up to the progenitor proCoV2. These finger-
lead to analyses leaning closer to the earliest sampling times prints can classify genomes and track spatiotemporal pat-
of SARS-CoV-2 (December 2019). Anyway, if we assume that terns of dominant lineages (see Materials and Methods).
proCoV2 was the index case, then the date of zoonosis We use a shorthand to refer to each fingerprint in which
(tIndex) would be late October to mid-November 2019. only the major variant type is used. For example, a fingerprint
This range overlaps with Pekar et al.’s (2021) index date falling refers to genomes that one or more of the a variants and no
between mid-October and mid-November 2019. However, it other major variants, and ab fingerprint refers to genomes
3052Progenitor SARS-CoV-2 and Its Dominant Offshoots in COVID-19 Pandemic . doi:10.1093/molbev/msab118 MBE
(a) (b)
proCoV2 proCoV2
1a- 1d 1a- 1d
1- 2 1- 3 1- 2 1- 3
3a- 3j 3a- 3j
Wuhan-1 Wuhan-1
1- 3 3a- 3e 1- 3 3a- 3e
3a- 3m
Downloaded from https://academic.oup.com/mbe/article/38/8/3046/6257226 by guest on 05 November 2021
1a- 1b 1 1- 3 3a- 3f 1a- 1b 1 1- 7 1- 3
1a- 1i
1a- 1d 1 1a- 1e 1 1- 6
6a
Asia South America
Africa Europe
North America
Oceania Middle East
FIG. 4. The backbone of SARS-CoV-2 mutational history. The mutational history inferred was from (a) 29KG and (b) 68KG data sets. Major variants
and their mutational pathways are shown in black, and minor variants and their mutational pathways are shown in gray. Circle color marks the
region where variants were sampled first. The 68KG data set contains 12 additional variants and more than two times the genomes than the 29KG
data set.
that contain at least one a, at least one b variant, and no More recently, novel fast-spreading variants have been
other major variants. This nomenclature is intuitive and pro- reported (e.g., Rambaut, Loman, et al. 2020). In particular,
vides a way to glean evolutionary information from the co- an S protein variant (N501Y) from South Africa and the
ronavirus lineage’s name. In the 68KG data set (October 12, United Kingdom has rapidly increased (Rambaut, Loman, et
2020 GISAID snapshot), global frequencies of major proCoV2 al. 2020). Coronaviruses with N501Y variant in South Africa
fingerprints were as follows: abe (32.1%), abcd (17.7%), ab carry the abcd genetic fingerprint, whereas those in the
(16.7%), abeg (9.9%), ab (9.8%), abc (6.8%), abf (4.5%), and United Kingdom carry the abe genetic fingerprint. This
(2.4%). means that the N501Y mutation arose independently in
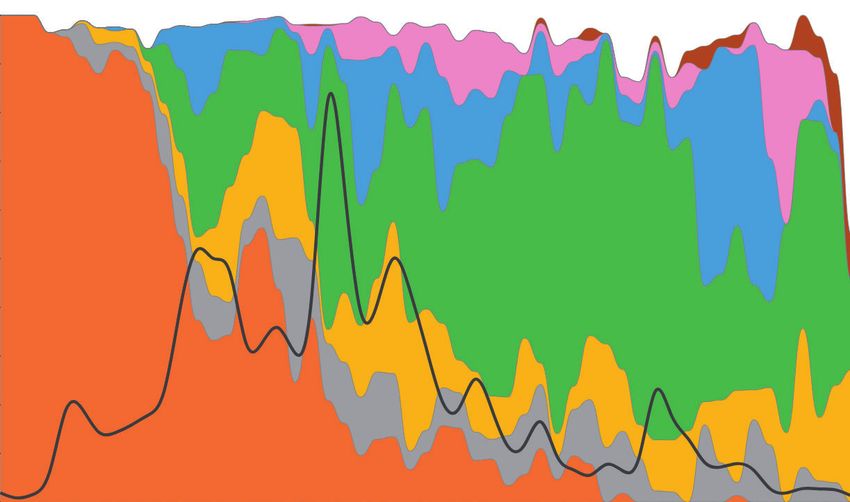
Figure 5 shows the evolving spatiotemporal of all major two coronavirus lineages that show convergent patterns of
fingerprints in Asia, Europe, and North America inferred for increased spread. At present, abf dominates the United
an expanded data set of 172,480 genomes (December 30, Kingdom, and the number of genomes publicly available
2020 snapshot). Spatiotemporal patterns in cities, countries, from South Africa is relatively small to make reliable infer-
and other regions are available online at http://sars2evo.data- ences (see http://sars2evo.datamonkey.org for future
monkey.org/. We observe the spread and replacement of updates). Overall, our mutational fingerprinting and nomen-
prevailing strains in Europe (abe with abf) and Asia (a clature provide a simple way to glean the ancestry of new
with abe), the preponderance of the same strain for most variants compared with phylogenetic designations, such as
of the pandemic in North America (abcd), and the continued B.1.351 and B.1.1.7 (Rambaut, Loman, et al. 2020).
presence of multiple high-frequency strains in Asia and North
America. Spatiotemporal patterns of strain spread converged
for Europe and Asia by July–August 2020 to abe genetic Conclusions
fingerprints. These patterns diverged from North America, Through innovative analyses of two large collections of SARS-
where ab along with its mutant (abcd) were common. CoV-2 genomes, we have consistently reconstructed the
After that, Europe saw f variants of ab grow (abf), replacing same progenitor coronavirus genome and identified its pres-
abe genomes and its new g offshoot (abeg) (e.g., Hodcroft et ence worldwide for many months after the pandemic began.
al. 2020). The f mutations were first detected 3 weeks after The progenitor genome is a better reference for rooting phy-
the sampling of the first e variants. Remarkably, abcd has logenies, orienting mutations, and estimating sequence diver-
remained the dominant lineage in North America since gences. The reconstructed mutational history of SARS-CoV-2
April 2020, in contrast to the turnover seen in Europe and revealed major mutational fingerprints to identify and track
Asia. the novel coronavirus’s spatiotemporal evolution, revealing
3053Kumar et al. . doi:10.1093/molbev/msab118 MBE
(a)
100%
Asia 800
Sample count
80%
Genomes (%)
600
60%
400
40%
20% 100
0%
2020 March May July September November
(b)
100% Europe
7,000
Sample count
80%
Genomes (%)
6,000
60% 5,000
Downloaded from https://academic.oup.com/mbe/article/38/8/3046/6257226 by guest on 05 November 2021
4,000
40% 3,000
20% 2,000
1,000
0%
2020 March May July September November
(c)
100%
North America 2,800
Sample count
80% 2,400
Genomes (%)
2,000
60%
1,600
40% 1,200
800
20%
400
0%
2020 March May July September November
FIG. 5. Spatiotemporal dynamics of 172,480 SARS-CoV-2 genomes (December 2019–2020). Spatiotemporal patterns of genomes mapped to
lineages containing different combinations of major variants in (a) Asia, (b) Europe, and (c) North America. The number of genomes mapped to
major variant lineages contains all of its offshoots, for example, a lineage contains all the genomes with a1–a3, a1a–a1d, and a3a–a3j variants only.
The stacked graph area is the proportion of genomes mapped to the corresponding lineage. The solid black line shows the count of total genome
samples. Spatiotemporal patterns in cities, countries, and other regions are available online at http://sars2evo.datamonkey.org/ (last accessed on
March 28, 2021).
convergences and divergences of dominant strains among Supplementary Material online. In the first step, we download
geographical regions from an analysis of more than 172 thou- 60,332 SARS-CoV-2 genomes from the GISAID database (Shu
sand genomes. and Mccauley 2017), along with information on sample col-
Furthermore, the approach taken here to reconstruct the lection dates and locations (until July 7, 2020). Of all the
progenitor genome and discover key mutational events will genomes downloaded, we only retained those with
generally be applicable for analyzing other pathogens during >28,000 bases and were marked as originating from human
the early stages of outbreaks. The approach is scalable for hosts and passing controls detailed below. Similarly, the sec-
even bigger data sets because it does not require more phy- ond data set, the 68KG data set, was assembled from 133,741
logenetically informative variants with an increasing number genomes and downloaded on October 12, 2020. Again, we
of samples. In fact, it benefits from bigger data sets as they retained only those with >28,000 bases and marked as orig-
afford more accurate estimates of individual and co- inating from human hosts.
occurrence frequencies of variants and enable more reliable Each genome was subjected to codon aware alignment
detection of lower frequency variants. Its continued applica- with the NCBI reference genome (accession number
tion to SARS-CoV-2 genomes and other pathogen outbreaks NC_045512) and then subdivided into ten regions based on
will produce their ancestral genomes and their spatiotempo- the following coding sequence (CDS) features: ORF1a (includ-
ral dynamics, improving our understanding of the past, cur- ing nsp10), ORF1b (starting with nsp12), S, ORF3a, E, M,
rent, and future evolution of pathogens and associated ORF6, ORF7a, ORF8, N, and ORF10. Gene ORF7b was re-
diseases. moved because it was too short for alignment and compar-
isons. For each region, we scanned and discarded sequences
containing too many ambiguous nucleotides to remove data
Materials and Methods with too many sequencing errors. Thresholds were 0.5% for
Genome Data Acquisition and Processing the S gene, 0.1% for ORF1a and ORF1b genes, and 1% for all
A flowchart describing the protocol for data assembly and other genes. We mapped individual sequences to the NCBI
processing is shown in supplementary figure S1, reference genome (NC_045512) using a codon-aware
3054Progenitor SARS-CoV-2 and Its Dominant Offshoots in COVID-19 Pandemic . doi:10.1093/molbev/msab118 MBE
extension to the Smith–Waterman algorithm implemented Jahn et al. 2016). We used the highest frequency variants to
in HyPhy (Pond et al. 2005; Gianella et al. 2011) (https:// anchor the analysis and the shared co-occurrence of variants
github.com/veg/hyphy-analyses/tree/master/codon-msa), among genomes to order mutations while allowing probabil-
translated mapped sequence to amino acids, and performed istically for sequencing errors and pooled sequencing of
multiple protein sequence alignment with the auto settings genomes (Jahn et al. 2016). MOA is different from traditional
function of MAFFT (version 7.453; Katoh and Standley 2013). phylogenetic approaches where positions are treated inde-
Codon sequences were next mapped onto the amino acid pendently, that is, the shared co-occurrence of variants is not
alignment. The multiple sequence alignment of SARS-CoV-2 directly utilized in the inference procedure. Notably, both
genomes was aligned with the sequence of three closest out- traditional phylogenetic and mutation order analyses are
groups, including the coronavirus genomes of the expected to produce concordant patterns when sequencing
Rhinolophus affinis bat (RaTG13), R. malayanus bat errors and other artifacts are minimized. However, sequenc-
(RmYN02), and Manis javanica pangolin (MT121216.1) (Liu ing errors and limited mutational input during the coronavi-
et al. 2020; Zhou et al. 2020). The alignment was visually rus history adversely impact traditional methods, as does the
Downloaded from https://academic.oup.com/mbe/article/38/8/3046/6257226 by guest on 05 November 2021
inspected and adjusted in Geneious Prime 2020.2.2 (https:// fact that the closest coronaviruses useable as outgroups have
www.geneious.com). The final alignment contained all geno- more than a thousand base differences from SARS-CoV-2
mic regions except ORF7b and noncoding regions (50 and 30 genomes that only differ in a handful of bases from each
UTRs, and intergenic spacers). After these filtering and align- other (Mavian et al. 2020; Morel et al. 2021; Pipes et al. 2021).
ment steps, the multiple sequence alignment contained MOA requires a binary matrix of presence/absence (1/0) of
29,115 sites and 29,681 SARS-CoV-2 genomes for the July 7, mutants, which is straightforward in analyzing cell sequences
2020 snapshot, which we refer to as the 29KG data set. For the from tumors because they arise from normal cells that supply
October 12 snapshot, there were 68,057 sequences, which we definitive ancestral states. To designate mutation orientations
refer to as the 68KG data set. We also conducted a spatio- for applying MOA in SARS-CoV-2 analysis, we devised a sim-
temporal analysis on an expanded data set containing ple approach in which we began by comparing nucleotides at
172,480 genomes (172KG) acquired on December 30, 2020. the 49 genomic positions among three closely related
genomes (bat RaTG13, bat RmYN02, and pangolin
Reference Genomes and Collection Dates MT121216.1) (Boni et al. 2020). We chose the consensus
We used the dates of viral collections provided by the GISAID base to be the initial reference base, such that SARS-CoV-2
database (Shu and Mccauley 2017) in all our analyses if they genome bases were coded to be “0” whenever they were the
were resolved to the day (i.e., we discarded data that only same as the consensus base at their respective positions. All
contained partial dates, for example, April 2020). All genomes other bases were assigned a “1.” There were 39 positions in
were used in the mutation ordering analyses, but genomes which all 3 outgroup genomes were identical to each other
with incomplete sampling dates were excluded from the spa- and 9 in which 2 of the outgroups showed the same base. In
tiotemporal analyses and derived interpretations. We noted the remaining position (28657), all three outgroups differed,
that the earliest sample included in GISAID (ID: so we selected the base found in the gene with the highest
EPI_ISL_402123) was collected on December 24, 2019, al- sequence similar to the human SARS-CoV-2 NCBI reference
though the NCBI website lists its collection date as genome (NC_045512) because SARS-CoV-2’s ancestor likely
December 23, 2019 (GenBank ID: MT019529). Therefore, experienced genomic recombination before its zoonotic
we used the GISAID collection date for the sake of consis- transfer into humans (Huang et al. 2020; Li, Giorg, et al.
tency. Regarding the NCBI reference genome (GenBank ID: 2020; MacLean et al. 2021). At one position, both major
NC_045512; GISAID ID: EPI_ISL_402125) (Wu et al. 2020), this and minor bases in humans were different from the consen-
sample was collected on December 26, 2019 (Chiara et al. sus base in the outgroups, so we assigned the mutant status
2021). We also used the GISAID reference genome in our to the minority base (U; vf ¼ 29.8%). All missing and ambig-
analysis (ID: EPI_ISL_402124) collected on December 30, uous bases were coded to be ignored (missing data) in all the
2019 (Okada et al. 2020). analyses. These initially assigned mutation orientations were
tested in a subsequent investigation of variants’ COI. COI for a
Mutation Order Analyses given variant (y) is the number of genomes that contain y and
First, we analyzed the 29KG data set. We used a maximum its directly preceding mutation (x) in the mutation history,
likelihood method, SCITE (Jahn et al. 2016), and variant co- divided by the number of genomes that contain y. When COI
occurrence information for reconstructing the order of muta- was lower than 70%, we reversed each position’s mutation
tions corresponding to 49 common variants (frequency > orientation individually and selected the mutation orienta-
1%) observed in this data set (see flowchart in supplementary tion that produced mutation histories with the highest COI
fig. S2, Supplementary Material online). MOA has demon- (see below).
strated high accuracy for analyzing tumor cell genomes In the SCITE analysis of 49 variants and 29,861 genomes,
that reproduce clonally, have frequent sequencing errors, we started with default parameter settings of false-negative
and exhibit limited sequence divergence (Jahn et al. 2016; rate (FNR ¼ 0.21545) and false-positive rate (FPR ¼
Miura et al. 2018). In MOA, higher frequency variants are 0.0000604) of mutation detection. We carried out five inde-
expected to have arisen earlier than low-frequency variants pendent runs to ensure stability and convergence to obtain
in clonally reproducing populations (Kim and Simon 2014; 29KG collection-specific estimates of FNR and FPR by
3055Kumar et al. . doi:10.1093/molbev/msab118 MBE
comparing the observed and predicted sequences based on estimate that proCoV2 existed 5.8–8.1 weeks before
this mutation graph. The estimated FNR (0.00488) and FPR December 24, 2019 sampling date of Wuhan-1, by using an
(0.00800) were very different from the SCITE default param- SARS-CoV-2 HPD (Highest Posterior Density) mutation rate
eters, where the estimated FNR was much lower. This differ- range of 6.64 104–9.27 104 substitutions per site per
ence in error rates is unsurprising because we used only year (Pekar et al. 2021).
common variants (vf > 1%), and the 29KG data set was We have made available the proCoV2 genome sequence in
not obtained from single-cell sequencing in which dropout FastA format at http://igem.temple.edu/COVID-19, which is
during single-cell tumor sequencing elevates FNR, that is, mu- the same as the NCBI reference genome with base differences
tant alleles are not sequenced. corresponding to a1–a3 mutations at positions 18060, 8782,
As noted above, the initial mutation orientations were and 28144, as discussed in the main text. In this mutation
simply the starting designations for our analysis, which are graph, COI for each variant is shown next to the arrow.
subsequently investigated by evaluating the COI of each var-
iant in the reconstructed mutation history. In this process, we Bootstrap Analysis
Downloaded from https://academic.oup.com/mbe/article/38/8/3046/6257226 by guest on 05 November 2021
reverse ancestor/mutant coding for variants that received low We assessed the robustness of the mutation history inference
COI to examine if a mutation history with higher COI can be to genome sampling by bootstrap analysis. We generated 100
generated. Two positions (3037 and 28854) received low COI bootstrap replicate data sets, each built by randomly selecting
(Progenitor SARS-CoV-2 and Its Dominant Offshoots in COVID-19 Pandemic . doi:10.1093/molbev/msab118 MBE
2020) obtained using the Pangolin service (v2.0.3; https://pan- sars2evo.datamonkey.org, last accessed on March 18, 2021).
golin.cog-uk.io/). We assigned each of the 29 K genomes to a The classification is conducted on the client-side such that
fingerprint based on the highest sequence similarity at posi- the researcher’s data never leave their personal computer.
tions containing 49 common variants, allowing mismatches
due to population-level variations and sequencing errors. A Testing Episodic Spread of Variants
small fraction of genomes (1.8%) could not be assigned un- We performed nonparametric Wald–Wolfowitz run tests
ambiguously to one fingerprint, so they were excluded and (Wald and Wolfowitz 1940; Mateus and Caeiro 2015) of the
will be investigated in the future. The number of genomes null hypothesis that the first sampling of variants is randomly
assigned to each fingerprint is shown in table 1. We submitted distributed over time (i.e., evenly spaced). The null hypothesis
genome sequences to the Pangolin website for classification was rejected for both 29KG and 64KG analyses at P 0.01,
one-by-one, and a clade designation was received. The results suggesting significant temporal clustering in both 29KG and
are summarized in supplementary figure S3, Supplementary 64KG data sets. Because many mutations were first sampled
Material online. In this table, all phylogenetic groups with on December 24, 2019, we only included one mutation for
Downloaded from https://academic.oup.com/mbe/article/38/8/3046/6257226 by guest on 05 November 2021
fewer than 20 genomes were excluded. that day to avoid biasing the test.
Of the 80 phylogenetic groups shown, 74 are defined pri- We also tested the null hypothesis of the same molecular
marily by a single mutation-based fingerprint, as more than evolutionary patterns within the SARS-CoV-2 population and
90% of the genomes in those phylogenetic groups share the between species (i.e., Human SARS-CoV-2 and Bat RaTG13)
same fingerprint. This includes all small- and medium-sized by using a McDonald-Kreitman test (McDonald and
phylogenetic groups (up to 488 genomes) and two large Kreitman 1991). The numbers of nonsynonymous and syn-
groups (A.1 with 1,377 genomes and B.1.2 with 749 genomes). onymous polymorphisms with a frequency >1% were 32 and
One large group, B.1.1, predominately connects with e3 node 17, compared with the numbers of nonsynonymous and syn-
(79%, 4,832 genomes), but some of its members belong to e3 onymous fixed differences (170 and 958, respectively) be-
offshoots because they contain respective diagnostic muta- tween proCoV2 and bat RaTG13 sequences. The
tions. For group B.1.1.1, two other e3 offshoots are mixed up McDonald–Kreitman test rejected the null overwhelmingly
almost equally. Three other large differences between muta- (P 0.01).
tional fingerprint-based classification and phylogeny-based
grouping are seen for A, B, B1.1, and B.2 groups. These differ-
Supplementary Material
ences are likely because the location of the root and the
earliest branching order of coronavirus lineages are problem- Supplementary data are available at Molecular Biology and
atic in phylogeny-based classifications (Mavian et al. 2020; Evolution online.
Morel et al. 2021; Pipes et al. 2021; Wenzel 2020). Overall,
our mutational fingerprints are immediately informative Acknowledgments
about the mutational ancestry of genomes. We thank all the authors and organizations who have kindly
deposited and shared genome data on GISAID (see http://
Analysis of 68KG Data Set igem.temple.edu/COVID-19 for a list of all the authors). We
We repeated the above MOA procedure on the 68KG data thank Ananias Escalante, Rob Kulathinal, Li Liu, Jose Barba-
set (68,057 genomes). This 68KG data contained 72 common Montoya, Antonia Chroni, Ravi Patel, and Caryn Babaian for
variants (>1% frequency). For direct comparison purposes, their critical comments. We appreciate the technical support
we added 12 variants that were common variants on 29KG provided by Jared Knoblauch and Glen Stecher. This research
data, but their frequency had become less than 1% in the was supported by grants from the U.S. National Science
68KG data. Therefore, we used 84 variants in total and con- Foundation to S.K. (GCR-1934848, DEB-2034228) and S.P.
structed a 84 68,057 (SNVs genomes) matrix for the (DBI-2027196) and from the U.S. National Institutes of
SCITE analysis to determine the mutational order. We also Health to S.K. (GM-139504-01) and S.P. (AI-134384).
conducted the bootstrap analysis and assigned mutational
fingerprints using the procedure mentioned above. The num- Data Availability
ber of genomes mapped to each fingerprint is listed in sup-
plementary table S1, Supplementary Material online. Live evolutionary history and spatiotemporal distributions of
common variants can be accessed via http://sars2evo.data-
Sequence Classification for 172KG Data Set monkey.org/. All genome sequences and metadata are avail-
We developed a sequence classification protocol that first able publicly at GISAID (https://www.gisaid.org/), and the
calls variants in a viral genome using proCoV2 as the reference predicted proCoV2 sequence is available at http://igem.tem-
sequence using a browser-based sequence alignment (bioseq ple.edu/COVID-19. The other relevant information is pro-
npm package) based on the codebase of minimap2 (Li 2018). vided in the supplementary materials, Supplementary
Then, it assigns the sequence to a path in the mutation graph Material online.
with the highest concordance (Jaccard index). It is imple-
mented in a simple browser-based tool, which shows the References
example output for ENA accession number MT675945 (sup- Amendola A, Bianchi S, Gori M, Colzani D, Canuti M, Borghi E, Raviglione
plementary fig. S4, Supplementary Material online; http:// MC, Zuccotti GV, Tanzi E. 2021. Evidence of SARS-CoV-2 RNA in an
3057Kumar et al. . doi:10.1093/molbev/msab118 MBE
Oropharyngeal Swab Specimen, Milan, Italy, early December 2019. al. 2021. Genomic epidemiology of the early stages of the SARS-CoV-
Emerg Infect Dis. 27(2):648–650. 2 outbreak in Russia. Nat Commun. 12(1):1–13.
Andersen KG, Rambaut A, Lipkin WI, Holmes EC, Garry RF. 2020. The Lai A, Bergna A, Acciarri C, Galli M, Zehender G. 2020. Early phylogenetic
proximal origin of SARS-CoV-2. Nat Med. 26(4):450–452. estimate of the effective reproduction number of SARS-CoV-2. J Med
Boni MF, Lemey P, Jiang X, Lam TTY, Perry BW, Castoe TA, Rambaut A, Virol. 92(6):675–679.
Robertson DL. 2020. Evolutionary origins of the SARS-CoV-2 sarbe- Lemey P, Hong SL, Hill V, Baele G, Poletto C, Colizza V, O’Toole A ,
covirus lineage responsible for the COVID-19 pandemic. Nat McCrone JT, Andersen KG, Worobey M, et al. 2020.
Microbiol. 5(11):1408–1417. Accommodating individual travel history and unsampled diversity
Casals F, Bertranpetit J. 2012. Human genetic variation, shared and pri- in Bayesian phylogeographic inference of SARS-CoV-2. Nat
vate. Science 337(6090):39–40. Commun. 11(1):1–14.
Castells M, Lopez-Tort F, Colina R, Cristina J. 2020. Evidence of increasing Lemieux JE, Siddle KJ, Shaw BM, Loreth C, Schaffner SF, Gladden-Young
diversification of emerging SARS-CoV-2 strains. J Med Virol. A, Adams G, Fink T, Tomkins-Tinch CH, Krasilnikova LA, et al. 2021.
92(10):2165–2172. Phylogenetic analysis of SARS-CoV-2 in Boston highlights the impact
Chiara M, Horner DS, Gissi C, Pesole G. 2021. Comparative genomics of superspreading events. Science 371(6529):eabe3261.
reveals early emergence and biased spatio-temporal distribution of Li H. 2018. Minimap2: pairwise alignment for nucleotide sequences.
Downloaded from https://academic.oup.com/mbe/article/38/8/3046/6257226 by guest on 05 November 2021
SARS-CoV-2. Mol Biol Evol. 38(6):2547–2565. Bioinformatics 34(18):3094–3100.
da Silva Filipe A, Shepherd JG, Williams T, Hughes J, Aranday-Cortes E, Li X, Giorg EE, Marichannegowda MH, Foley B, Xiao C, Kong XP, Chen Y,
Asamaphan P, Ashraf S, Balcazar C, Brunker K, Campbell A, et al. Gnanakaran S, Korber B, Gao F. 2020. Emergence of SARS-CoV-2
2021. Genomic epidemiology reveals multiple introductions of through recombination and strong purifying selection. Sci Adv. 6:1–12.
SARS-CoV-2 from mainland Europe into Scotland. Nat Microbiol. Li X, Wang W, Zhao X, Zai J, Zhao Q, Li Y, Chaillon A. 2020. Transmission
6(1):112–122. dynamics and evolutionary history of 2019-nCoV. J Med Virol.
Dearlove BL, Lewitus E, Bai H, Li Y, Reeves DB, Joyce MG, Scott P, Amare 92(5):501–511.
M, Vasan S, Michael NL, et al. 2020. A SARS-CoV-2 vaccine candidate Liu P, Jiang JZ, Wan XF, Hua Y, Li L, Zhou J, Wang X, Hou F, Chen J, Zou J,
would likely match all currently circulating strains. Proc Natl Acad Sci et al. 2020. Are pangolins the intermediate host of the 2019 novel
U S A. 117(38):23652–23662. coronavirus (SARS-CoV-2)? PLoS Pathog. 16(5):e1008421.
Fauver JR, Petrone ME, Hodcroft EB, Shioda K, Ehrlich HY, Watts AG, Lu R, Zhao X, Li J, Niu P, Yang B, Wu H, Wang W, Song H, Huang B, Zhu
Vogels CBF, Brito AF, Alpert T, Muyombwe A, et al. 2020. Coast-to- N, et al. 2020. Genomic characterisation and epidemiology of 2019
coast spread of SARS-CoV-2 during the early epidemic in the United novel coronavirus: implications for virus origins and receptor bind-
States. Cell 181(5):990–996.e5. ing. Lancet 395(10224):565–574.
Forster P, Forster L, Renfrew C, Forster M. 2020. Phylogenetic network MacLean OA, Lytras S, Weaver S, Singer JB, Boni MF, Lemey P,
analysis of SARS-CoV-2 genomes. Proc Natl Acad Sci U S A. Kosakovsky Pond SL, Robertson DL. 2021. Natural selection in the
117(17):9241–9243. evolution of SARS-CoV-2 in bats, not humans, created a highly ca-
Gianella S, Delport W, Pacold ME, Young JA, Choi JY, Little SJ, Richman pable human pathogen. PLoS Biol. 19(3):e3001115.
DD, Kosakovsky Pond SL, Smith DM. 2011. Detection of minority De Maio N, Walke C, Borges R, Weilguny L, Slodkowicz G, Goldman N.
resistance during early HIV-1 infection: natural variation and spuri- 2020. Issues with SARS-CoV-2 sequencing data. Available from:
ous detection rather than transmission and evolution of multiple https://virological.org/t/issues-with-sars-cov-2-sequencing-data/473
viral variants. J Virol. 85(16):8359–8367. (last access March 24, 2021).
Giorgio SD, Martignano F, Torcia MG, Mattiuz G, Conticello SG. 2020. Martin D, Weaver S, Tegally H, San J, Wilkinson E, Giandhari J, Pillay Y,
Evidence for host-dependent RNA editing in the transcriptome of Singh L, Lessells RJ, Oliveira TD, et al. 2021. The emergence and
SARS-CoV-2. Sci Adv. 6:1–9. ongoing convergent evolution of the N501Y lineages coincided
Giovanetti M, Benvenuto D, Angeletti S, Ciccozzi M. 2020. The first two with a major global shift in the SARS-CoV-2 selective landscape.
cases of 2019-nCoV in Italy: where they come from? J Med Virol. medRxiv. doi:10.1101/2021.02.23.21252268.
92(5):518–521. Mateus A, Caeiro F. 2015. An R implementation of several randomness
Gomez-Carballa A, Bello X, Pardo-Seco J, Martinon-Torres F, Salas A. tests. In: Simos ZK, Monovasilis T, editors. AIP Conf Proc.
2020. Mapping genome variation of SARS-CoV-2 worldwide high- 1618(1):531–534. doi: 10.1063/1.4897792.
lights the impact of COVID-19 super-spreaders. Genome Res. Mavian C, Pond SK, Marini S, Magalis BR, Vandamme AM, Dellicour S,
30(10):1434–1448. Scarpino SV, Houldcroft C, Villabona-Arenas J, Paisie TK, et al. 2020.
Hodcroft EB, Zuber M, Nadeau S, Comas I, Gonzalez Candelas F, Stadler Sampling bias and incorrect rooting make phylogenetic network
T, Neher RA. 2020. Emergence and spread of a SARS-CoV-2 variant tracing of SARS-COV-2 infections unreliable. Proc Natl Acad Sci U
through Europe in the summer of 2020. medRxiv. doi:10.1101/ S A. 117(23):12522–12523.
2020.10.25.20219063. McDonald JH, Kreitman M. 1991. Adaptive protein evolution at the Adh
Huang J-M, Jan SS, Wei X, Wan Y, Ouyang S. 2020. Evidence of the locus in Drosophila. Nature 351(6328):652–654.
recombinant origin and ongoing mutations in severe acute respira- Miura S, Huuki LA, Buturla T, Vu T, Gomez K, Kumar S. 2018.
tory syndrome coronavirus 2 (SARS-CoV-2). bioRxiv. doi:10.1101/ Computational enhancement of single-cell sequences for inferring
2020.03.16.993816. tumor evolution. Bioinformatics 34(17):i917–i926.
Jackson B, Rambaut A, Pybus OG, Robertson DL, Connor T, Loman NJ. Morel B, Barbera P, Czech L, Bettisworth B, Huebner L, Lutteropp S,
2020. Recombinant SARS-CoV-2 genomes involving lineage B.1.1.7 Serdari D, Kostaki E-G, Mamais I, Kozlov A, et al. 2021.
in the UK. Available from: https://virological.org/t/recombinant-sars- Phylogenetic analysis of SARS-CoV-2 data is difficult. Mol Biol Evol.
cov-2-genomes-involving-lineage-b-1-1-7-in-the-uk/658 (last access 38(5):1777–1791.
March 24, 2021). Nei M, Kumar S. 2002. Molecular evolution and phylogenetics. New
Jahn K, Kuipers J, Beerenwinkel N. 2016. Tree inference for single-cell York: Oxford University Press.
data. Genome Biol. 17:86. Okada P, Buathong R, Phuygun S, Thanadachakul T, Parnmen S,
Katoh K, Standley DM. 2013. MAFFT multiple sequence alignment soft- Wongboot W, Waicharoen S, Wacharapluesadee S, Uttayamakul
ware version 7: improvements in performance and usability. Mol Biol S, Vachiraphan A, et al. 2020. Early transmission patterns of corona-
Evol. 30(4):772–780. virus disease 2019 (COVID-19) in travellers from Wuhan to Thailand,
Kim KI, Simon R. 2014. Using single cell sequencing data to model the January 2020. Euro Surveill. 25:2000097.
evolutionary history of a tumor. BMC Bioinformatics 15:27. Pekar J, Worobey M, Moshiri N, Scheffler K, Wertheim JO. 2021. Timing
Komissarov AB, Safina KR, Garushyants SK, Fadeev AV, Sergeeva MV, the SARS-CoV-2 index case in Hubei province. Science
Ivanova AA, Danilenko DM, Lioznov D, Shneider OV, Shvyrev N, et 372(6540):412–417.
3058You can also read