Anticipatory Detection of Compulsive Body-focused Repetitive Behaviors with Wearables
←
→
Page content transcription
If your browser does not render page correctly, please read the page content below

Anticipatory Detection of Compulsive Body-focused Repetitive
 Behaviors with Wearables
 BENJAMIN LUCAS SEARLE, University of Cambridge, UK
 DIMITRIS SPATHIS, University of Cambridge, UK
 MARIOS CONSTANTINIDES, Nokia Bell Labs, UK
 DANIELE QUERCIA, Nokia Bell Labs, UK
 CECILIA MASCOLO, University of Cambridge, UK
arXiv:2106.10970v1 [cs.HC] 21 Jun 2021

 Body-focused repetitive behaviors (BFRBs), like face-touching or skin-picking, are hand-driven behaviors which can damage
 one’s appearance, if not identified early and treated. Technology for automatic detection is still under-explored, with few
 previous works being limited to wearables with single modalities (e.g., motion). Here, we propose a multi-sensory approach
 combining motion, orientation, and heart rate sensors to detect BFRBs. We conducted a feasibility study in which participants
 (N=10) were exposed to BFRBs-inducing tasks, and analyzed 380 mins of signals1 under an extensive evaluation of sensing
 modalities, cross-validation methods, and observation windows. Our models achieved an AUC > 0.90 in distinguishing BFRBs,
 which were more evident in observation windows 5 mins prior to the behavior as opposed to 1-min ones. In a follow-up
 qualitative survey, we found that not only the timing of detection matters but also models need to be context-aware, when
 designing just-in-time interventions to prevent BFRBs.
 CCS Concepts: • Human-centered computing → Ubiquitous and mobile computing; Ubiquitous and mobile computing
 design and evaluation methods.
 Additional Key Words and Phrases: Wearables, anticipatory detection, body-focused repetitive behaviors
 ACM Reference Format:
 Benjamin Lucas Searle, Dimitris Spathis, Marios Constantinides, Daniele Quercia, and Cecilia Mascolo. 2021. Anticipatory
 Detection of Compulsive Body-focused Repetitive Behaviors with Wearables. In Proceedings of the 23rd International Conference
 on Mobile Human-Computer Interaction (MobileHCI ’21), September 27-October 1, 2021, Toulouse & Virtual, France. ACM, New
 York, NY, USA, 20 pages. https://doi.org/10.1145/3447526.3472061

 1 INTRODUCTION
 The World Health Organization (WHO) defines mental health as our ability to function at a psychological
 level, characterized by autonomy, competence, independence, and actualization of emotional potential [47]. As
 WHO suggests, mental hygiene (the process of achieving mental health) could be compromised or put at risk,
 if certain symptoms or behaviors [25] are not diagnosed early and treated, both at an individual and collective
 level. For example, compulsive behaviors exhibit certain characteristics which may signal poor mental health. In
 literature, two terms that are interchangeably used to characterize these persistent behaviors are the Body-focused
 Compulsive Behaviors (BFCB) and the Body-focused Repetitive Behaviors (BFRB); for brevity, we use BFRB
 throughout the manuscript. These behaviors are repetitive in nature, primarily characterized by the use of hands,
 and exhibit distinctive behavioral signatures; face-touching, skin-picking, hair-pulling, to name a few, make
 up the BFRB list. These behaviors, if not identified early and corrected, may lead individuals to damage their
 1 Code and dataset are available: https://github.com/Bhorda/BFRBAnticipationDataset

 Pre-print, accepted to ACM Proceedings of the 23rd International Conference on Mobile Human-Computer Interaction (MobileHCI ’21).
 MobileHCI ’21, September 27-October 1, 2021, Toulouse & Virtual, France
 © 2021 Copyright held by the owner/author(s).
 ACM ISBN 978-1-4503-8328-8/21/09.
 https://doi.org/10.1145/3447526.3472061
MobileHCI ’21, September 27-October 1, 2021, Toulouse & Virtual, France Searle et al.

physical appearance or, in extreme cases, to cause non-reversible physical damage to themselves [4, 45]. But,
more worryingly, they have been linked to the development of severe mental health problems [8].
 Behavioral studies leverage our digital traces [13], or our daily interactions with technology such as the use of
smartphones or wearable devices [29, 39, 44]. For example, Cherian et al. [10] analyzed wrist-mounted accelerom-
eter data to identify tooth brushing. In this work, by exploiting sensing capabilities of modern smartphones
and wearables, we set out to understand behaviors related to our mental hygiene, not only a posteriori but also
in anticipation2 ; for example, in Competing Response Training[1], which is a prevalent treatment method, the
prediction of these behaviors is crucial for a successful therapy outcome. By using Machine Learning (ML), we
show how we can predict BFRBs early on from data preceding the behavior, so that successful interventions
could be developed to prevent them. In so doing, we made three contributions:
 • We conducted, for the first time, a semi-controlled free-living experiment to study BFRBs, grounded on
 previous stress literature and taking into account the social context (§4). Using consumer-grade wearables
 (i.e., Samsung Galaxy watches), we obtained 380 minutes of raw signals (i.e., accelerometer, gyroscope,
 and heart rate) from 10 users who underwent a series of BFRB-inducing tasks. We make our data set and
 pre-processing code publicly3 available to the community (§5) in an anonymized manner.
 • Using the collected data, we performed an in-depth analysis to investigate the feasibility of predicting
 compulsive behavior using a multisensory approach (§6). Consistently across all models, we found that
 the combination of all sensor modalities yielded the best performance (§7). In particular, we found that
 generic compulsive behavior (vs. normal) can be predicted with satisfactory discrimination of 0.89 AUC. In
 specific behaviors such as face touching and skin picking, our models achieved an AUC of 0.94. In addition,
 compulsive behaviors were more evident in an observation window of 5 minutes prior to the episode
 as opposed to 1-min window. The short observation windows allow for immediate interventions, while
 longer ones are more robust in terms of prediction accuracy due to leveraging the multi-sensory approach.
 Notably, the heart rate sensor was a stronger predictor in the longer window (taking into account that
 longer windows allow us to calculate richer heart rate variability metrics). On the other hand, the motion
 sensors dominated in 1-minute windows.
 • In the light of these findings, we discuss the broader theoretical and practical implications of our work,
 given the recent re-emergence of face-touching as a public health risk for infectious diseases. Our system
 paves the way to just-in-time interventions for real-time compulsive behavior monitoring (§8).

2 BACKGROUND AND RELATED WORK
2.1 Body-focused repetitive behaviors
The term body-focused repetitive behavior (BFRBs), coined by Bohne [5], refers to a set of impulsive behavioral
disorders affecting a wide demographic. In this work, we focus on a subset of these behaviors, namely nail-biting,
skin-picking, skin-biting, nail-picking, fidgeting, face-touching, and hair-pulling. This subset of behaviors is
strongly correlated with clinically recognized body-dysmorphic conditions [14], and exhibit certain characteristics
that can be uniquely identified from single source motion data.
 Previous research suggests that the most common BFRBs are nail-biting with a prevalence of 34-64%; skin-
picking with a prevalence of 25%; and hair pulling with a prevalence of 10.5% [5]. This research was conducted on
students from different cultures with comparable results on the prevalence of body dysmorphic disorder. These
values suggest a sizeable demographic, further supporting the relevance of the current study. Understanding
precise causes and triggers for these behaviors are essential for effective invocation in experiments. Relevant
literature also suggests that real-time triggers are correlated to change in environment and, more importantly,
2 Throughout the paper, we use the terms “prediction” and “anticipatory detection” interchangeably.
3 https://github.com/Bhorda/BFRBAnticipationDataset
Anticipatory Detection of Compulsive BFRBs with Wearables MobileHCI ’21, September 27-October 1, 2021, Toulouse & Virtual, France

stress [5]. Studies concluded, that the behaviors play an emotional regulation role, supported by findings showing
these behaviors are triggered by and relieve impatience, boredom, and frustration [30, 32, 46]. In an extended
study, clinical approaches to handling emotion regulation are suggested as a method of treatment for BFRBs [31],
with one study showing the pervasive treatment of depression to result in a decrease of body dysmorphic
behavior [8]. This correlation between stress and BFRBs inspired the multisensory approach of our study: to
combine stress monitoring through the proxy of heart-rate data, as well as motion data for a more accurate
preemptive signal for BFRB occurrences.
 Current literature suggests treatment of these conditions includes competing response training (CRT) [1],
habit-reversal, and cognitive therapy [20, 45]. An example of CRT for nail biting or other habits involving the
hands, pertains to holding the hands down at the side and making a fist or grasping objects [24]. CRT consists of
two sequential phases: the first concerns the identification of behavioral occurrences, while the second relies
on countering the behavior with a competing response in which the behavior cannot be carried out. Our work
helps in the first stage of CRT, by assisting the user in the recognition of when compulsive behaviors may occur,
incorporating methods from the area of human activity recognition (HAR).

2.2 Human Activity Recognition for compulsive behaviors
Most HAR approaches follow a common ML pipeline Lara [18]: data gathering, data processing, feature extraction,
and model training. The most common data sources are motion data, environmental data, physiological data, and
location data [7, 19]. We consider our task a specific case of gesture recognition [9]. Wrist-worn devices have
been shown to help accurate inference of multiple conditions and states using ML methods [3, 17, 26, 29, 43].
Previous attempts have been made to detect BFRBs with wearables, however, there is no existing research on
the prediction of these behaviors. Azaria [2] developed Thumbs-Up, a wrist-worn device, which is used to infer
hand-to-mouth behavior with a 92% accuracy. Lu [22] produced a device for habit detection using a wrist-worn
device and machine learning algorithms. Several commercial wearables have also been devised to combat these
conditions including the Tingle [38], Keen4 , and Pavlok5 devices. However, among this list, only the Tingle device
has published peer-reviewed documentation of their results and proven applicability to BFRB monitoring. This
device uses the same sensors (such as in our method) in addition to thermal sensors to detect proximity and
position using a long short-term memory (LSTM) neural network. However, all the above devices provide in-time
notifications to the wearer when a BFRB-esque motion is detected, in contrast to our approach focusing on the
prediction.

3 RESEARCH GOALS
As stated in the previous section, most prior work in BFRB monitoring relied on subjects seeking medical
professional advice, as well as systematic surveys. Additionally, due to their repetitive nature, these behaviors
may differ in free-living conditions as opposed to controlled laboratory settings. Therefore, we set out to
understand whether these behaviours could be predicted using wearable-sensing data and, if so, how much in advance
this could be achieved. To address that, we subsequently formulated three research questions as follows:
RQ1 : Which features among gyroscope, accelerometer, and heart rate are good predictors of BFRBs?
RQ2 : What window sizes prior to BFRBs occurrences allow for reliable anticipation?
RQ3 : To what extent does a multisensory approach (motion and heart rate) improves BFRB prediction?
 We study them in two phases. In phase I, we conducted a semi-controlled free-living experiment in which
10 subjects underwent a series of BFRB-inducing tasks, while we collected motion and heart rate data from a

4 https://habitaware.com/
5 https://pavlok.com
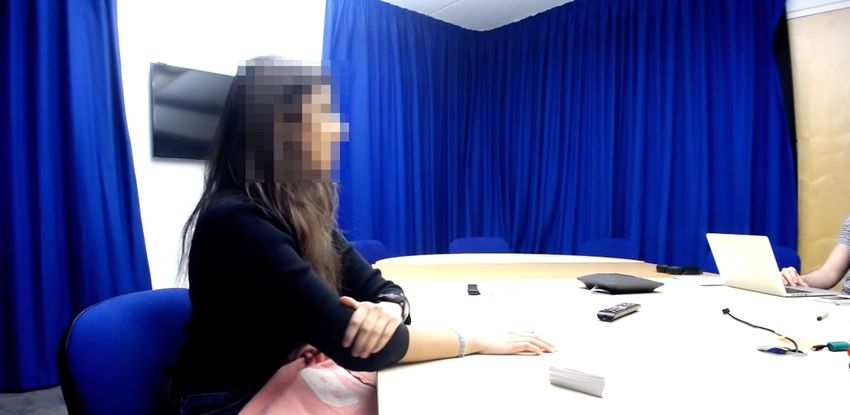
MobileHCI ’21, September 27-October 1, 2021, Toulouse & Virtual, France Searle et al.

 Briefing Task 1 Task 2 Debriefing

 3’ 5’ 10’ 5’ 5’ 5’ 2’ 5’

 Baseline I Baseline II Baseline III Behavior emulation

 (a)

 The participant as Participant position:
 captured by the camera smartwatch, pen and paper

 Camera/microphone for Investigator position:
 ground truth labeling laptop to take notes

 (b)

Fig. 1. User study setup. Experiment timeline (a): Baseline resting periods (sitting idle) and tasks (Task 1: presentation and
Task 2: arithmetic test) that induced stress and, eventually, triggered compulsive behaviors. Experimental setup (b): Subjects
wore a smartwatch throughout the trial and completed stress-inducing tasks.

wearable device. In phase II, we extensively modeled the collected data using cross-validation methods, observation
windows, and machine learning classifiers.

4 USER STUDY
In phase I, we conducted a semi-controlled free-living experiment to collect BFRB behavioral traces that we
used in phase II to model these behaviors. Here, we describe the experimental procedure and, subsequently (§5),
present the collected data which we made publicly available in an anonymized manner6 .

4.1 Participants
We recruited 10 participants (4 female, 6 male), aged between 18 and 40 (M = 23.6, SD = 5.4), equally split between
undergraduate students and early-career researchers, and with no prior history of any cardiovascular disease.
Additionally, all participants were instructed not to consume coffee on the day of the experiment. The study was
6 https://github.com/Bhorda/BFRBAnticipationDataset
Anticipatory Detection of Compulsive BFRBs with Wearables MobileHCI ’21, September 27-October 1, 2021, Toulouse & Virtual, France

 Heart-rate Monitor
 100
 Heart-rate (bpm)

 90

 80

 70 HR

 Accelerometer
 Acceleration (m/s^2)

 25

 0

 25
 accX accY accZ
 50

 Gyroscope
 Angular velocity (°/s)

 1000

 0

 1000 gyrX gyrY gyrZ

 5 10 15 20 25 30 35
 Time
 (min)

 Baseline I Task 1 Task 1 Baseline II Task 2 Baseline III Behaviour
 preparation presentation emulation

Fig. 2. Example of raw signals along with labels and experiment stages. The orange-yellow highlights mark observed
compulsive behaviors. The alternating white and light-gray segments mark the stages of the experiment. Data from Participant
#3.

approved from the Ethics Committee of University of Cambridge. During the recruitment process, we informed
them in writing that the experiment aimed at studying participants’ behavior in a series of tasks. Note that,
BFRBs were not mentioned to participants until after the experiment, during the last stage of debriefing and
behavior emulation. This deliberate decision allowed us to eliminate any potential biases introduced before and
during the experiment.

4.2 Materials and Apparatus
To carry out the experiment, we used the following apparatus and materials (Figure 1 a): sheet of paper for task 1,
pen, ~9 sheets of paper for task 2, a room with few distractions (ideally large empty space), a device for recording
audio and video, and a Samsung Galaxy smartwatch application that we developed for collecting accelerometer,
gyroscope, and heart-rate data. We acknowledge that other sensors that measure different body characteristics
such as galvanic skin response–electrodermal activity (GSR/EDA), skin temperature, or breathing rate could
complement our study [41]. However, we opted for HR/HRV and motion for two reasons: (i) skin sensors are
linked to physiological arousal contrary to HRV which is deemed a better proxy to the autonomic nervous system
MobileHCI ’21, September 27-October 1, 2021, Toulouse & Virtual, France Searle et al.

 Modalities Definition
 Motion
 accX The X-axis of the accelerometer data (horizontal movement)
 accY The Y-axis of the accelerometer data (vertical movement)
 accZ The Z-axis of the accelerometer data (depth movement)
 gyrX The X-axis of the gyroscope data (roll angle)
 gyrY The Y-axis of the gyroscope data (yaw angle)
 gyrZ The Z-axis of the gyroscope data (pitch angle)
 Heart
 HR The instantaneous heart rate in BPM
 RMSSD Proxy for heart rate variability defined as the root mean square of successive differences of interbeat intervals

Table 1. Feature categories included in the data set. Each category consists of 4 features, namely mean (mean), standard
deviation (std), minimum (min), and maximum (max). In later figures, features are denoted as ‘sensor + feature name’ such
as ‘accXstd’-referring to the standard deviation of the accelerometer data in the X axis.

(and in turn to stress) [36], and, (ii) commercial consumer-grade wearables offer greater support for HR/HRV
over GSR/EDA (e.g., most smartwatches have a PPG sensor compared to the expensive Empatica E4 for GSR).
 To induce BFRBs, we used the Trier Social Stress test [15] for invoking moderate social stress, founded on
the correlations between BFRBs and stress [5]. While there are numerous protocols aiming at eliciting stress in
studies involving human subjects [36], we opted for a well-studied and frequently employed stress elicitation
protocol, that is, the Trier Social Stress test. The protocol suggests a 10-minute anticipation period, followed by a
10-minute presentation period and, finally, by a 5-minute arithmetic task. To obtain participants’ behavior traces,
we used an application for Samsung watches [27]. The application continuously records motion and physiological
readings through the device’s sensors at 10Hz sampling rate.

4.3 Study Protocol and Procedure
Modifications were made to the original Trier’s test protocol to accommodate the opportunity to perform
compulsive behaviors in the form of additional baseline periods of inactivity before and after the tasks, where
participants were asked to remain silent and otherwise inactive. Consequently, one of these periods separated
the two tasks instead of having a single test interval. The arithmetic task (i.e., Task 2) was also modified to avoid
speaking, to combat possible confounding with heart rate increase due to, for example, vocal tension. We posit
that real-world stress induced by the presentation and arithmetic tasks could generalize to other social situations
and we consider them as a suitable set up for out study.
 The experiment included two tasks which induced BFRBs and three resting periods in between. These tasks
were selected due to their potency to induce social stress and, thus BFRBs. Other tasks with similar properties
could necessarily be used in future work. There was a briefing at the beginning of the experiment, and a debriefing
followed by behavior emulation at the end of the experiment (Figure 1b). The experiment lasted around 35 minutes
and audiovisual recording was used throughout the experiment. This allowed us to obtain ground truth data for
modeling purposes (§6).
 At the beginning of the study, participants were instructed to wear the watch on their non-dominant hand, as
it is the most common position and would not introduce motion artefacts during the writing task. There was no
further instruction in what to do with their non-dominant hand. After equipping the apparatus, the experiment
started with a 5-minute baseline period, followed by the first task. The first task was to prepare and present
a 5-minute presentation of the participant’s curriculum vitae (resume) with pen and paper provided for notes.
Anticipatory Detection of Compulsive BFRBs with Wearables MobileHCI ’21, September 27-October 1, 2021, Toulouse & Virtual, France

 Labeled behaviors

 Segmentation X Y

 Feature extraction
 Feature vector

 Normalization
 Normalized feature
 vector

Fig. 3. Data Preparation Pipeline. Stages of data formatting to prepare the data sets for model training. Data was labeled
according to the recorded footage of the experiments. Data was normalized to the first Baseline period as described in §4. In
the segmentation phase, the y windows mark the labeled behaviors, before which the x windows are generated depending
on the window size. For the feature extraction, only the x window is taken into account.

After the preparation period (stage 2. in Figure 1b), the notes and pen were confiscated and the participant was
asked to give the presentation (stage 3. in Figure 1b). If the participant had run out of material they were asked
to continue talking until the time limit was up. The task aimed to invoke anticipatory stress in the first phase
and performance stress in the second phase. This was followed by another baseline period of 5-minutes, after
which the second task was concluded. The second task involved an arithmetic task and required participants
to write down as many powers of 3 as possible starting from 30 up to 315 . Every 30 seconds, the participant
was asked to discard their work and restart on a new piece of paper. This task attempted to invoke frustrative
stress. There was a final baseline period following this, after which the participant was debriefed and asked to
emulate any compulsive behavior they were aware of exhibiting in their day-to-day life. This simulated data
was not utilized later in the study and only served as initial exploration of the data. Timestamps describing the
experiment structure were recorded by the investigator throughout the study, and used as a reference during the
data preparation phase (§5). An example timeline of the data collected can be seen in Figure 2.

5 DATA SET
5.1 Data processing pipeline
Having obtained a data set of a total of 380 minutes of raw motion and heart rate signals, we developed a 5-stage
pipeline to process it. The data processing pipeline is comprised of: data labeling, data segmentation, feature
extraction, and data normalization (Figure 3), which we describe next. The entire pipeline is modular with flags for
normalization technique, unique or aggregate analysis of participants, specific or aggregate analysis of different
compulsive behaviors, and custom segment sizes. All data manipulation was performed using the Pandas and
NumPy libraries for Python.
MobileHCI ’21, September 27-October 1, 2021, Toulouse & Virtual, France Searle et al.

Labeling. To derive the ground truth labels, we made use of the audiovisual recordings. We labeled the time
delta from the start of the recording when a compulsive behavior was observed. Additionally, we marked which
hand was involved in the compulsive behaviors to allow for different combinations for analysis of motion data.
Segmentation. This set of procedures ensured that the output is in the correct format for machine learning.
The first segments of the data are cut into fixed-length chunks of time series from each sensor (referred to as
windows). Each window has two components, namely ‘x’, the series of data points before the start of the observed
compulsive behavior (referred to as x-windows), and ‘y’, the series of data points starting from the time of
behavior observations (referred to as y-windows). The input for the module is the desired length of the x-window
and the y-window (Figure 3). We note that this process differs from a canonical rolling window approach because
our label of interest is not distributed uniformly in the data. Instead, we first isolate the compulsive behavior ‘y’,
and then use a window just before it occurred ‘x’. In inference (prediction) time, the models would just require
the input window ‘x’, which is a process that can be executed continuously on-device. We further differentiated
between two types of windows:
 • Positive windows: These windows include observed compulsive behaviors in the y-window. Positive
 windows were tagged with the type of behavior they mark, and whether they are ‘clean’ or ‘dirty’. Clean
 positive windows refer to those with no recorded compulsive data in the x-window, whereas the ‘dirty’
 descriptor refers to windows with compulsive behavior observed in the x-window.
 • Negative windows: These windows were selected randomly from the data set where no recorded compul-
 sive behaviors were observed in the y-window. The number of negative windows generated was equal to
 the number of positive windows per data set; this ensures the feature set is balanced.
It is worth noting that the overlap between windows is essentially guaranteed, as visible in Figure 2, due to
the limitations of the duration of the study and the low average distance between observed behaviors. We will
be using the notation of / for the discussion of different size segments with ‘A’ denoting the size of the
x-window in seconds, and ‘B’ denoting the size of the y-windows in seconds (e.g., 300 /1 would correspond to
segment sizes of 300 seconds prior and 1 seconds post the start of the behavior).
 In our study, two different segment sizes were examined, namely 60 /1 , and 300 /1 . Prevalence of intra-
participant correlations were significant, suggesting personalized training may yield better results. Segments
with 3 second y-windows were also examined to exclude 1 and 2 second long behaviors in the data set where the
behavior may not be prominent enough, however, this exposed no difference to the 1-second y-windows. Various
different lengths of x-windows were also tested (2 to 4 min), which as we shall see in (§7), results in significantly
lower performance compared to 1- or 5-min windows. As stated in Laborde’s work [16], the gold standard in
conducting HRV analysis is a 5-min window (we did not include HRV in windows < 5 min). As these windows (<
5 min) do not include HRV, we expect them to rely more on motion than heart data, as with the 1-min windows.
However, the motion data was noisier in these windows resulting in lower performance, thus confirming our
initial hypothesis.
Feature extraction. Basic descriptive features were extracted from each x-window using the Pandas library. The
descriptive data recorded includes the means, standard deviations, minimums, and maximums of each dimension
of each sensor, namely the accelerometer, gyroscope, and heart-rate sensor. Additionally, using WellBeat’s data
processing pipeline [27], we extracted Heart Rate Variability (HRV) parameters in 5-minute window data sets. In
particular, we made use of a widely used HRV parameter, the RMSSD (i.e., the root mean square differences of
successive RR intervals). Among the long list of HRV parameters [16], we chose RMSSD as it has been found to
be a good proxy for detecting stress.
 √︃ It is defined as the root mean square of the successive differences of R-R
 1 Í −1
intervals, and it is computed as −1 =1 ( − +1 ) 2 , where n is the total number of RR intervals. We refer
the reader to [27] for additional reading in conducting HRV analysis.
Anticipatory Detection of Compulsive BFRBs with Wearables MobileHCI ’21, September 27-October 1, 2021, Toulouse & Virtual, France

 0.24
 70
 Normalised heart-rate

 0.26
 60

 BFRB observations
 0.28
 50
 0.30 40
 0.32 30

 0.34 20
 10
 0.36
 0

 II
 I

 III
 II
 I

 io 1

 io 1

 io 1

 io 1

 2
 III
 2

 e
 e

 e
 e
 at k

 at k
 at k

 at k
 in

 k
 n

 n

 n

 n

 e
 in

 k

 in
 in
 ar as

 ar as
 nt as

 nt as

 s
 e

 in
 s

 el
 el

 el

 Ta
 in
 el

 Ta

 el
 ep T

 se T

 ep T

 se T
 as
 as

 as
 el
 as

 as
 B
 as
 B

 B
 B

 B
 B
 e

 e
 pr

 pr
 pr

 pr
 (a) (b)

Fig. 4. Descriptive statistics per stage. Physiological and behavioral changes in the data per experiment stage. Normalized
heart rates (a): Normalized using z-score with and from Baseline I. BFRB observation count (b): Occurrences were
reported with respect to the audiovisual recordings of experiments.

 70
 label
 60 face touching
 60
BFRB durations in seconds

 fidgeting
 50
 BFRB observations

 50 hand scratching
 leg scratching
 40 skin biting
 40
 skin picking
 30
 30
 20
 20
 10
 10
 0
 0
 1 2 3 4 5 6 7 8 9 10 1 2 3 4 5 6 7 8 9 10
 Participant ID Participant ID

 (a) (b)

Fig. 5. Descriptive statistics per participant. Observed behavior durations and count per participant. Distribution of
BFRB durations (a): Start and end timestamps were reported from the audiovisual recordings of the experiments. BFRB
observation count (b): Behaviors were labeled by an investigator based on the recordings.

 −
Normalization.We normalized all features using a z-score transformation as ( 1 1 ), where is the value of
each data point (Table 1). This technique benefited from handling outliers better than min-max normalization,
however, the output scale does not accurately represent the original data set. In our approach, the 1 and 1
values were extracted from the first baseline period of each experiment (Figure 1b) as the physical and cognitive
intensity of the study is not uniform. By using the overall scores, the output would be biased towards increases
in each sensor.

5.2 Descriptive statistics
Whilst our findings in the prevalence of different behaviors do not align perfectly with previous research on the
most common BFRBs (suggested to be nail-biting with a prevalence of 34-64%; skin-picking with a prevalence of
25%; and hair pulling with a prevalence of 10.5% [5]), we saw the most prevalent behaviors to be skin-picking
MobileHCI ’21, September 27-October 1, 2021, Toulouse & Virtual, France Searle et al.

and face-touching. As we shall see in (§7.3), 60% of our participants admit to nail-biting in a follow-up survey;
this corroborates the representativeness of our sample size.
 Before moving into phase 2 of our study, we examined the hypothesis of whether stress would invoke compulsive
behaviors. To do so, we compared the average heart rates during Task 1 and Task 2 to the baseline stages 4a. We
then gathered the number of observed behaviors in each stage (Figure 4b), and found that the average heart rate
and the number of behaviors are indeed higher during Task 1 (presentation stage), concluding that there is a
correlation between BFRBs and stress-as expected.
 Figure 5b and Figure 5a depict the distributions of behavior duration and the number of times compulsive
behavior was observed, per participant. Note that only the 2 participants with the fewest BFRB observations (P4,
P5) were observed displaying only one type of behavior. In total, skin-picking was the most prevalent behavior
(41.2%), followed by face touching (34.3%), fidgeting (8.8%), skin biting (6.5%), hand scratching (6%), nail-biting
(1.4%), leg scratching (1.4%), and hair-pulling (0.4%).

6 METHODOLOGY
Using the collected data (§5), in phase II, we set out to investigate whether these behaviors could be predicted and,
the extent to which, they could be anticipated in advance. To address that, we conducted a series of experiments
with various cross-validation methods, observation windows, and machine learning classifiers, which we describe
next.

6.1 Experiments
We explored six experimental combinations along two dimensions:
 • Anticipatory window size: Duration of activity included before observed behaviors. Analyzed window
 sizes are: (a) 1-minute and (b) 5-minute.
 • Label sets: The type(s) of compulsive behavior included in the combination. Analyzed label sets are: (a)
 all-compulsive behaviors, (b) face touching, and (c) skin picking. The latter two were selected due to their
 prevalence in the collected data (§5).
Each combination relies on binary classification, with positive labels corresponding to data points describing the
included labels of compulsive behaviors, and negative labels corresponding to periods of normal behavior.

6.2 Classification and cross-validation methods
We implemented and tested three classifiers: logistic regression (LR), random forest (RF), and gradient boosting
trees (GBT). We included LR classifier as its low relative complexity makes it viable for mobile and offline
training in addition to the interpretability of results. RF has been widely used in HAR tasks, while GBT is another
state-of-the-art shallow learning algorithm, very well optimized with lower complexity than RF.
 To assess the performance of our classifier, we used standard classification performance metrics. These include
the recall, the receiver operating characteristic (ROC), and the F1 score. We favored recall over precision due
to the nature of our task as it deemed appropriate to predict the potential of compulsive behavior than to miss
one. Put it differently, false positives cost less than false negatives in terms of diagnosis and prevention of these
compulsive behaviors. The ROC plot shows the true positive rate against the false-positive one, and it is used to
analyze and distinguish optimal models to sub-optimal ones. In our context, this allows gaining insights into
which participants can be considered outliers in the data set, and to examine the contributions of different sensor
modalities to the prediction. Finally, the F1 score shows a weighted average of precision and recall, and allows us
to distinguish between the cost of false positives to false negatives.
 In our experiments, we adopted two cross-validation strategies to model BFRBs similar to [11]. First, we
explored a Leave-one-user-out (generic) in which we excluded a participant from the test set and trained on the
Anticipatory Detection of Compulsive BFRBs with Wearables MobileHCI ’21, September 27-October 1, 2021, Toulouse & Virtual, France

remaining users. Second, we explored a Participant-stratified (personalized) in which we sampled 20% from each
participant’s data set for the test set, and trained on the remaining data points. The personalized results should
suggest the extent to which the models can be trained for individual users, whilst the generic method offers
insight on the scalability to a greater demographic based on the smaller data set.

7 RESULTS
Tables 2 and 3 report the results of the generic cross-validation and the personalized one, respectively. The results
reflect high variance across cross-validation methods, label set, and anticipatory window size, with a significant
increase in overall results using personalized cross-validation. All-compulsive results reflect the most consistent
results across window sizes.

7.1 Best performing models
For brevity, we discuss our best performing model RF using the personalized cross-validation method. To identify
the performance gain in the different modalities and, in turn, answer our RQ1 , we analyzed the results and
performed ablation tests (i.e., testing each modality in isolation). Figure 6 represents the entire analysis of
the model. Figure 6a shows that including all modalities increases overall reliability with a steady curve. The
gyroscope data alone produces the best individual results, but suffers from having only a few strong predictors
(Figure 6c).
 Heart rate ranks high in feature importance with standard deviation being the strongest performer from its
features (Table 1). The model produced using gradient boosting performed best after this in the same task. Whilst
the results are somewhat lower, the feature importance is largely the same, with the top 3 categories being
accelerometer Z, accelerometer X, and heart-rate (Table 1). The disruption from the X-axis of the accelerometer
can be noticed, however, the individual feature importances have the same strongest top 2, namely the accXmax
and accZmin. The logistic regression model does not fare well in this comparison with the highest impact
coefficients being those of the gyroscope, closely followed by heart-rate. The reliance of this model on linear
interactions may be the cause of the lower performance.

7.2 Impact of cross-validation methods
The results of the personalized cross-validation consistently outperform the generic one. We also observed lower
standard deviations in the personalized results, with generic cross-validation resulting in significant imbalances
between participants. Generic models relied heavily on heart-rate and HRV, whilst the personalized ones reflect
the performance gain from resolving varying motion signatures between participants. Overall, the findings from
evaluating each cross-validation do not suggest that accurate prediction can be generalized but, by training a
classifier to uniquely identify a single user’s signature, the accuracy of prediction is increased significantly to the
point of relevance.
Impact of anticipatory window sizes. We observed an overall performance increase in the 5-minute anticipa-
tory window versus the 1-minute window in the isolated behaviors. In the gradient boosting and random forest
models, this can be attributed to the additional RMSSD feature, providing better representation of heart-rate data
when compared to instantaneous heart-rate. However, the best generic model is consistently logistic regression.
Here, the model relies heavily on heart-rate and the gyroscope (Figure 7a).
 The personalized models tend to rely more heavily on motion data in the 1-minute windows, with heart-rate
ranking in the middle consistently in terms of feature importance; this is expected as the motion signature of
these behaviors should be relatively similar. Generic classification shows a different activity, with 1-minute
windows performing best on heart-rate alone when comparing ROC curves between the individual modalities
seen in Figure 7b, with 5-minute windows following a similar pattern with heart-rate being replaced with
MobileHCI ’21, September 27-October 1, 2021, Toulouse & Virtual, France Searle et al.

 1-minute 5-minute
 Recall AUC F1 Recall AUC F1
 All-compulsive
 Logit Regression 0.594 (0.326) 0.725 (0.148) 0.581 (0.279) 0.699 (0.347) 0.813 (0.238) 0.698 (0.324)
 Random Forest 0.515 (0.283) 0.765 (0.100) 0.549 (0.257) 0.698 (0.309) 0.663 (0.171) 0.670 (0.219)
 Gradient Boost 0.551 (0.297) 0.740 (0.129) 0.555 (0.257) 0.851 (0.232) 0.673 (0.226) 0.749 (0.204)
 Face touching
 Logit Regression 0.446 (0.377) 0.413 (0.147) 0.363 (0.270) 1.000* (0.000) 0.855 (0.205) 0.845 (0.219)
 Random Forest 0.203 (0.299) 0.436 (0.160) 0.206 (0.256) 1.000* (0.000) 0.540 (0.297) 0.790 (0.141)
 Gradient Boost 0.271 (0.221) 0.356 (0.203) 0.293 (0.225) 0.940* (0.085) 0.720 (0.311) 0.815 (0.177)
 Skin Picking
 Logit Regression 0.266 (0.194) 0.384 (0.357) 0.258 (0.181) 0.710 (0.418) 0.852 (0.232) 0.653 (0.350)
 Random Forest 0.112 (0.148) 0.220 (0.153) 0.134 (0.164) 0.745 (0.400) 0.698 (0.320) 0.620 (0.232)
 Gradient Boost 0.378 (0.350) 0.280 (0.163) 0.352 (0.180) 0.825 (0.271) 0.622 (0.292) 0.720 (0.103)
Table 2. Means of generic cross-validation results. Standard deviations are calculated over participant scores.
*Around 60% of participants’ face touching data points were discriminated and excluded based on the missingness score of
their HRV values. As stated in [27], to ensure reliable HRV estimates we filtered out scores
Anticipatory Detection of Compulsive BFRBs with Wearables MobileHCI ’21, September 27-October 1, 2021, Toulouse & Virtual, France

 1.0 Confusion Matrix
 250

 No behaviour
 225
 0.8
 236 74
 True Positive Rate

 200

 0.6 175

 True labels
 150
 0.4
 125

 Behaviour
 All modalities 54 256
 100
 0.2 Accelerometer only
 Gyroscope only
 75
 Heart-rate only
 Guessing
 0.0 No behaviour Behaviour
 0.0 0.2 0.4 0.6 0.8 1.0 Predicted labels
 False Positive Rate
 (b)
 (a)

 accXmax
 accZmin accX
 hrstd
 gyrYmax
 gyrZstd
 gyrXstd hr
 hrmin
 accYmin
 gyrYstd
 hrmax accZ
accZmean
 accZmax
accYmean
gyrZmean
 gyrXmin gyrY
 hrmean
accXmean
 accYmax
 accXmin gyrX
gyrXmean
 accXstd
gyrYmean
 gyrXmax gyrZ
 accZstd
 gyrYmin Accelerometer Accelerometer
 accYstd
 gyrZmax Gyroscope accY Gyroscope
 gyrZmin Heart-rate Heart-rate

 0.00 0.02 0.04 0.06 0.08 0.10 0.00 0.01 0.02 0.03 0.04 0.05

 (c) (d)

Fig. 6. Results of participant-stratified 1-minute all-compulsive data using Random Forest. (a) ROC-per-modality.
(b) Confusion matrix. (c) All feature importances. (d) Features are grouped per modality. The notations refer to Figure 1.

for BFRBs prediction. However, these behaviors were more predictable consistently across most experiments
when using 5-minute windows.
Effect of the granularity of behavior types. By analyzing behaviors separately, we did not find any significant
increase in the performance compared to all-compulsive predictions (Tables 2 and 3). Whilst the performance
of 5-minute windows equipped with HRV were sufficient, the motion data signature of behaviors could not
be generalized over the population. Personalized validation did show an increase in all configurations of face
touching and skin picking results over their generic counterparts, supporting the benefits of personalized models
for BFRBs inference using motion data.
MobileHCI ’21, September 27-October 1, 2021, Toulouse & Virtual, France Searle et al.

 1.0
 hrmin
 gyrXmin
 gyrYmax
 gyrXmax
gyrXmean 0.8
 gyrZmax
 rmssd
 hrmean
 gyrXstd

 True Positive Rate
 gyrYstd
 gyrZstd 0.6
 accZmax
 accYmin
 accZstd
accYmean
accXmean
 accXmax 0.4
 accXstd
gyrZmean
 accXmin
 accYstd All modalities
 accYmax
accZmean 0.2 Accelerometer only
 accZmin Gyroscope only
 hrstd Accelerometer
gyrYmean Gyroscope Heart-rate only
 hrmax
 gyrZmin Heart-rate Guessing
 gyrYmin RMSSD 0.0
 0.0 0.2 0.4 0.6 0.8 1.0
 2 1 0 1 2 3 4 False Positive Rate

 (a) (b)

Fig. 7. Important predictors for generic cross-validation (a) Coefficients per modality and axis in logistic regression
model on the generic all-compulsive 5-minute window. (b) ROC curves of each modality in random forest model on generic
all-compulsive 1-minute windows.

7.3 Follow-up survey
In the quantitative analysis, it was evident that BFRBs prediction can be achieved on both 1-min and 5-min
windows; but, the window size prior to the episode matters to the prediction accuracy. To contextualize these
findings and understand the role of BFRBs in people’s lives, we conducted a follow-up survey with our participants.
The survey included two parts. The first part consisted of three questions from the Habit Questionnaire [42]
that probed BFRBs’ presence, severity, and perseverance (Figure 8 A–C). The second part consisted of three
close-ended questions that probed our participant’s stress levels in relation to BFRBs, the willingness to receive
notifications via a wearable application, and the preferred timing of receiving such notifications (Figure 8 D–F).
Additionally, the second part consisted of two open-ended questions: i) Have any of BFRBs behaviours interfered
with your day-to-day activities, and ii) Have any of BFRBs behaviours caused injuries or permanent damage?, which
we analyzed through a thematic analysis.
 We observed that the severity of these behaviors ranged from ‘not severe’ to ‘somewhat severe’ (Figure 8.A);
an expected finding as none of our participants had been diagnosed with these conditions. However, considering
that BFRBs are significantly underdiagnosed in the general population [48], our participants might not be fully
aware of the severity of such behaviors, mainly owing to self-reporting bias. We also observed that almost all
behaviors had been prevalent for over 2 years (Figure 8.B), suggesting the prolonged severity of these behaviors.
Interestingly, all but one participant reported willingness to receive notifications about these behaviors (Figure 8.F),
suggesting a desire to treat them (or, as a first step, create awareness of these behaviors). This also sheds light
onto the scenarios in which participants are willing to receive notifications, with ‘At home’ and ‘Alone’ being the
dominant of options. We also found that only 20% of participants were in favor of the anticipatory notifications,
whilst the remaining 80% would opt for just-in-time results (Figure 8.E). The latter two results offer insights into
the desirability of such applications of wearables for consumers, however, it remains unclear whether the results
in less-favored scenarios and anticipatory notifications reflect opposition to potentially intrusive notifications, or
to social stigmas surrounding BFRBs [21, 40]. Finally, we found that stress was perceived to be a significant cause
Anticipatory Detection of Compulsive BFRBs with Wearables MobileHCI ’21, September 27-October 1, 2021, Toulouse & Virtual, France

 A B

 C D F

 E

Fig. 8. Self-reported BFRBs along with perceptions towards stress and potential interventions. Analysis of a post-
experiment follow-up survey in which the participants reported the severity, timeframe and BFRBs’ relationship to stress.
Attitudes towards the space and time of potential contextual notifications were also recorded.

for BFRB severity and prevalence by our participants (Figure 8.D), with 80% of results opting for a score of 4 or 5.
In conclusion, whilst the severity of behaviors were mostly ‘not severe’, the results reflect a resounding support
for personalized applications aiming to reduce the occurrences of these behaviors, even when perceived to be of
low severity.
 To contextualize our quantitative findings and understand the role of BFRBs in people’s lives, we conducted
a thematic analysis on the open-ended questions using a combination of open coding and axial coding [6].
First, we labeled relevant statements in the two open-ended questions of our survey. Second, axial coding was
used to identify relationships between concepts and categories that emerged during open coding. Additional
emphasis was given on the role of BFRBs in day-to-day activities, the motivations of doing them, and potential
harms/injuries that might have caused. We reviewed themes in a recursive manner than linear, and moved
between phases as needed, by repeating and re-evaluating themes and coded text as necessary [6]. We found
three high-level themes related to: Context of BFRBs, Triggers for BFRBs, and Negative Consequences.
Context of BFRBs. The first most prominent theme concerned the context in which BFRBs occur. Many
participants stated workplace-related stressors to be the primary context in which these behaviors are performed.
P7 stated that “During a stressful meeting, I start rubbing/touching face”, while P3 linked it to a stressful period
during exams (“ I bite my nails in exams and when revising. Face touching is usually done out of boredom but I do
rub my forehead in exams.”.
MobileHCI ’21, September 27-October 1, 2021, Toulouse & Virtual, France Searle et al.

Triggers for BFRBs. Building upon the theme of context, the second theme concerned triggers that motivate
these behaviors. Interestingly, some participants expressed the habitual nature of these behaviors, and not
necessarily linking them with stress (or workplace stress). For example, P8 mentioned that “I touch my face (and
beard) on a regular basis and I don’t think it’s because of stress or anything. It is the one thing that I constantly do”.
The same participant saw certain behaviors as a way of motivation or distraction from an ongoing task (“Skin
picking and fighting [sic] I don’t do constantly, there are some periods when I do them and some periods where I don’t.
It might not be stress-related, but mostly motivation related, as I do them when I feel distracted and (in a sense) don’t
want to return back to work. Also I do them while I am more lazy/not-working in other settings (e.g. I am waiting for
my turn to get in the shower)”).
Negative consequences. The third theme concerned potential harms and injuries that these behaviors cause.
While most of our participants did not suffer from very severe self-damage or injuries due to these behaviors,
some expressed mild negative consequences. P9 stated that “sometimes he had calluses, but nothing too damaging”,
while P7 had no injuries at all, other than mild “exacerbating skin issues”. However, two of our participants stated
more severe negative consequences. P2 stated that “sometimes the based of my fingernails bleeds”, whereas P4
experienced “a little inflammation after nail biting”.

8 DISCUSSION
8.1 Main results
While prior research demonstrated the efficacy of detecting compulsive behaviors such as hand-to-mouth and
smoking [2, 22], there is a dearth of literature in building predictive models to anticipate repetitive behaviors. We
conducted a semi-controlled living experiment, and collected a data set comprised of a total of 380 minutes of
BFRBs from 10 subjects. By analyzing the collected data, we found that the medical hypotheses (i.e., linked to
changes in environment, or stress [5]) surrounding these behaviors can be exploited to enhance the accuracy
of predictive systems. Higher performances were reported in personalized models, with recalls above 0.8 in
certain setups. 1-minute anticipatory window sizes performed best on predicting all-compulsive behaviors, whilst
5-minute models performed consistently throughout each setup when implemented using logistic regression.
 Furthermore, in the 1-minute personalized model, we found that motion sensors perform better when isolated
versus heart-rate, while 5-minute models relied more heavily on heart-rate for classification. Similarly, generic
models showed strong tendencies to rely on heart-rate, with personalized models gaining performance from
motion sensors. Answering our research’s overarching goal, we conclude that the prediction of BFRBs can be
achieved using limited wearable-sensing data using both 1-minute and 5-minute anticipatory windows.
 In a follow-up survey, our participants reported mostly non-severe BFRBs. However, almost all behaviors had
been prevalent, to some extent, for over 2 years, which suggests their prolonged nature. Interestingly, almost
all our participants expressed positive attitude towards receiving notifications regarding these behaviors, and
some preferred to be notified when they are at home, or alone. This means that a prediction model needs to be
“context-aware”, and offers useful insights into the design of wearable-based interventions (e.g., nudges). However,
it remains unclear whether the results in less-favored scenarios and anticipatory notifications reflect opposition
to potentially intrusive notifications, or to social stigmas surrounding BFRBs [12].

8.2 Implications
Our work has both theoretical and practical implications. From a theoretical standpoint, our findings concern
medical implications. Physiology is a foundational area of medical training and practice, and our work contributes
towards the goal of harnessing physiological data to advance clinical machine learning with consumer devices
[34]. For instance, our work can provide insights into diagnosis and disease progression. Whilst reviewing the
audiovisual footage, we found there was increased activity (captured from the motion and heart rate sensors)
Anticipatory Detection of Compulsive BFRBs with Wearables MobileHCI ’21, September 27-October 1, 2021, Toulouse & Virtual, France

leading up to the compulsive behaviors, confirmed by our results. Based on this, we hypothesize, that compulsive
behaviors may differ in intensity and their role in emotion regulation. We foresee that our work would provide
an additional dimension to compulsive behavior analysis and diagnosis, by defining the path to clinical diagnosis
of BFRBs as progressive in terms of development.
 From a practical perspective, there have been some examples of works dealing with real-time detection of
compulsive behaviors relying on motion data and heart-rate data for inference [2, 22]. However, predicting the
occurrence of compulsive behaviors ahead of time is a novel area of pervasive health. Our multisensory approach
is feasible to be deployed in a real-world application as our models are explainable and lightweight to be ported to
wearable devices for continuous monitoring in free-living conditions. The short 1-minute observation windows
allow for immediate interventions, while longer windows of 5-minute are more robust in terms of prediction
accuracy. Specifically, we found that, heart rate data in conjunction with motion can be used to anticipate
compulsive behavior. Motion being a predictive modality was expected due to the nature of behaviors being
linked to stressful situations, however, heart rate data shows more promise when leading up to the occurrences of
BFRBs. More importantly, the follow-up survey results suggest our participants’ willingness to get notified when
such behavior(s) occur. Interestingly, the timing of receiving such notifications varied among our participants’
responses, suggesting that it plays an important role into how well the notification could be perceived.
 In general, our BFRBs models could be utilized to support BFRB treatment methods (e.g., CRT [1]), create
awareness of such behaviors but, more specifically, enforce them into adopting good personal hygiene practices.
Given the recent re-emergence of face-touching as a public health risk for infectious diseases, our face-touching
model could be of immediate use. For example, recent preliminary studies found that the use of masks reduced
face-touching [37]. In a similar vein, our approach may have a role in COVID-19 transmission slowdown by
creating awareness of one’s face-touching behavior [28]. As discussed earlier, our models could also complement
other modalities such as electrodermal sensors or ultrasound signals emitted by earphones [33], towards more
comprehensive monitoring of face touching; a prominent use case in light of COVID-19.

8.3 Limitations
Our work has four main limitations that speak for future work. First, to determine whether our methods could
differentiate between the two most prominent behaviors (i.e., skin picking and face touching) an additional
experiment was conducted. However, due to the differences in behavior patterns in our data set (Figure 5b),
neither cross-validation method provided satisfactory results. Secondly, the missing RMSSD feature from 1-minute
windows, due to heart-rate variability measurement traditionally using 5-minute windows [23], also inhibits the
analysis when comparing different window sizes. However, more recent research suggests some features may be
accurately extracted from smaller windows with promising results [35]. We also analyzed different window sizes
(2-, 3-, 4-minute), however, the results expectedly decreased as the motion data became noisier whilst still lacking
RMSSD data. The third limitation concerns the format of the experiment, resulting in overlapping segments of
data from which features were extracted. Finally, the fourth limitation concerns the simulation of real-world use
cases. While the user study appropriated real-world scenarios through stress-inducing tasks, our findings should
be interpreted under the study’s experimental conditions. We acknowledge that presentation and arithmetic
tasks might constitute a small fraction of real-world tasks but we think that it fits our set up and study goals.
For instance, our study does not account for users on-the-go (e.g., people walking or running), thus is limited to
the current experimental setup (i.e., sitting position). Whilst the results indicate our expectations were accurate,
future studies would be required to acquire further evidence for the prediction of these compulsive behaviors.
 To sum up, these limitations primarily arise from the size and labeling of the data set. The length of each
behavior is not uniform and is not accounted for in the analysis. The intensity of behaviors is also excluded, but
could be used to add additional labels. Further studies would include more participants, potentially even filtering
MobileHCI ’21, September 27-October 1, 2021, Toulouse & Virtual, France Searle et al.

for certain behaviors allowing for more fine-grained tuning. Future work would also extend data gathering to
include a free-living study to comprise a larger data set, with greater focus on the potential of personalized
models. Scaling the study to support tailored models of participants would be straightforward as calibration
only requires a 5-minute baseline reading from the user to begin with. Labeling would be conducted through a
combination of both inference and participant feedback to ensure the validity of data gathered from unobserved
environments.

9 CONCLUSION
Body-focused repetitive behaviors like face-touching or skin-picking are characterized primarily by the use
of hands. While there is an abundance of medical evidence on the importance and severity of these behaviors
(particularly if not early identified and corrected), there is yet dearth of empirical exploration of these behaviors
using consumer-grade wearables. We conducted a feasibility study in which participants were exposed to a series
of tasks that induced BFRBs. By analyzing a total of 380 minutes of raw signals under an extensive evaluation of
sensor modalities, cross-validation methods, observation windows, and machine learning classifiers, we found that
BFRBs can be predicted with sufficient accuracy. In particular, generic compulsive behavior (vs. normal) achieves
89.2 AUC, face touching 94.4 AUC, and skin picking 94 AUC. Across most models, using an observation window
of 5 minutes prior to the episode outperformed the 1 minute one and, notably, the heart sensors were stronger
predictors in the former while the motion sensors dominated in the latter. These findings are a fundamental step
towards creating awareness of one’s BFRBs (given the recent re-emergence of face touching as a public health
risk for infectious diseases), and designing just-in-time interventions to prevent them.

ACKNOWLEDGMENTS
This work is partially supported by Nokia Bell Labs through their donation to the Centre of Mobile, Wearable
Systems and Augmented Intelligence at the University of Cambridge. D.S is additionally supported by the
Embiricos Trust Scholarship of Jesus College Cambridge, and the EPSRC through Grant DTP (EP/N509620/1).
The authors declare that there is no conflict of interest regarding the publication of this work.

REFERENCES
 [1] American Psychological Association [n.d.]. Competing response training. American Psychological Association. https://dictionary.apa.
 org/competing-response-training.
 [2] Asaph Azaria, Brian Mayton, and Joseph Paradiso. 2016. Thumbs-Up. In Proceedings of the International Joint Conference on Biomedical
 Engineering Systems and Technologies. SCITEPRESS-Science and Technology Publications, Lda, 54–65.
 [3] Brandon Ballinger, Johnson Hsieh, Avesh Singh, Nimit Sohoni, Jack Wang, Geoffrey H Tison, Gregory M Marcus, Jose M Sanchez, Carol
 Maguire, Jeffrey E Olgin, et al. 2018. DeepHeart: semi-supervised sequence learning for cardiovascular risk prediction. In Thirty-Second
 AAAI Conference on Artificial Intelligence.
 [4] Antje Bohne, Nancy Keuthen, and Sabine Wilhelm. 2005. Pathologic hairpulling, skin picking, and nail biting. Annals of Clinical
 Psychiatry 17, 4 (2005), 227–232.
 [5] Antje Bohne, Sabine Wilhelm, Nancy J Keuthen, Lee Baer, and Michael A Jenike. 2002. Skin picking in German students: Prevalence,
 phenomenology, and associated characteristics. Behavior modification 26, 3 (2002), 320–339.
 [6] Virginia Braun and Victoria Clarke. 2006. Using Thematic Analysis in Psychology. Qualitative Research in Psychology 3, 2 (2006), 77–101.
 https://doi.org/10.1191/1478088706qp063oa
 [7] Andreas Bulling, Ulf Blanke, and Bernt Schiele. 2014. A tutorial on human activity recognition using body-worn inertial sensors. ACM
 Computing Surveys (CSUR) 46, 3 (2014), 1–33.
 [8] Michelle Nicole Burns, Mark Begale, Jennifer Duffecy, Darren Gergle, Chris J Karr, Emily Giangrande, and David C Mohr. 2011.
 Harnessing Context Sensing to Develop a Mobile Intervention for Depression. J Med Internet Res 13, 3 (12 Aug 2011), e55. https:
 //doi.org/10.2196/jmir.1838
 [9] Baptiste Caramiaux, Nicola Montecchio, Atau Tanaka, and Frédéric Bevilacqua. 2014. Adaptive gesture recognition with variation
 estimation for interactive systems. ACM Transactions on Interactive Intelligent Systems (TiiS) 4, 4 (2014), 1–34.
You can also read