Approach for Quantifying Rare Earth Elements at Low keV
←
→
Page content transcription
If your browser does not render page correctly, please read the page content below
1864 Microsc. Microanal. 27 (Suppl 1), 2021
doi:10.1017/S1431927621006802 © Microscopy Society of America 2021
Approach for Quantifying Rare Earth Elements at Low keV
Heather Lowers
USGS, United States
The challenges of analyzing bastnaesite (REECO3F) and hydroxylbastnaesite (REECO3OH) include beam
sensitivity, quantification of light elements in a heavy element matrix, the presence of elements that cannot
be analyzed by electron probe microanalysis (H), and the use of x-ray lines whose physical constants are
not well known. To overcome some of these challenges, Ca, La, Ce, Pr, Nd, and Sm were analyzed at 15
keV accelerating voltage and the light elements (C, O, F) were analyzed at 7 keV accelerating voltage
[1]. This approach is ideal for samples that are homogeneous within the volume analyzed. However, for
the bastnaesite of interest, this solution is unsatisfactory because backscattered electron imaging reveals
chemical variations at scales of less than 1 m (fig. 1). Monte Carlo simulations and wavescans of the
rare earth element (REE) M family of x-rays were evaluated to determine the best analytical approach.
Monte Carlo simulations using Casino v2.42 [2] were run on a substrate of CeCO3F with a density of 5.00
g/cm3 at 15 keV and 7 keV accelerating voltage. Depth distribution curves, φ(ρz), reveal x-ray generation
at 15 keV for the Ce L shell x-rays approaches 1.0 m whereas the depth of Ce M shell x-ray generation
at 7 keV is less than 0.4 m (fig. 1). Similarly, the K shell x-ray generation depth for C, O, and F at 7 keV
is also less than 0.4 m (fig. 1). These simulations demonstrate an accelerating voltage of 7 keV or less
and use of the REE M x-rays is necessary to acquire chemical information from the same volume of
material for the light and heavy elements. Bastnaesite contains all REEs and therefore one must consider
the energy of the highest x-ray line of interest, namely the Lu M at 1.83 keV, to achieve an overvoltage
(Eo/Ec) greater than 2. Bastnaesite is also an insulator and requires a conductive coating, therefore 7 keV
was used to avoid contributions of the coating material to the analysis given the above constraints.
The USNM REE phosphate standards, Edinburgh REE glasses, CeO2, LaB6, and the metals of Sm, Dy,
Gd, Er, and Yb were selected to evaluate the peak overlaps of the M family x-ray lines. The materials
were coated with ~ 5nm iridium with a Leica ACE600 prior to analysis. Full spectrometer wavescans
were collected at 7 keV accelerating voltage, 50 nA beam current, and 20 µm beam diameter on a JEOL
8530F Plus using TAP and TAPL crystals. The step size was 0.109 mm along the length of the
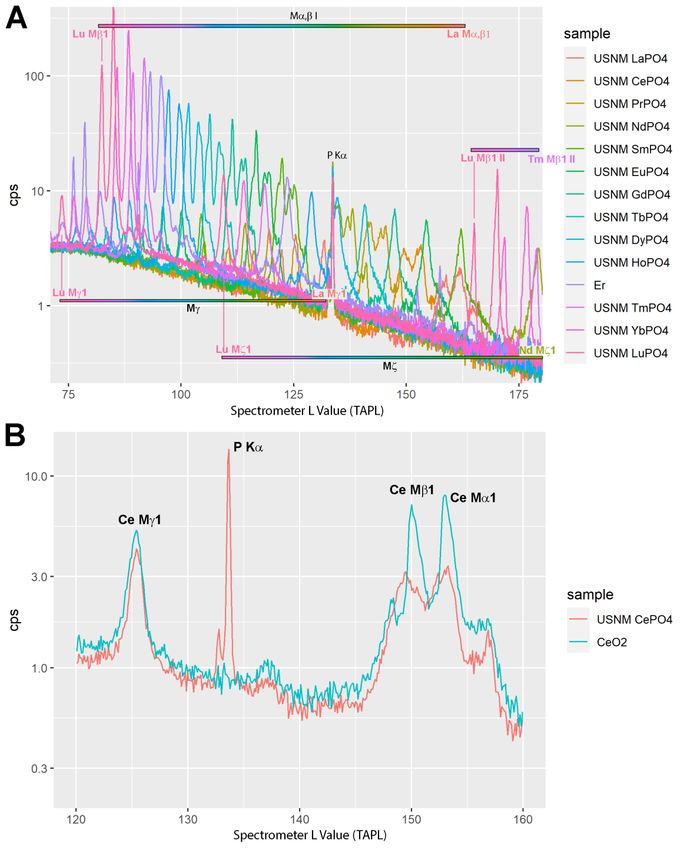
spectrometer with a dwell of 3 seconds at each step. M and M lines are broad and not individually
resolved for the light REE but become more separated and sharper with increasing atomic number (fig.
2A). M and M lines for each REE are also present across the spectrometer range further complicating
peak interference corrections (fig. 2A). The peak positions and overall shape for the Ce M and M lines
vary with the coordination of the element (fig. 2B). Significant shifts in position and shape were not
observed when comparing the Ce M peaks of CeO2 and CePO4 (fig. 2B). Similar results were seen when
comparing the available REE metal to the phosphate (Sm, Dy, Gd, Er, Yb). These wavescans indicate the
use of the M or M lines if matrix matched standards are not available.
Any use of trade, firm, or product names is for descriptive purposes only and does not imply endorsement
by the U.S. Government.
Downloaded from https://www.cambridge.org/core. IP address: 46.4.80.155, on 22 Sep 2021 at 05:48:08, subject to the Cambridge Core terms of use, available at
https://www.cambridge.org/core/terms. https://doi.org/10.1017/S1431927621006802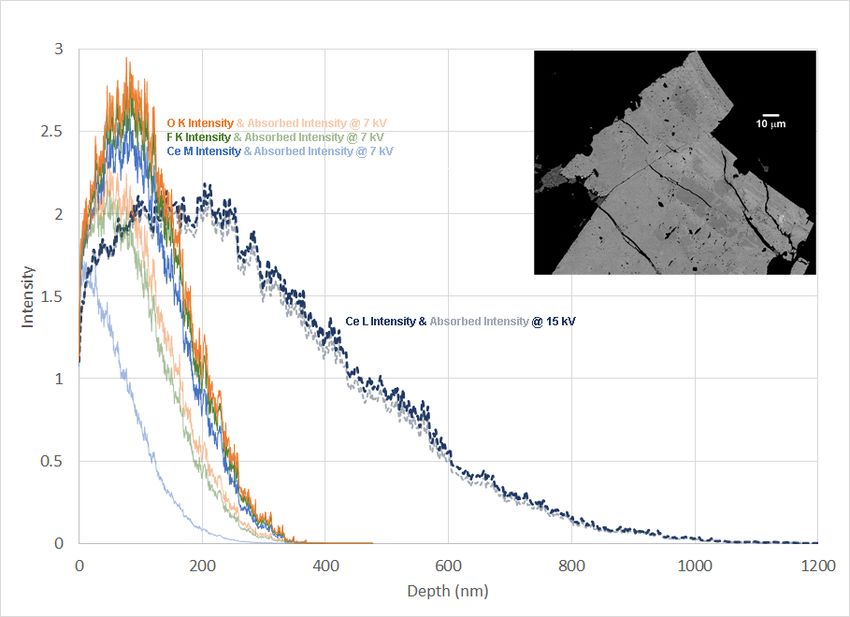
Microsc. Microanal. 27 (Suppl 1), 2021                                                                                                                                 1865

            Figure 1. Depth distribution curves, φ(ρz), for Ce, F, and O at 7 keV and Ce at 15 keV. A backscattered
            electron image of bastnaesite shows the fine spatial variation of the composition.

Downloaded from https://www.cambridge.org/core. IP address: 46.4.80.155, on 22 Sep 2021 at 05:48:08, subject to the Cambridge Core terms of use, available at https://www.cambridge.org/core/terms.
https://doi.org/10.1017/S1431927621006802
1866 Microsc. Microanal. 27 (Suppl 1), 2021
Figure 2. A. Wavescans on the USNM REE phosphates demonstrate multiple peak overlaps due to M,
M, M, and M x-ray lines. B. Spectrometer scans across the M, M, and M peaks in CePO4 and
CeO2 demonstrate clear changes in peak position and shape for the M and M x-ray lines but no
resolvable change in the M x-ray line.
References
[1] H. Lowers and G. Swayze, Microscopy and Microanalysis 26 (S2) (2020), p. 1884.
doi:10.1017/S1431927620019704
[2] Drouin. D. et al., Scanning, 29 (2007), p. 92. doi:10.1002/sca.20000
Downloaded from https://www.cambridge.org/core. IP address: 46.4.80.155, on 22 Sep 2021 at 05:48:08, subject to the Cambridge Core terms of use, available at https://www.cambridge.org/core/terms.
https://doi.org/10.1017/S1431927621006802You can also read