ASSESSMENT OF THE GULF OF ST. LAWRENCE (4RST) GREENLAND HALIBUT STOCK IN 2020
←
→
Page content transcription
If your browser does not render page correctly, please read the page content below
Canadian Science Advisory Secretariat
Quebec Region                                                    Science Advisory Report 2021/017

    ASSESSMENT OF THE GULF OF ST. LAWRENCE (4RST)
          GREENLAND HALIBUT STOCK IN 2020

Greenland Halibut (Reinhardtius hippoglossoides)

                                                       Figure 1. Map of the Gulf of St. Lawrence
                                                       Greenland halibut Stock Management Area,
                                                       showing Northwest Atlantic Fisheries Organization
                                                       (NAFO) Divisions 4RST.

Context:
Greenland halibut (Reinhardtius hippoglossoides) of the Gulf of St. Lawrence (Figure 1) has been
considered a separate stock from the Atlantic population since 1993. It is assessed and managed on a
two-year cycle. An update of the stock status is produced during the interim years.
Until the mid-1970s, Greenland halibut (commonly called turbot) from the Gulf of St. Lawrence (4RST)
were not subjected to any directed fishery. It was in the late 1970s that a directed gillnet and bottom trawl
fishery developed. Since 1993, directed fishing has been prohibited for mobile gear. It is currently
authorized for the inshore fixed gear fleets of Quebec and the west coast of Newfoundland.
In the current situation, the Total Allowable Catch (TAC) cannot be caught since mobile gear fleets do not
have access to the directed Greenland halibut fishery. Part of the TAC allocated to them is transferred to
the fixed gear fleet, while the rest is no longer fished. In this document, the terminology “fishing
allocation” is used to indicate the portion of the TAC that can be caught by fixed gear fleets.
The fishery is subject to several management measures, including a fishing season, characteristics of
fishing gears and control of catches by a TAC to limit exploitation of the stock.
The indicators used for the assessment of the stock status are taken from fishery statistical data,
sampling of commercial catches and scientific research surveys.
The present science advisory report results from the regional advisory meeting on the Assessment of the
Gulf of St. Lawrence (4RST) Greenland halibut, held February 23th and 24st, 2021 in Mont-Joli, Quebec.
Additional publications from this meeting will be posted on the Fisheries and Oceans Canada (DFO)
Science Advisory Schedule as they become available.

May 2021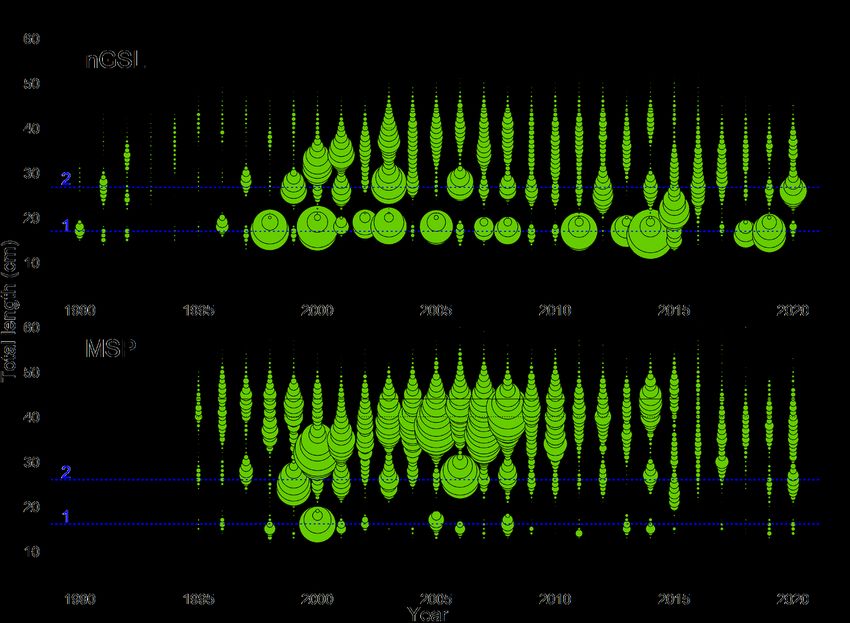
Assessment of the gulf of St. Lawrence
    Quebec Region                                       (4RST) Greenland halibut stock in 2020

SUMMARY
•     The total allowable catch (TAC) for the Gulf of St. Lawrence Greenland halibut stock was
      gradually reduced by 50% between the 2017-2018 and 2020-2021 fishing seasons to stand
      at 2,250 t. Preliminary landings for 2020-2021 totaled 1,330 t.
•     For the Western Gulf and Esquiman sectors, fishing effort and landings decreased from
      2019 to 2020 and reached some of the lowest values in each of the series. The situation
      was different for the North Anticosti sector which, after being abandoned from 2015 to 2017,
      experienced a resumption of activities. Between 2019 and 2020, the effort remained fairly
      stable while landings increased.
•     From 2019 to 2020, the commercial fishery performance indices were stable for the Western
      Gulf and Esquiman sectors and increased in the North Anticosti sector. The indices of the
      three sectors are below the average of their respective series.
•     The composition of landings changed markedly between 2018 and 2019. The average fish
      size decreased by 2.5 cm to 45.6 cm (average of 47.0 cm). The proportion of fish smaller
      than the minimum size of 44 cm increased to 30% (average of 17%). In 2018 and 2019
      landings were made up of nearly 85% females (average of 80%). Data for 2020 were partial
      due to the health measures related to the pandemic.
•     According to scientific surveys by DFO and mobile sentinel program, the abundance and
      biomass indices of Greenland halibut generally showed a downward trajectory from the end
      of the 2000s to 2019. These indices increased slightly between 2019 and 2020 to levels well
      below the peaks of the 2000s. This increase is caused by the arrival of the strong 2018
      cohort. This cohort is showing a normal growth rate and should start recruiting to the fishery
      in 2024.
•     The cohorts expected to recruit to the fishery in 2021 and 2022 are of average to low
      abundance.
•     At the Gulf level, the exploitation rate indicator decreased from 2019 to 2020 and remained
      close to the series average.
•     The Gulf of St. Lawrence is undergoing major changes: deep waters are warming and
      becoming depleted of oxygen. These changes can lead to habitat degradation, decreased
      growth, increased natural mortality and can negatively affect the productivity of Greenland
      halibut. In addition, changes in the structure of the community (high abundance of redfish
      and low abundance of shrimp) can modify the interactions of competition for food resources
      or for habitat. Current environmental conditions and climate projections suggest that the
      situation is likely to worsen.
•     According to the precautionary approach under development, the stock status indicator was
      on a downtrend with a decline of over 60% between 2008 and 2017, moving from the
      healthy zone to the cautious zone. The indicator stabilized from 2017 to 2020 and is midway
      between the limit reference point and the upper stock reference point. Under these
      conditions, a reduction in catches below recent levels could reduce the exploitation rate and
      help increase the stock. However, the unfavorable environmental conditions for Greenland
      halibut that prevail in the Gulf of St. Lawrence could be determining factors in the trajectory
      of the stock's abundance.

                                                   2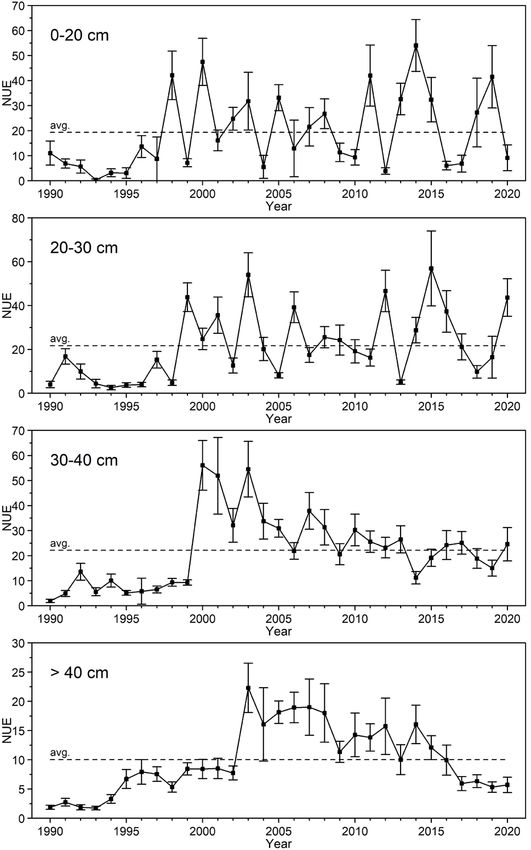
Assessment of the gulf of St. Lawrence
 Quebec Region                                       (4RST) Greenland halibut stock in 2020

INTRODUCTION
Overview of oceanographic conditions and the ecosystem
The ecosystem of the Gulf of St. Lawrence (GSL, NAFO Divisions 4RST) has undergone
significant changes in recent decades. Deep waters have been warming and dissolved oxygen
levels have decreased. In 2020, the waters above 150 m warmed up further and new records
were observed at 200, 250 and 300 m for a series that began in 1915. The water temperature at
300 m reached 6.77 °C over the entire Gulf, nearly 1.5 °C more than in 2009. For the first time,
a zone of deep water with a temperature of 7 to 8 °C was observed in the northeast of the Gulf.
Since 1930, the dissolved oxygen (DO) level has decreased by more than 50% in the GSL
channels. The lowest levels are recorded in the lower estuary, site of the main nursery for
Greenland halibut.
From 1990 to 2020, information provided by the DFO research survey conducted in the northern
Gulf of St. Lawrence (nGSL), indicates that Greenland halibut occupy comparable depths
annually, despite the increase in temperature and the decrease in DO levels (Figure 2). Across
the Gulf, the median temperature at which the majority of Greenland halibut are found increased
from 5.2 to 6.1 °C between 2010 and 2020 and the DO saturation level of the waters decreased
from 32 to 20%. It is in the Lower Estuary that the biomass of Greenland halibut is found in
waters where the DO level is lowest at 16% saturation in 2020 (Figure 2).
Scientific works have shown that increasing deep water temperature and oxygen depletion
could lead to loss of habitat quality for Greenland halibut. In addition, observed ecosystem
changes are also responsible for the decrease in growth rate and increased mortality in this
species. The GSL deep water temperature is forecast to remain elevated for the next several
years and DO levels may decline further.
In the 1980s, the nGSL ecosystem was dominated by groundfish. In the early 1990s, this
ecosystem experienced a collapse of major groundfish stocks including Atlantic cod (Gadus
morhua) and redfish (Sebastes spp.). This decrease in these top predators, coupled with
suitable environmental conditions, has favored an increase in forage species, including different
shrimp species. Greenland halibut biomass increased at the same time as northern shrimp
(Pandalus borealis) while the abundance of large groundfish declined. For the past ten years or
so, we have observed a simultaneous decrease in the various species of shrimp and Greenland
halibut, while the biomass of redfish is increasing.
In 2020, the combined biomass of the two redfish species (Sebastes mentella and S. fasciatus)
represents 81% of the biomass of all organisms caught in the DFO research survey conducted
in the nGSL, while it averaged 15% between 1995 and 2012. Since these are long-lived
species, redfish will share the GSL ecosystem with Greenland halibut for many years. This
abundance of redfish could have significant repercussions on Greenland halibut, through
interactions of competition for food resources or habitat. Redfish and Greenland halibut present
common prey in their diet, including northern shrimp, pink glass shrimp (Pasiphaea
multidentata) and redfish.
Overall, the signals observed in the GSL indicate that this ecosystem is changing. Current
conditions, which are unfavorable for Greenland halibut, will not change and may deteriorate
further.

                                                3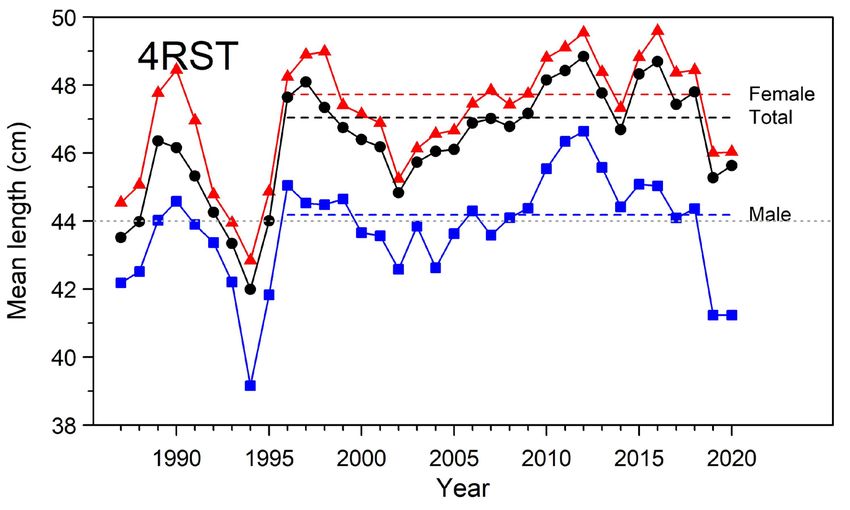
Assessment of the gulf of St. Lawrence
 Quebec Region                                           (4RST) Greenland halibut stock in 2020

Figure 2. Distributions of Greenland halibut biomass as a function of depth, temperature and oxygen
saturation level for the entire Gulf (4RST) and the Lower Estuary during the DFO nGSL survey. Box and
whisker plot: the line inside the box represents the median, the box extends from percentiles 25 to 75,
and the whiskers (vertical lines on either side of the box) extend from percentiles 5 to 95. The dotted
horizontal line on each of the graphs represents the series average.

Biology
Greenland halibut occupies more than 85,000 km2 in the nGSL and 95% of its biomass is
concentrated in less than 50,000 km2. It is mainly found in channels at depths varying from 200
to 400 m (Figure 3). This is one of the Atlantic populations living in the warmest waters.
Juveniles are predominant in the Lower Estuary and north of Anticosti Island and are generally
found at shallower depths than adults. In August, an average of 22% of the Greenland halibut
abundance is found in the Lower Estuary.
Spawning occurs in winter between January and March, in the depths of the Laurentian
Channel southwest of Newfoundland. Greenland halibut is characterized by low fecundity, it
produces large eggs (3,4 – 4,7 mm in diameter) and spawns only once a year. The eggs,
released and fertilized near the bottom, spend about 30 days in the water column before

                                                   4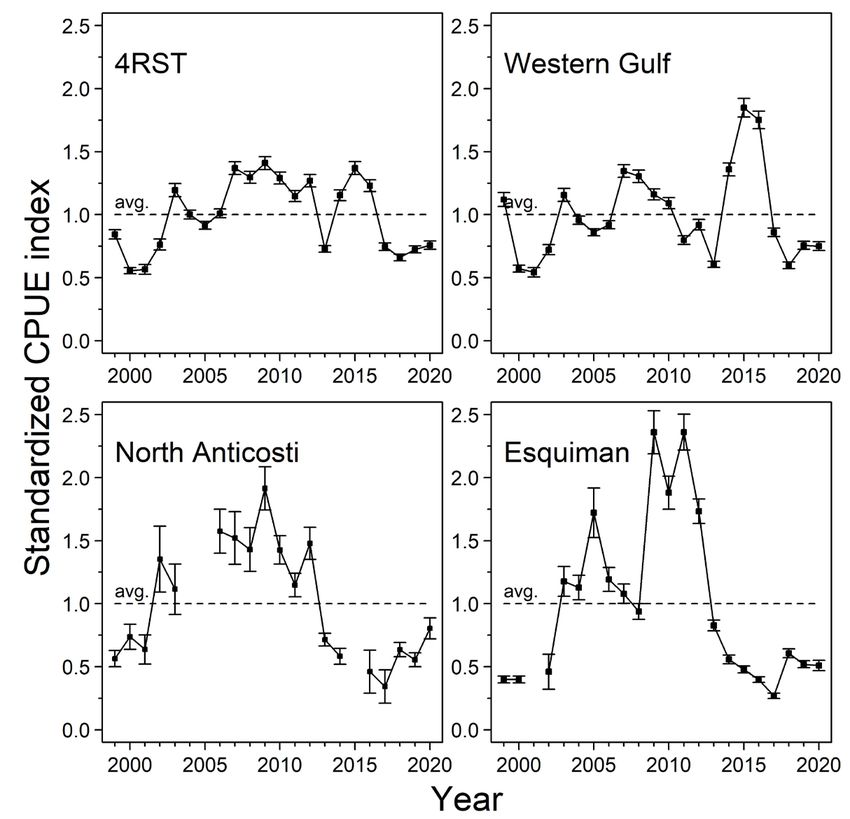
Assessment of the gulf of St. Lawrence
Quebec Region (4RST) Greenland halibut stock in 2020
hatching within 50 m of the surface. Larval development occurs in this surface layer and could
last up to four months. Subsequently, the larva settle on the bottom at metamorphosis.
In this species, males reach sexual maturity at smaller sizes than females. There is dimorphism
and females reach larger sizes. Finally, Greenland halibut is a vigorous swimmer, it makes large
daily vertical migrations and spend nearly 25% of its time in the water column.
The Greenland halibut diet varies depending on its size. Individuals smaller than 20 cm have a
mixed diet consisting of zooplankton (hyperid amphipods and euphausids) and small fish. As
Greenland halibut grow, their diet begins to comprise mainly fish and shrimp. The dominant fish
species in the diet is capelin (Mallotus villosus). In recent years (2015-2020), redfish have
become more important in the diet of Greenland halibut larger than 30 cm. Individuals larger
than 40 cm consume mainly shrimp, herring (Clupea harengus), small demersal fish, redfish
and capelin. The main predators of Greenland halibut are seals (Harp seal (Phoca
groenlandica), Hooded seal (Cystophora cristata), Grey seal (Halichoerus grypus)) and Atlantic
halibut (Hippoglossus hippoglossus).
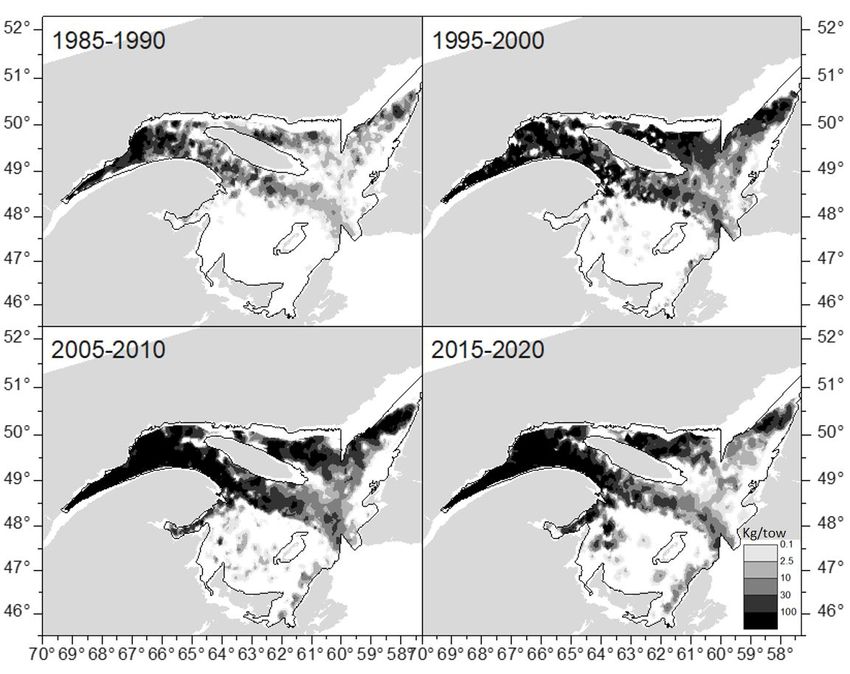
Figure 3. Distribution of catch rates (kg / tow) of Greenland halibut in the combined DFO nGSL and sGSL
series.
The fishery
Until the mid-1970s, landings of Greenland halibut in the GSL were primarily bycatch from
trawlers targeting shrimp and groundfish (Figure 4). The directed gillnet fishery for Greenland
Halibut developed from 1977. A first TAC of 7,500 t was established in 1982. From 1982 to
1992, GSL Greenland Halibut was managed as a component of the Atlantic stock. The highest
landings exceeded 8,000 t in 1979 and 1987. These high landings were followed by steep
5
Assessment of the gulf of St. Lawrence
 Quebec Region                                             (4RST) Greenland halibut stock in 2020

declines. In the early 1990s, studies of parasite species composition separated Greenland
halibut populations and demonstrated that the GSL population represented a distinct stock. A
TAC of 4,000 t was put in place for this stock in 1993.
The TAC remained fixed at 4,500 t with a fishing allocation of 3,751 t between the management
years 2004-2005 and 2017-2018 (Figure 4, Table 1). The fishing allocation was completely
fished annually until the 2011-2012 fishing season. For the 2017-2018 fishing season, greatest
difference between the fishing allocation and the landings was observed. Since then, the TAC
has been gradually reduced by 50% and was 2,250 t with a fishing allocation of 1,875 t for the
2020-2021 fishing season. As of December 12, 2020, landings totaled 1,326 t or 71% of the
fishing allocation. The fishing allocation is divided between the Quebec (82%) and the
Newfoundland (18%) fleets. The Quebec and Newfoundland fixed gear fleets have so far landed
respectively 66% and 96% of their fishing allocation. These landings data are preliminary, but
should not increase significantly with the continuation of fishing by the Quebec fleets next
spring.
The number of active fishers in the directed Greenland halibut fishery decreased by almost
35 % between the 2014-2016 and 2017-2020 seasons, from an average of 154 to 101 fishers.
The decrease is similar for the Quebec and Newfoundland fleets. Several factors, including
participation in more lucrative fisheries and management measures in place, could explain this
decrease.

Figure 4. Greenland halibut reported landings (t) since 1970, TAC, and fixed gear fishing allocation. In
2000, the management year was changed from the civil year to the quota year (May 15 of the current
year to May 14 of the following year). Data for 2020 are preliminary.

Fishery management measures include the imposition of a minimum mesh size of 152 mm (6.0
inches) and a minimum size for Greenland halibut of 44 cm in commercial catches as part of a
small fish protocol. Quebec fishers are allowed a maximum of 120 gillnets while the maximum is
90 for Newfoundland fishers. Fishers are required to complete a logbook (100%), have their
catches weighted at dockside (100%) and agree to take an at-sea observer on board at the
request of DFO (5 to 15% coverage of trips, depending on the fleet). The use of the vessel
monitoring system (VMS) has been gradually implemented in Quebec since 2013 and has been
mandatory on all vessels since 2017. In Newfoundland, the use of VMS is not required for the

                                                     6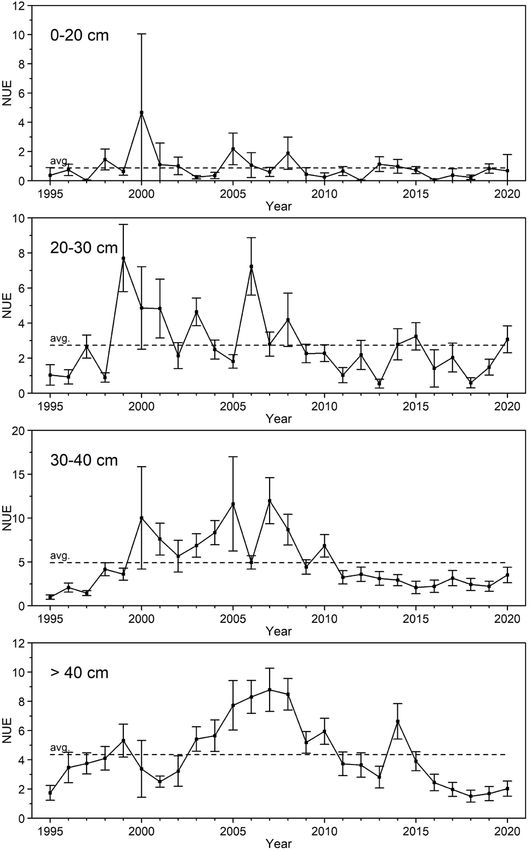
Assessment of the gulf of St. Lawrence
 Quebec Region                                            (4RST) Greenland halibut stock in 2020

entire fleet. The majority of Quebec fishers holds individual transferable quotas while all
Newfoundland fishers are under a competitive regime.

Table 1. Landings (t) by gear type and total, fishing allocation, and TAC. Average by period and annual
landings per fishing season beginning in 2017-2018.

                                Gear                                        Fishing
       Period                                       Total landings (t)                      TAC
                        Fixed          Mobile                            allocation (t)
     1980-1989         3,612          1,215                4,827               -            7,175
     1990-1999         2,558            309                2,868               -            5,700
     2000-2010         3,144            108                3,252               -            4,300
     2010-2017         3,384              28               3,424           3,751            4,500
     2017-2018         1,750              15               1,765           3,751            4,500
     2018-2019         1,590              14               1,604           2,813            3,375
     2019-2020         1,887               9               1,896           2,813            3,375
     2020-20211        1,326               4               1,330           1,875            2,250
   1 Preliminary data as of December 12th, 2020.

    Bycatch in the Greenland halibut fishery
Bycatch in the Greenland halibut gillnet fishery was estimated for the period 2000 to 2020 using
data from the at-sea observer program. No data from this program was available in 2020 for the
west coast of Newfoundland. Close to 480 t of bycatch are caught annually and it represents on
average 19% of the weight of Greenland halibut landings. A decrease in Greenland halibut
landings has increased this percentage since 2017. It is respectively 24% and 32% for 2019 and
2020. The most frequent bycatch species are, in order of importance, American plaice
(Hippoglossoides platessoides), Redfish, Snow crab (Chionoecetes opilio), Thorny skate
(Amblyraja radiata), Spiny crab (Lithodes maja), Atlantic halibut, skates and Witch flounder
(Glyptocephalus cynoglossus, Table 2). The occurrence of Redfish and Atlantic halibut
increased in 2019 and in 2020 compared to the series average, reflecting the increased
abundance of these species in the GSL ecosystem. More than a third of all bycatch is landed,
the rest is discarded at sea. Discards at sea include species that can be released by the fishers
such as Black dogfish (Centroscyllium fabricii), Atlantic lumpfish (Cyclopterus lumpus), Hagfish
(Myxine glutinosa) and Atlantic wolfish (Anarhichas lupus); mandatory release species such as
Atlantic halibut < 85 cm, Snow crab and, skates; and species of no commercial value such as
starfish, skate eggs, and polychaetes.
    Greenland halibut bycatch in the shrimp fishery
The shrimp fishery is carried out using small-meshed trawls that catch and retain several fish
and marine invertebrate species. Although large fish escape from trawls due to the mandatory
use of a separator grate, catches still contain a certain number of small specimens. Greenland
halibut bycatch from the shrimp fishery from 2000 to 2020 were examined using the at-sea
observer database. Greenland halibut were present on average in 92% of the observed
activities. Greenland halibut bycatch are mostly of the order of 3 kg or less per tow and are
mostly made up of 1 year-old individuals, and to a lesser extent 2 year-old individuals. The
average annual Greenland halibut bycatch from the shrimp fishery in the Estuary and GSL from
2000 to 2020 are around 92 t. In 2019 and 2020, they were estimated at 212 t and 73 t
respectively, representing approximately 1.18 and 0.22% of the biomass of small Greenland
halibut (< 30 cm) estimated from the nGSL DFO survey.

                                                    7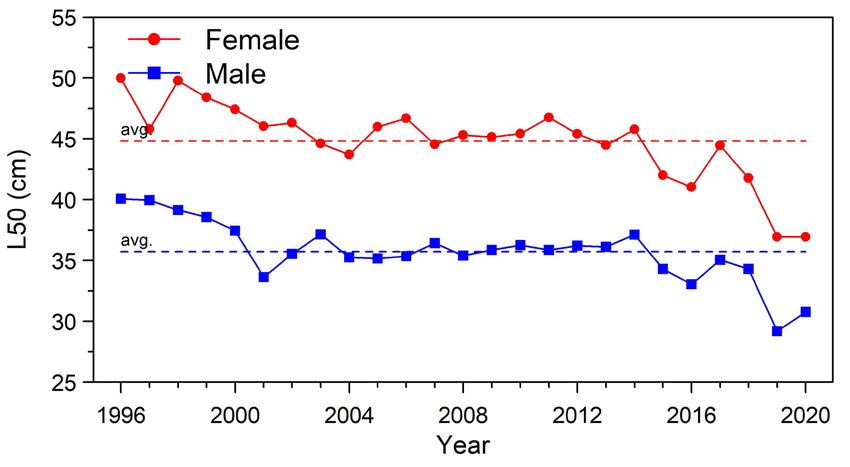
Assessment of the gulf of St. Lawrence
 Quebec Region                                           (4RST) Greenland halibut stock in 2020
Table 2. Occurrence, Greenland halibut catch, and bycatch of the most frequent species (occurrence
> 10 %) caught during directed gillnet fishing activities for Greenland halibut in 2019 and 2020 and
average for the period 2000 to 2018.
                                     Occurrence (%)                           Catch (t)
 Taxon                        2000-2018    2019     2020        2000-2018        2019        2020
 Greenland halibut*              100         100        100       3,053          2,056     1,213
 American plaice*                 77          82         81          45             73        62
 Redfish*                         59          95         71          27             59        24
 Snow crab                        59          29         19          66             15         9
 Thorny skate                     50          71         66          62             76        34
 Spiny crab                       49          38         29          23             13         7
 Atlantic halibut*                48          54         41         105             94        41
 Skates                           40          31         37          45             18        36
 Witch flounder*                  37          86         82           8             38        32
 Anthozoan                        25          52         37           6              8         7
 Atlantic cod*                    20          11         10          18             18         2
 Monkfish*                        18          28         43           7              6        13
 White hake                       18          55         58           8             19        15
 Smooth skate                     15          17         11           8             11         1
 Black dogfish                    13          7          17          24              1        91
*Species landed in the Greenland halibut fishery.

RESOURCE ASSESSMENT
Sources of information
This assessment is based on the analysis of commercial fishery and scientific research survey
data. The fishery data come from four sources: purchase slips, landings weighted at dockside,
logbooks and commercial catch sampling. Catch sampling is undertaken by two separate
programs; the at-sea observer program and the DFO port sampling program. Two research
surveys, independent of the commercial fishery, are conducted annually in the nGSL. The first
in July by the mobile sentinel fisheries program (MSP 1995-2020) and the second in August by
DFO (nGSL 1990-2020). A third survey conducted by DFO in September in the southern Gulf of
St. Lawrence (sGSL, 1971-2020) was also considered. These three surveys are conducted
using bottom trawls according to a stratified random sampling design.

Commercial fishery fishing effort and catches
Close to 99% of Greenland halibut landings are from the gillnet fishery directed at this species.
The fishing effort is deployed in three main sectors (Figure 5). The Western Gulf and Esquiman
sectors are frequented annually while the North Anticosti sector has sporadic use (Figures 5
and 6). In years when the North Anticosti sector is not frequented, the fishing effort shifts mainly
in the Western Gulf sector. In 2020, the proportion of effort deployed in the Western Gulf, North
Anticosti and Esquiman was 68%, 11%, and 20% respectively. These proportions are quite
similar to the averages for the period 1999-2019, which were 67%, 6% and 25% respectively for
the same sectors.

                                                    8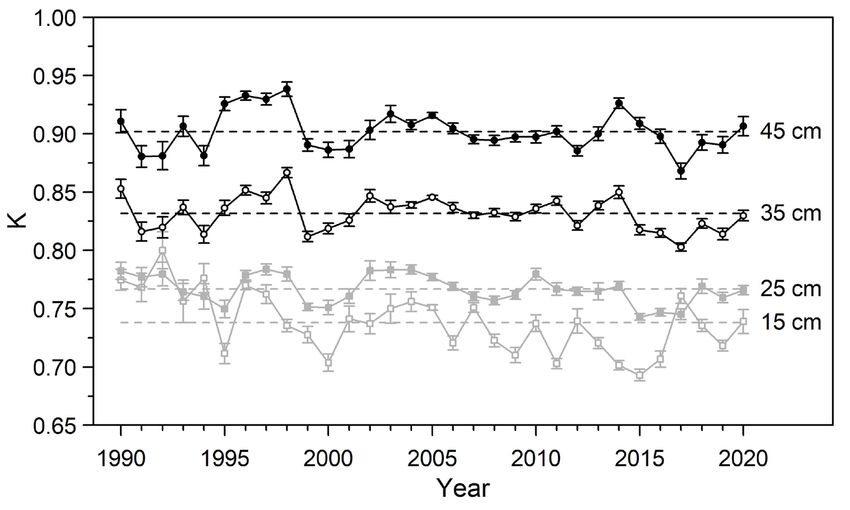
Assessment of the gulf of St. Lawrence
 Quebec Region                                               (4RST) Greenland halibut stock in 2020

                         North Anticosti

Figure 5. Distribution of fishing effort (number of gillnets) by fishing statistical square for 2019 and 2020.
Effort data are available for more than 95% of landings in the Western Gulf and North Anticosti sectors.
For the Esquiman sector, effort data are available for more than 80% of landings in 2019 and nearly 45%
in 2020.

For the entire Gulf (4RST) and for the Western Gulf and Esquiman sectors, fishing effort and
landings decreased between 2019 and 2020 (Figure 6). These are among the lowest landings
and efforts values in each series.
The situation is different for the North Anticosti sector which, after being deserted from 2015 to
2017, experienced an increase of fishing activities from 2018 to 2020. The effort remained fairly
stable between 2019 and 2020 while landings increased and totaled 232 t for a fishing effort of
more than 11,000 nets (Figure 6).

Figure 6. Landings (t) and fishing effort (number of gillnets) for the Gulf (4RST) and by fishing sectors.

Commercial fishery performance index
The annual commercial catch rate (catch per unit effort, CPUE) is used as an indicator of the
performance of the fishery and not as an index of abundance of the exploitable stock. This index

                                                      9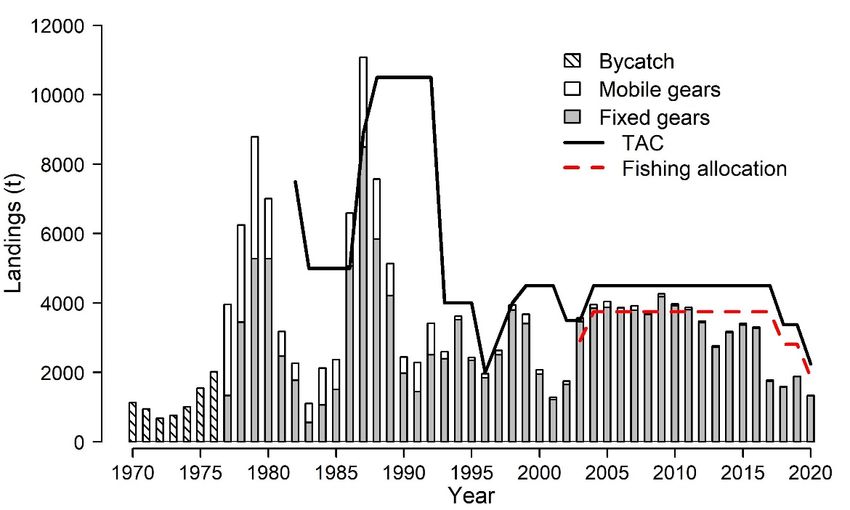
Assessment of the gulf of St. Lawrence
 Quebec Region                                             (4RST) Greenland halibut stock in 2020

is standardized to take into account the variability that could be attributable to various factors
such as the duration of the immersion of the gear, changes in fishing area and the seasonal
fishing pattern. This standardization allows to identify annual trends in catch rates.
In 2020, for the entire Gulf (4RST) and for the three fishing sectors, the fishery performance
indices are below each series average (Figure 7).
The trajectory of the indices is similar for the Gulf and the Western Gulf sector. The indices
showed a decrease of more than 50% between 2015 and 2018 and fell below the series
average in 2017. In 2019 and 2020, the indices are stable.
In the North Anticosti and Esquiman sectors, the fishing performance indices decreased by
more than 75% between 2012 and 2017 and have been below their series average since 2013.
Between 2019 and 2020, the index increase in North Anticosti and is stable in Esquiman.

Figure 7. Commercial fishery performance indices (standardized CPUE) for the GSL (4RST) and by
fishing sector. Error bars indicate the 95% confidence interval. The horizontal lines represent each series
average.

Length composition of fish in commercial fishery catches
The average size of Greenland halibut caught in the commercial fishery increased steadily from
2002 to 2012, from 44.8 cm to 48.8 cm (Figure 8). This increase is explained, among other
things, by the growth of the strong 1997 and 1999 cohorts which made up a large part of the
catches. Between 2012 and 2018, the average size fluctuated and was above or at the level of
the series average. Data for 2020 were partial due to health measures related to the pandemic.
In 2019, the average sizes of male and female fish decreased and were among the lowest since
1996. The average size of males was 41 cm, almost 3 cm lower than the series average and
below the series minimum size of 44 cm. The average size of females was 46.0 cm, almost
2 cm less than the series average. The average size of fish landed for the sexes combined is

                                                    10
Assessment of the gulf of St. Lawrence
Quebec Region (4RST) Greenland halibut stock in 2020
45.3 cm, below the average of 47.1 cm. The decrease in the average size of fish has a
significant impact on the number of fish landed for a given landing counted by weight. Between
2017 and 2020, annual landings in tonnes decreased by 16% while the number of fish landed
decreased by only 9%.
From 1996 to 2018, 17% of the fish landed were smaller than the minimum size of 44 cm. In
2019 this percentage increased to 30%.
Figure 8. Average size of Greenland halibut landed in the commercial fishery by sex. The horizontal lines
indicate the 1996-2020 average for each series. The regulatory mesh size in the commercial fishery
increased from 140 to 152 mm (5.5 to 6 inches) in 1996. The dotted horizontal line across the graph
indicates the minimum size of 44 cm. Due to the health measures linked to the pandemic, the data for
2020 were partial.
Biological data
Size at sexual maturity
The size at which 50% of Greenland halibut are mature (L50) decreased significantly between
1997 and 2001 for males and between 1998 and 2004 for females(Figure 9). It remained
relatively stable at the average level from 2004 to 2014 for both sexes. Subsequently, the L50
generally decreased to reach the lowest values of the series in 2019 and 2020. In 2020, the L50
is estimated at 37 cm in females (series average 45 cm) and 31 cm in males (series average
36 cm). Growth in Greenland halibut decreases after reaching sexual maturity. Since the L50 is
declining, there will likely be fewer large fish in this stock in the coming years. In addition, since
females display a higher L50, they attain larger size than males. This characteristic combined
with the selectivity of 152 mm gillnets results in a higher proportion of females in the commercial
catches. In 2018 and 2019, females made up 85% of commercial catches, which is above the
average of 80% for the 1996-2019 series.
11Assessment of the gulf of St. Lawrence
Quebec Region (4RST) Greenland halibut stock in 2020
Figure 9. Size at which 50% of Greenland halibut caught during the nGSL DFO research survey were
sexually mature (L50). The horizontal lines indicate the average of each series.
Demographic structure and recruitment
The general pattern of the demographic structure of Greenland halibut caught during the nGSL
and MSP surveys is similar, but differences in trawl selectivity and the area sampled produce a
better representation of smaller fish in the nGSL survey, while the larger ones are better
represented in the MSP survey (Figure 10).
The abundance of the different year classes, their growth and the prevailing environmental
conditions influence the abundance of the stock and are directly related to the future success of
the fishery. Based on their normal growth curve, Greenland halibut generally recruit to the
fishery at a size of 44 cm at an average age of 6 years for females and 7 years for males.
The strength of the new cohorts is estimated by the annual abundance of fish of the size class
≥ 12 and ≤ 21 cm captured during the DFO nGSL survey, which represent 1-year-old fish
(Figures 10 and 11). Since the late 1990s, this stock has produced alternately high and low
abundance cohorts without showing a clear stock-recruitment relationship. The first strong
cohorts observed, those of 1997, 1999, 2001 and 2002 led to a significant increase in the
abundance of the stock and supported the fishery until the early 2010s (Figures 10 and 11).
Subsequently, the 2010 cohort generated a significant biomass of individuals > 40 cm in 2014,
increasing the catch rates of the commercial fishery from 2014 to 2016. The recruitment of the
2010 cohort to the fishery generated a decrease in fish size in commercial catches in 2014
(Figure 8).
In the history of the stock, the recent 2013 cohort appeared to be the most abundant in the
series (Figure 11). It was preceded by a high abundance cohort (2012) and followed by a
medium abundance cohort (2014). It would have been expected that these cohorts would
generate a significant increase in the abundance of the stock as observed in the early 2000s.
Instead, a decrease of about 45% in the growth rate of the 2013 cohort between one and two
years was observed. This was the first time in over 25 years that such a decrease in growth had
been observed. Since then, the abundance of these cohorts has declined significantly. They
could have started to recruit to the fishery in 2019-2020, which could in part explain the
significant decrease in the average size of fish in commercial catches (Figure 8).
12Assessment of the gulf of St. Lawrence
Quebec Region (4RST) Greenland halibut stock in 2020
Although the 2017 cohort had above-average abundance at one year (Figure 11), its abundance
decreased significantly at 2 years and in 2020 it is below average (Figure 10). The 2018 cohort
seems particularly interesting since it is of high abundance at one and two years and it displays
a normal growth rate for this stock (modal size of 16 cm at one year in 2019 and 26 cm at two
years in 2020, Figure 10). The condition index for fish in this cohort was below average at 1-
year-old (15 cm in 2019) and increased to the average for 2-year-old fish (25 cm in 2020, Figure
12) .This cohort could start recruiting to the fishery in 2024.
The length frequency distribution of the MSP survey also indicates that the abundance of fish
larger than 40 cm has declined since 2009 and has been low since 2016 (Figure 10).
Figure 10. Greenland halibut length frequency distributions observed during the nGSL (1990-2020) and
the MSP (1995-2020) scientific surveys. The size of the bubbles is proportional to the abundance in a
given survey. The horizontal blue dotted lines show the average size expected for one and two-year-old
fish. The black dotted horizontal lines delimit the size class > 40 cm and the solid black lines indicate the
minimal size of 44 cm.
Condition
The Fulton condition index (K = weight (g) / length3 (cm)) is estimated for four sizes of
Greenland halibut: 15 cm (~ 1 year); 25 cm (~ 2 years); 35 cm (3 to 5 years) and 45 cm
(≥ 6 years) (Figure 12). The condition of 1-year-old fish fluctuated from 1990 to 2018, often
varying inversely to the abundance of different cohorts. Thus, the abundant 1999 and 2010
cohort at 1 year (15 cm) in 2000 and 2011 had a Fulton index below the series average.
Recently, this stock experienced three consecutive years of medium to high abundance cohorts,
13Assessment of the gulf of St. Lawrence
Quebec Region (4RST) Greenland halibut stock in 2020
2012 to 2014 (Figure 11) which had Fulton indices below the average of the 15 cm series
(2013-2015) (Figure 12). Fish from these cohorts maintained low condition indices (series
25 cm, 35 cm and 45 cm from 2015 to 2017). Another factor that could have affected the
condition of the recent cohorts of Greenland halibut is a possible competition for food and
habitat with the massive arrival of juvenile redfish in the GSL between 2011 and 2013. The
condition index estimated for all sizes of Greenland halibut increased to the average level in
2020.
Figure 11. Recruitment index (number / tow) of Greenland halibut estimated by annual abundance of
12- 21 cm fish (age 1) from the DFO nGSL survey. The dotted horizontal line represents the series mean.
Figure 12. Annual Fulton (K) condition indices estimated for 15, 25, 35 and 45 cm Greenland halibut
captured during the nGSL survey. Error bars indicate the 95% confidence interval. The horizontal lines
represent the average of each series.
Stock status indicators
The series of abundance and biomass indices of Greenland halibut from the sGSL, nGSL and
PSM surveys show quite similar trends, with a significant increase until the mid-2000s, a period
of stability, then a trend generally declining from the late 2000s to 2019. The indices increased
14Assessment of the gulf of St. Lawrence
Quebec Region (4RST) Greenland halibut stock in 2020
slightly in 2020 (Figure 13). This increase is partly attributable to the arrival of the strong 2018
cohort (Figures 10 and 11).
Figure 13. Greenland halibut abundance (mean number per tow) and biomass (mean weight per tow)
indices observed during the scientific surveys of the sGSL (top), the nGSL (middle) and the MSP
(bottow). Error bars indicate the 95% confidence interval. The dotted lines represent the average of each
series.
Trends in abundance indices (mean number per tow) of Greenland Halibut from nGSL and PSM
surveys varied across size classes and may have diverged between surveys (Figure 14). In the
nGSL survey, indices for the 0-20 and 20-30 cm size classes increased significantly in the late
1990s and then fluctuated around the mean. There is a good correlation between the
abundance of 0-20 cm fish (~ 1 year) and 20-30 cm (~ 2 years) the following year. Between
2019 and 2020, the abundance of 0-20 cm fish declined below the series average. The PSM
survey is not very informative for this size class given the selectivity of the trawl and the area
covered by the survey.
The abundance trends for the 20-30 cm size class were generally similar for the two surveys
although at different scales. The trend is increasing in 2019 and 2020.
For larger fish, abundance indices from both surveys increased until the early (30-40 cm fish) or
mid-2000s (fish > 40 cm), and then trended downward. The indices of 30-40 cm increased
15Assessment of the gulf of St. Lawrence
Quebec Region (4RST) Greenland halibut stock in 2020
slightly from 2019 to 2020. For the size class > 40 cm, we observe a stabilization of the indices
of abundance below the average of the series from 2017 to 2020. According to the estimates of
typical growth for individuals of this stock, fish from the abundant cohorts of 2012, 2013 and
2014 would normally have reached a respective modal size of around 49, 47 and 44 cm in
2020. An increase in the abundance of fish > 40 cm was expected, but did not materialize
(Figure 14). These abundant cohorts of juveniles did not lead to subsequent increases in the
abundance indices of the larger fish.
Figure 14. Abundance indices (mean number per tow, NUE) for Greenland halibut of different size
categories observed in the nGSL (left) and the MSP (right) surveys. Error bars indicate the 95%
confidence interval. Horizontal lines indicate the 1990-2019 average of each series.
New series of indices combining scientific surveys of nGSL and sGSL (1984-2020)
Recent re-analyzes of data from comparative fishing experiments undertaken in 1990 in the
nGSL made it possible to reconstruct the series of surveys up to 1984 and combine it with the
series of sGSL. The increase in spatial coverage over a longer period allows a new
interpretation of the distribution of the GSL Greenland Halibut stock. In the late 1980s, when
abundance was low, Greenland halibut were mostly concentrated in the St. Lawrence Estuary
(Figure 3). As abundance increased in the 1990s, densities expanded eastward along the
Laurentian Channel and at the head of the Anticosti and Esquiman channels, as well as in
16Assessment of the gulf of St. Lawrence
Quebec Region (4RST) Greenland halibut stock in 2020
Chaleur Bay and in the Cape Breton trough. The recent decline in abundance has resulted in a
more marked decrease in stock density in the eastern part of its range. Overall, this pattern is
consistent with the extension and contraction of the geographic range as a function of density,
with the St. Lawrence Estuary being the core of this distribution.
Figure 15. Abundance (mean number per tow, left) and biomass (mean weight per tow, right) indices for
Greenland halibut in the combined series of nGSL and sGSL surveys, 1984-2020. Error bars indicate the
95% confidence interval.
Greenland Halibut Stock Productivity Outlook in the Context of Climate Change
An empirical model suggests that the surplus production of the Greenland halibut stock declines
with increasing deep water temperature. This general relationship suggests that with the
increased warming of deep waters observed since 2010, a decline in the productivity of the
stock is expected. The climate forecast for the GSL shows that significant levels of warming can
be expected in surface and deep waters over the next 10 to 20 years. Several observations
indicate conditions which are not currently favorable for the productivity of Greenland halibut: (1)
sharp increases in deep water temperature, (2) decreases in oxygen saturation of deep water,
(3) increase in redfish as competitors and (4) decline in northern shrimp as prey. Although the
general predictions of the empirical model have a large amount of uncertainty which makes the
specifics of the prediction somewhat uncertain, the general trajectory is robust. Factors known
to negatively impact Greenland halibut have strengthened and will continue to do so, adding
some weight to the evidence suggesting that the productivity outlook for this stock is not
encouraging. Fisheries management strategies and short, medium and long term stock
objectives should take this into account.
Relative exploitation rate indicator
An indicator of relative annual exploitation rate was obtained by dividing the weight of the
landings by the biomass of fish > 40 cm estimated by the nGSL scientific survey. The method
does not allow to estimate an absolute exploitation rate, nor to relate it to target exploitation
rates. However, it tracks changes over time and between fishing areas.
In 2020, the relative exploitation rate for the entire Gulf (4RST) was 5.9% below the series
average of 6.5% for the 1996-2020 period (Figure 16). The average exploitation rate was 4.8%
for the period 2001-2008, a period when the stock increased and remained abundant. The
17Assessment of the gulf of St. Lawrence
Quebec Region (4RST) Greenland halibut stock in 2020
period from 2009 to 2020, characterized by a near-average exploitation rate, corresponded to a
period of fairly constant decline in the biomass of fish > 40 cm (Figure 16). This could indicate
that the exploitation rates of the last ten years were too high.
In the Western Gulf sector, the exploitation rate indicator was increasing between 2012 and
2017, then it hovered around the series average. Following a decrease in landings and a rather
stable level of biomass, the exploitation rate for this sector decreased in 2020 to be 5.7% below
the series average of 7.5%. For the North Anticosti and Esquiman sectors, exploitation rates are
increasing from 2017 to 2020 and are well above the average of their respective series. For the
North Anticosti sector, the exploitation rate for 2020 was the second highest in the series. For
the Esquiman sector, this is the highest exploitation rate since 1996 and the lowest fish
biomass > 40 cm estimated by the nGSL survey.
Precautionary approach and reference points
A precautionary approach is being developed for the GSL Greenland halibut stock. The
indicator selected for monitoring stock status is fish biomass > 40 cm estimated from the nGSL
survey. This indicator corresponds to the longest time series available (1990-2020) and
represents an approximation of the spawning stock biomass.
The limit reference point (LRP) adopted is the geometric mean of the indicator during the period
1990 to 1994, which corresponds to the period when the population was at its lowest level and
from which a recovery of the stock was observed. This LRP was evaluated at 10,000 t (Figure
17).
A first upper stock reference point (USR) was proposed as early as 2018 (DFO 2019). This USR
was based on the concept of stable biomass during the 2004-2012 productive period. The high
productivity of the stock during this period was largely attributable to the excellent recruitment
produced in the late 1990s.
The stock status indicator has been decreasing since the end of the 2000s with a more rapid
decline between 2014 and 2016. This period of strong decline would be linked to a decline in
the productivity of the stock possibly due to rapid changes in the deep waters of the GSL. These
unfavorable changes for the Greenland halibut include an increase in the temperature of the
deep water, a decrease in the level of dissolved oxygen and the massive influx of redfish which
are potential competitors.
Recent work showing the long-term impacts of these climate changes on the productivity of the
stock has suggested that a USR based on the biomass during the period of high productivity
2004-2012 may no longer be achievable even without fishing. Another USR proposal was made
on the basis of the biomass from the 1996-2002 productivity period which was not the result of a
single unusually large recruitment event and which could be considered more realistic.
However, since the GSL environment is currently changing rapidly, it is not easy to determine
which USR is most appropriate for this stock.
Under these conditions, a USR proposal was made to take into account the significant
ecosystem changes occurring in the GSL as well as the decrease in stock productivity. This new
USR is based on both productivity period, the 1996-2002 and the 2004-2012. In this proposal,
the biomass at the maximum sustainable yield (Bmsy) represents the average of the biomasses
of these two periods, i.e. 47,170 t, and the USR corresponds to 80% of this Bmsy, i.e. 37,740 t.
18Assessment of the gulf of St. Lawrence
Quebec Region (4RST) Greenland halibut stock in 2020
Figure 16. Landings, fish biomass > 40 cm, and relative exploitation rate for the GSL (4RST) and by
fishing sector. The dotted lines represent the average exploitation rate for each series.
19Assessment of the gulf of St. Lawrence
Quebec Region (4RST) Greenland halibut stock in 2020
The development of this precautionary approach is based on the best data currently available.
The proposed points (Bmsy, LRP and USR) will have to be re-evaluated with the acquisition of
new data which may allow to changed them for more appropriate values.
A working group, made up of representatives of the fixed gear fleets, the provincial governments
of Quebec and Newfoundland and Labrador, as well as Indigenous groups, was created in the
fall of 2018 to participate in the development of a proposal of the precautionary approach. Three
workshops have been held with this group since its formation, and at the last workshop in
February 2020, the group accepted the USR proposal at 37,740 t. The current framework of the
precautionary approach of the GSL Greenland halibut stock is defined by a 10,000 t LRP
delimiting the critical zone from the cautious zone and a 37,740 t USR delimiting the cautious
zone from the healthy zone. Defining harvest control rules remain difficult due to the current
state of the stock.
The stock status indicator was on a downtrend with a decrease of over 60% between 2008 and
2017 moving from the healthy zone to the cautious zone. The indicator is rather stable from
2017 to 2020 and is in the cautious zone, halfway between the LRP and the USR.
Figure 17. Annual biomass indicator for Greenland halibut > 40 cm from the nGSL survey. The red
horizontal line at the bottom indicates the limit reference point (LRP) as part of the precautionary
approach. The LRP is the boundary between the critical and cautious zones. The green horizontal line at
the top indicates the upper stock reference (USR). The USR is the boundary between the cautious and
healthy zones. Error bars indicate the 95% confidence interval. The dotted black line indicates the proxy
for biomass at maximum sustainable yield (Bmsy).
Assessment schedule and trigger for a full assessment during an interim year
The GSL Greenland halibut stock is currently assessed and managed on a two-year cycle. In
the interim years, an update of key resource indicators is prepared to provide fisheries
management with an overview of the most recent stock status. The indicators used to monitor
the status of the stock are landings and abundance indices from the nGSL DFO survey. The
element that could trigger a re-assessment is a decrease of more than 30% in the biomass
index of fish > 40 cm when this biomass is in the cautious or critical zone defined according to
the precautionary approach.
20Assessment of the gulf of St. Lawrence
Quebec Region (4RST) Greenland halibut stock in 2020
Sources of Uncertainty
The length at which 50% of Greenland halibut are mature is determined through a visual
inspection of gonads during the DFO research survey in August. Since spawning occurs in
winter, the timing of the survey is not ideal for this type of work. A detailed histological study is in
progress and should allow a more precise determination of the L50 of both sexes for this
species.
Greenland halibut make significant daily vertical migrations and may spend more than 25% of
their time in the water column. The effect of water temperature and DO level on the duration and
frequency of these vertical movements is unknown. The annual proportion of fish that may be
found outside the volume swept by the trawl in scientific surveys in response to ecosystem
changes is unknown. The varying availability of fish in these surveys would have implications for
catchability and abundance estimates.
Age determination of GSL Greenland Halibut by reading otoliths is not currently possible. Thus,
length-based population dynamics models have been investigated. However, recent variations
in the growth rate of the species have delayed the development of such models. The
development of a population dynamics model would be an asset for monitoring the status of this
stock.
At the time of writing this Science Advisory Report, 2020 data from the at-sea observer program
were not available for the west coast of Newfoundland (NAFO Division 4R). The size structure
of Greenland Halibut landed in 4R in 2020 was produced using data from Division 4S.
CONCLUSIONS AND ADVICE
The outlook for the Greenland halibut stock in the GSL is of concern given the observed
ecosystem changes and the decreasing indices of abundance and biomass of fish > 40 cm.
These indices have stabilized over the past four years.
From 2019 to 2020, commercial fishing performance indices were stable for the Western Gulf
and Esquiman sectors and increasing in the North Anticosti sector. The indices of the three
sectors are below the average of their respective series.
The cohorts (2014, 2015 and 2016) that are expected to recruit and contribute to the fishery in
2021 and 2022 are of average to low abundance. The recent abundant cohort of 2018 looks
promising and is currently showing a normal growth rate. She is expected to start recruiting for
the fishery in 2024.
The GSL Greenland Halibut exploitation rate indicator declined from 2019 to 2020 and remained
near the series average. This indicator is decreasing in the Western Gulf sector and increasing
strongly in the North Anticosti and Esquiman sectors.
The stock status indicator (fish biomass > 40 cm) showed a downward trajectory with a
decrease of more than 60% between 2008 and 2017 from the healthy zone to the cautious
zone. The indicator is rather stable from 2017 to 2020 and is in the caution zone halfway
between the PRL and the PRS.
According to the decision-making framework for fisheries incorporating the precautionary
approach, when a stock is in the cautious zone and its recent trajectory is stable, management
actions should promote stock growth in the short term. Since the current status of the GSL
Greenland halibut stock meets these conditions, in accordance with this framework, a reduction
in catches below recent levels could reduce the exploitation rate and promote an increase in the
21Assessment of the gulf of St. Lawrence
Quebec Region (4RST) Greenland halibut stock in 2020
stock. However, the unfavorable environmental conditions for Greenland halibut prevalent in the
GSL could be determining factors in the trajectory of the stock.
Other considerations
In the GSL, the area occupied by redfish and Greenland halibut has a large area of overlap. The
upcoming reopening of the commercial redfish fishery will result in a significant increase in
fishing effort that could increase Greenland halibut bycatch. The effectiveness of fishing zone
closures and the selectivity of redfish fishing gear should be assessed in order to minimize
Greenland halibut bycatch.
LIST OF MEETING PARTICIPANTS
Name Affiliation February February
23 24
Bélanger, Michel MAPAQ x x
Benoit, Hugues DFO – Science x x
Bermingham, Tom DFO – Science x x
Bernier, Denis DFO – Science x x
Bois, Samantha ACPG x
Boucher, Jean-René RPPNG/OPFGQ x x
Boudreau, Mathieu DFO – Science x
Bourdages, Hugo DFO – Science x x
Bourbonnière, Jean-Patrick DFO – Science x
Brassard, Claude DFO – Science x x
Chabot, Denis DFO – Science x
Chamberland, Jean-Martin DFO – Science x x
Chlebak, Ryan DFO – Science Ottawa x x
Cyr, Charley DFO – Science x x
Denis, Marcel ACPG x x
Desgagnés, Mathieu DFO – Science x
Dobbin, Shannon Fisher x x
Dubé, Sonia DFO – Science x x
Dubé, Frank Fisher x
Dugas, Franky Fisher x x
Duplisea, Daniel DFO – Science x x
Dupuis, Mario RPPNG x x
Dwyer, Shelley DFO – Fisheries Management NL x x
Gauthier, Johanne DFO – Science x x
Hardy, Magaly DFO – Fisheries Management Quebec x x
Hébert, Denyse DFO – Fisheries Management Quebec x x
Karbowski, Chelsey Oceans North Canada x x
Isabel, Laurie DFO – Science x x
Langelier, Serge AMIK x x
Lapierre, Daniel DFO – Fisheries Management Gulf x x
Lussier, Jean-François DFO – Science x
Marquis, Marie-Claude DFO – Science x x
Martin, Lucas ISMER/UQAR x x
Méthot, Chantal DFO – Science x
Nicolas, Pierre OPFGQ x x
Ouellette-Plante, Jordan DFO – Science x x
Parent, Geneviève DFO – Science x x
22Assessment of the gulf of St. Lawrence
Quebec Region (4RST) Greenland halibut stock in 2020
Name Affiliation February February
23 24
Pond, Nancy DFO – Fisheries Management NL x x
Pomerleau, Corinne DFO – Science x
Plourde, Stéphane DFO – Science x
Roux, Marie-Julie DFO – Science x x
Sandt-Duguay, Emmanuel AGHAMM x
Senay, Caroline DFO – Science x x
Simard, Émilie DFO – Science x x
Spingle, Jason FFAW/UniFor x x
Tilley, Anna Province of NL x x
Tremblay, Yan UAPAN x
SOURCES OF INFORMATION
This Science Advisory Report is from the regional advisory meeting of February 23-24, 2021 on
the Assessment of the Gulf of St. Lawrence (4RST) Greenland halibut. Additional publications
from this meeting will be posted on the Fisheries and Oceans Canada (DFO) Science Advisory
Schedule as they become available.
Blais, M., Galbraith, P.S., Plourde, S., Devine, L., and Lehoux, C. 2021. Chemical and Biological
Oceanographic Conditions in the Estuary and Gulf of St. Lawrence during 2019. DFO
Can. Sci. Advis. Sec. Res. Doc. 2021/002. iv + 66 p.
Bourdages, H., Marquis, M.C., Ouellette-Plante, J., Chabot, D., Galbraith, P., and Isabel, L.
2020. Assessment of northern shrimp stocks in the Estuary and Gulf of St. Lawrence in
2019: commercial fishery and research survey data. DFO Can. Sci. Advis. Sec. Res. Doc.
2020/012. xiii + 155 p.
DFO. 2018. Assessment of Greenland Halibut in the Gulf of St. Lawrence (4RST) in 2017. DFO
Can. Sci. Advis. Sec. Sci. Advis. Rep. 2018/035.
DFO. 2020. Update of stock status indicators for Greenland Halibut in the Gulf of St. Lawrence
(4RST) in 2019. DFO Can. Sci. Advis. Sec. Sci. Resp. 2020/005.
Duplisea, D. E., Roux, M.-J., Hunter, K. L., and Rice, J. 2021. Fish harvesting advice under
climate change: A risk-equivalent empirical approach. PLoS ONE 16(2): e0239503.
Dupont-Prinet, A., Vagner, M., Chabot, D., and Audet, C. 2013. Impact of hypoxia on the
metabolism of Greenland Halibut (Reinhardtius hippoglossoides). Can. J. Fish. Aquat. Sci.
70: 461–469.
Galbraith, P.S., Chassé, J., Shaw, J.-L., Dumas, J., Caverhill, C., Lefaivre, D., and Lafleur, C.
2020. Physical Oceanographic Conditions in the Gulf of St. Lawrence during 2019. DFO
Can. Sci. Advis. Sec. Res. Doc. 2020/030. iv + 84 p.
Gauthier, J., Marquis, M.-C., Bourdages, H., Ouellette-Plante, J. and Nozères, C. 2020. Gulf of
St. Lawrence (4RST) Greenland Halibut Stock Status in 2018: Commercial Fishery and
Research Survey Data. DFO Can. Sci. Advis. Sec. Res. Doc. 2020/016. v + 127 p.
Ghinter, L., Lambert, Y., and Audet, C. 2021. Juvenile Greenland halibut (Reinhardtius
hippoglossoides) growth in the context of rising temperature in the Estuary and Gulf of
St. Lawrence. Fish. Res. 233.
23Assessment of the gulf of St. Lawrence
Quebec Region (4RST) Greenland halibut stock in 2020
Lavoie, D., Lambert, N., Rousseau, S., Dumas, J., Chassé, J., Long, Z., Perrie, W., Starr, M.,
Brickman, D., and Azetsu-Scott, K. 2020. Projections of future physical and biochemical
conditions in the Gulf of St. Lawrence, on the Scotian Shelf and in the Gulf of Maine using
a regional climate model. Can. Tech. Rep. Hydrogr. Ocean Sci. 334: xiii + 102 p.
Senay, C., Ouellette-Plante, J., Bourdages, H., Bermingham, T., Gauthier, J., Parent, G.,
Chabot, D., and Duplisea, D. 2021. Unit 1 Redfish (Sebastes mentella and S. fasciatus)
stock status in 2019 and updated information on population structure, biology, ecology,
and current fishery closures. DFO Can. Sci. Advis. Sec. Res. Doc. 2021/015. xi + 119 p.
Stortini, C.H., Chabot, D. and Shackell, N.L. 2016. Marine species in ambient low-oxygen
regions subject to double jeopardy impacts of climate change. Global Change Biology. 23,
2284–2296.
Youcef, W. A., Lambert, Y. and Audet, C. 2015. Variations in length and growth of Greenland
Halibut juveniles in relation to environmental conditions. Fish. Res. 167, 38–47.
THIS REPORT IS AVAILABLE FROM THE:
Center for Science Advice (CSA)
Quebec Region
Fisheries and Oceans Canada
Maurice Lamontagne Institute
850 route de la Mer
P.O. Box 1000
Mont-Joli (Quebec)
Canada G5H 3Z4
Telephone: (418) 775-0825
E-Mail: bras@dfo-mpo.gc.ca
Internet address: www.dfo-mpo.gc.ca/csas-sccs/
ISSN 1919-5087
ISBN 978-0-660-38496-2 Cat. No. Fs70-6/2021-017E-PDF
© Her Majesty the Queen in Right of Canada, 2021
Correct Citation for this Publication:
DFO. 2021. Assessment of the Gulf of St. Lawrence (4RST) Greenland halibut stock in 2020.
DFO Can. Sci. Advis. Sec. Sci. Advis. Rep. 2021/017.
Aussi disponible en français :
MPO. 2021. Évaluation du stock de flétan du Groenland du golfe du Saint-Laurent (4RST) en
2020. Secr. can. de consult. sci. du MPO, Avis sci. 2021/017.
24You can also read


