Automatic measurement and characterization of the dynamic properties of tethered membrane wings
←
→
Page content transcription
If your browser does not render page correctly, please read the page content below
Wind Energ. Sci., 4, 41–55, 2019
https://doi.org/10.5194/wes-4-41-2019
© Author(s) 2019. This work is distributed under
the Creative Commons Attribution 4.0 License.

            Automatic measurement and characterization of the
             dynamic properties of tethered membrane wings
                                  Jan Hummel1 , Dietmar Göhlich1 , and Roland Schmehl2
        1 Methods   for Product Development and Mechatronics, Technische Universität Berlin, 10623 Berlin, Germany
             2 Faculty  of Aerospace Engineering, Delft University of Technology, 2629 HS Delft, the Netherlands
                                 Correspondence: Jan Hummel (jan.hummel@tu-berlin.de)

                                     Received: 17 July 2018 – Discussion started: 13 August 2018
                          Revised: 6 January 2019 – Accepted: 10 January 2019 – Published: 24 January 2019

       Abstract. We have developed a tow test setup for the reproducible measurement of the dynamic properties of
       different types of tethered membrane wings. The test procedure is based on repeatable automated maneuvers
       with the entire kite system under realistic conditions. By measuring line forces and line angles, we determine
       the aerodynamic coefficients and lift-to-drag ratio as functions of the length ratio between power and steering
       lines. This nondimensional parameter characterizes the angle of attack of the wing and is varied automatically
       by the control unit on the towed test bench. During each towing run, several test cycles are executed such that
       mean values can be determined and errors can be minimized. We can conclude from this study that an objective
       measurement of specific dynamic properties of highly flexible membrane wings is feasible. The presented tow
       test method is suitable for quantitatively assessing and comparing different wing designs. The method represents
       an essential milestone for the development and characterization of tethered membrane wings as well as for the
       validation and improvement of simulation models. On the basis of this work, more complex maneuvers and a full
       degree of automation can be implemented in subsequent work. It can also be used for aerodynamic parameter
       identification.

1   Introduction                                                    of how wing performance parameters, such as aerodynamic
                                                                    coefficients, lift-to-drag ratio, steering forces and moments,
With the turn of the millennium, kitesurfing has evolved            depend on the wing design.
into a mainstream water sport, followed by the more re-                The empirical design method is used because compared
cent variants of land and snow kiting (Tauber and Moroder,          to rigid wings the physics of flexible membrane wings are
2013). In terms of industrial applications, flexible membrane       complex and the existing knowledge is limited due to de-
wings have already been used since the 1970s as aerody-             forming under aerodynamic load and steering line actuation.
namic decelerators for airdrop systems and are currently            This holds particularly for leading edge inflatable (LEI) tube
being explored for airborne wind energy (AWE) genera-               kites (see Fig. 1) and other single-skin kite types, since ram
tion (Schmehl, 2018). Despite the advancements within the           air wings have already been investigated systematically for
kitesurfing and AWE industries, tethered membrane wings             several decades (Dunker, 2013, 2018; Johari et al., 2014).
are mostly still designed by iterative testing with empirical          Because of the high degree of flexibility and the low
and intuitive variation of wing parameters. Although this has       weight of the membrane structure, the flow around the wing
led to a relatively high degree of maturity on the product          and its shape are strongly coupled. A change in the flow field
level, the approach is time-consuming and expensive because         alters the aerodynamic load distribution to which the struc-
a large number of prototypes need to be manufactured and            ture rapidly adjusts by deformation, which in turn changes
tested. For this reason, we conclude that the empirical design      the flow field. The fluid–structure coupling causes defor-
method will only allow for limited further improvements and         mation phenomena at different length scales and timescales
that it is indispensable to develop a systematic understanding      (Leuthold, 2015). A typical large-scale phenomenon is the

Published by Copernicus Publications on behalf of the European Academy of Wind Energy e.V.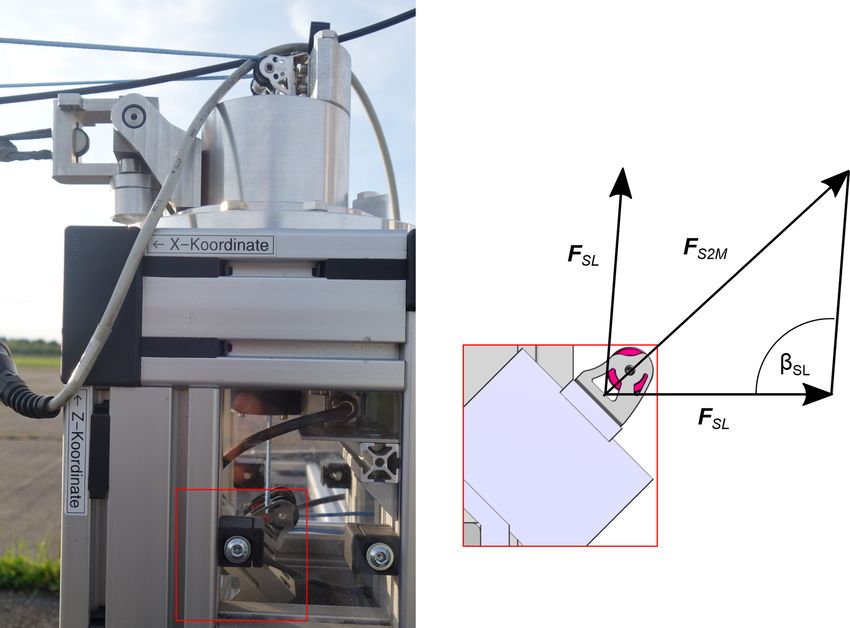
42                              J. Hummel et al.: Automatic measurement and characterization of tethered membrane wings

Figure 1. Leading edge inflatable (LEI) tube kite (a) and ram air wing (b).

spanwise bending and twisting of the entire wing due to                 scanning. This shape was then used as a static boundary
steering line actuation. The ability of the membrane wing to            condition for steady CFD analysis, with the aim of assess-
deform asymmetrically and thereby generate a substantially              ing the computational prediction quality without the added
increased turning moment makes it particularly suitable for             complexity of the deforming membrane structure. The study
AWE applications, which require excellent maneuverability               contributed important knowledge about ram air wings at the
(Breukels et al., 2013; Bosch et al., 2014; van Reijen, 2018;           lower end of the size range. In the same framework project,
Fechner and Schmehl, 2018). Typical small-scale phenom-                 Bungart (2009) performed a coupled CFD and finite-element
ena are the local flutter of the wing canopy or wrinkling,              analysis of a ram air wing section, deriving aerodynamic co-
which is caused by local compression loads that cannot be               efficients and a deformed shape for the entire range of angle
supported by the woven fabric material.                                 of attack. The analysis showed that the chambered design
   Another characteristic that distinguishes flexible mem-              (chambers are separated by ribs, top skin and bottom skin;
brane wings from rigid wings is that the entire airborne sys-           see Fig. 1) with upper and lower skin and the airfoil defined
tem, consisting of a wing, tensile support system and in some           by a small number of ribs (connecting top skin and bottom
cases also a suspended airborne control unit, is considerably           skin) leads to ballooning. A similar effect can be observed
larger for comparable traction force. This is due to the fact           with LEI tube kites, for which the canopy bulges out between
that a rigid wing can endure a much higher wing loading                 the struts (inflatable tube providing structure) and, similar to
than a membrane wing and that it uses aerodynamic control               the ribs, defines the design shape. It is obvious that these
surfaces with wing-integrated actuators that allow for a more           aeroelastic phenomena have to be taken into account by high-
compact design. For wind tunnel measurements large geome-               fidelity analyses. Subsequently, Breukels (2011) developed
tries are typically downscaled to fit into the test section of the      a multibody model and Bosch et al. (2014) a finite-element
tunnel. To ensure that the flow field is not affected by the scal-      model of the flexible wing, bridle line system (line system
ing, the principle of dynamic similarity has to be enforced             that supports the wing structure and merges these lines into
by maintaining a constant Reynolds number: Re = ρvc/µ. A                steering or power lines) and tether. In both approaches the
common method to compensate for a decreasing chord length               same correlation derived by parametric CFD analysis is used
c is to increase the flow velocity v. However, downscaling a            to evaluate the aerodynamic load distribution as a function of
tethered membrane wing for wind tunnel testing is problem-              angle of attack and wing deformation. While succeeding in
atic because due to aeroelasticity the aerodynamic character-           simulating complete flight maneuvers relevant for AWE, the
istics depend not only on the wing geometry but also on its             two studies did not include validations by wind tunnel exper-
deformation behavior. To account for this, the material prop-           iments. It can be concluded that validated aeroelastic models
erties of the wing and tether would have to be scaled accord-           of entire tethered membrane wings are neither available at
ingly, which is practically not feasible because the membrane           present nor sufficiently fast to be used in the design process
is a woven fabric material that is partially arranged as a mul-         for which rapid iterations are required.
tilayer composite with rigid reinforcements, and the tether is             For this reason, less complex simulation models have been
a braided and coated line (Bosman et al., 2013).                        developed, describing the whole kite system as a point mass,
   A wind tunnel study of a small but full-scale ram air wing           a cluster of point masses (Fechner et al., 2015) or a rigid body
was presented by de Wachter (2008). The wing with a pro-                (de Groot et al., 2011; Gohl and Luchsinger, 2013). These
jected area of 5.2 m2 was suspended upside down in the test             models do not explicitly describe the aeroelastic behavior
sections of two different large wind tunnels to determine the           of the wing and require as input the detailed aerodynamic
shape under aerodynamic load by photogrammetry and laser                properties of the kite system, including information about the

Wind Energ. Sci., 4, 41–55, 2019                                                                www.wind-energ-sci.net/4/41/2019/
J. Hummel et al.: Automatic measurement and characterization of tethered membrane wings 43
steering behavior. In this respect, Erhard and Strauch (2013a,
b), Fagiano et al. (2014), and Jehle and Schmehl (2014) have
proposed empirical turn rate laws relating the turn rate of the
wing to the steering input. The transition from a powered
state (high angle of attack) to depowered state (low angle of
attack) is covered by an empirical correlation (Fechner et al.,
2015). According to Fagiano and Marks (2015), such lower-
complexity models have already reached a quite mature state,
but new insights appear to be difficult without experimental
analysis.
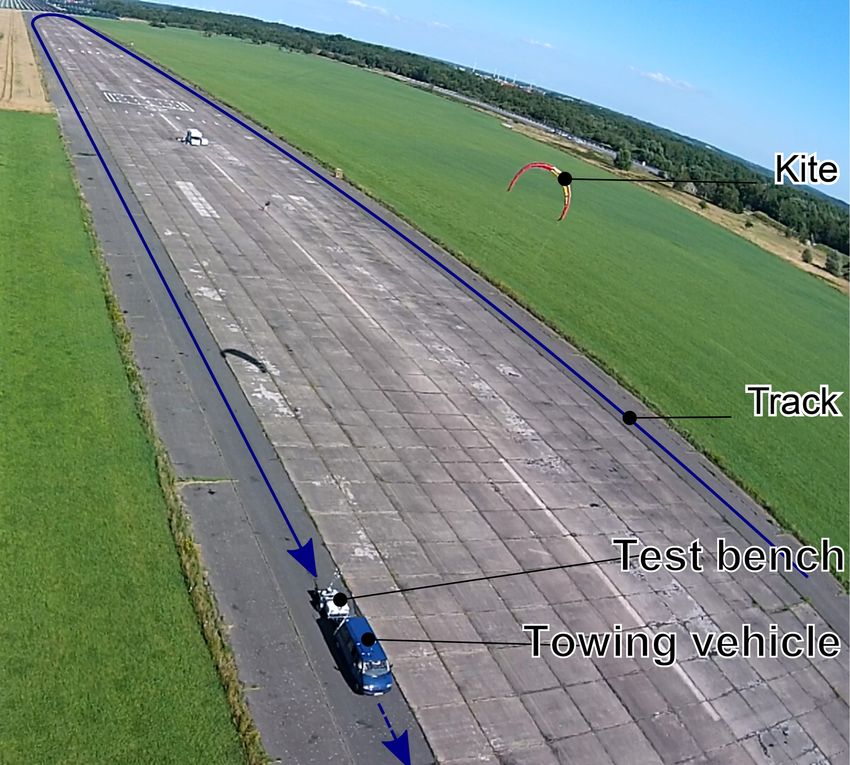
However, despite the strong need for reproducible exper-
imental data, only a few dedicated studies have been per-
formed so far. Stevenson (2003) developed a tow test method
to support the research and development of surf kites. The
constant relative airflow was generated by driving the tow-
ing vehicle along a beach section. The data acquisition sys- Figure 2. Schematic side view of the tow test with the wing in
tem recorded the lift-to-drag ratio as well as the lift coeffi- steady-state equilibrium and effect of gravity neglected, i.e., mg =
cient both as functions of the ratio of the sum of steering 0, with F R + F A = 0 and F R = F PL + F SL,l + F SL,r .
line forces to total tensile force. Inspired by a method de-
scribed by Stevenson et al. (2005), a simple stationary test
setup for the beach was used by van der Vlugt (2010) to de-
termine the lift-to-drag ratio of surf kites from the achievable
flight speed when performing crosswind sweeps close to the
ground. Dadd et al. (2010) described a tow test with the mea-
surement rig mounted on a trailer such that it could be used
for stationary and tow testing. A tow test experiment for the
characterization of kites used as part of an AWE system was
described by Costa (2011). Next to the movement of the kite
and the line forces, the deformation was also measured us-
ing an image correlation system. Within the same framework
project, Wood et al. (2017) presented a control strategy for
flying figure-eight crosswind maneuvers during tow tests.
In none of the outlined test procedures was the manual
control input recorded. However, for systematic aerodynamic
parameter identification a recording of the steering inputs is
crucial (de Groot et al., 2011; Mulder et al., 1994). We started
the project TETA at TU Berlin with the aim of measuring the
dynamic properties of kites under reproducible conditions for
repeatable steering input (Hummel, 2017; Hummel and Göh- Figure 3. Forces acting in the power and steering lines.
lich, 2017). The developed test setup is suitable for the quan-
titative assessment of different types of tethered membrane
wings and can be used stationary or moving at variable ve- 2 Measurement concept
locity to simulate different wind speeds as well as to reduce
the influence of gusts. A schematic side view of the tow test is illustrated in Fig. 2,
This paper is organized as follows. Section 2 outlines the including the aerodynamic lift and drag force components
measurement concept and describes the detailed properties to F L and F D , respectively, as well as the aerodynamic force
be measured. In Sect. 3 the setup and design of the test bench F A.
is described, including the required sensor equipment. Sec- The resultant force acts in the center of pressure of the
tion 4 continues with a brief overview of the data acquisition wing. A steady towing state is reached when the wing is no
process. In Sect. 5 the experimental results are presented and longer moving relative to the towing vehicle. In this state, the
discussed. In the conclusions, future research and improve- aerodynamic and gravitational forces acting on the wing are
ments of the measurement concept and the implemented test balanced by the tensile forces F PL , F SL,l and F SL,r acting
bench are outlined. in the power and steering lines. Because flexible lines cannot
support bending loads these tensile forces are always aligned
with the lines, as illustrated in Fig. 3.
www.wind-energ-sci.net/4/41/2019/ Wind Energ. Sci., 4, 41–55, 2019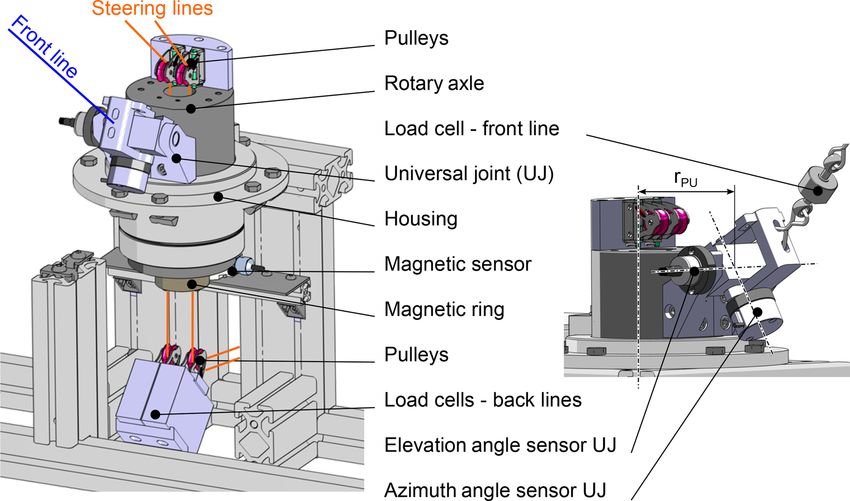
44                             J. Hummel et al.: Automatic measurement and characterization of tethered membrane wings

                                                                  same size and the same control bar settings were tested at the
                                                                  same wind speed, a relative comparison of the wings is still
                                                                  possible.

                                                                  2.1    Aerodynamic coefficients
                                                                  The aerodynamic coefficients are nondimensional parame-
                                                                  ters that describe the aerodynamic properties of a wing. For
                                                                  a steady towing situation as illustrated in Fig. 2 we can de-
                                                                  termine the lift, drag and resultant aerodynamic coefficients
                                                                  of the entire system as

                                                                        2FL      2 sin ϑFR
                                                                  CL =     2
                                                                               =           ,                                 (2)
                                                                       ρAv         ρAva2
                                                                        2FD      2 cos ϑFR
                                                                  CD =      2
                                                                               =            ,                                (3)
                                                                       ρAv          ρAva2
                                                                        2FR
                                                                  CR =        ,                                              (4)
                                                                       ρAva2

                                                                  where ρ is the air density, A the surface area of the wing and
Figure 4. Limiting states of the “linear power” maneuver.         va the apparent wind velocity. By definition the aerodynamic
                                                                  drag is aligned with the apparent wind velocity, and the aero-
                                                                  dynamic lift is perpendicular.
   The dashed line in Fig. 2 defines the tensile axis of the
                                                                     Based on the resultant aerodynamic force coefficient we
airborne system, which in the case of a negligible effect of
                                                                  can determine the depower capability of the wing. This pa-
gravity is aligned with the resultant force F R and inclined to
                                                                  rameter can be calculated as the relative difference of maxi-
the horizontal plane by the elevation angle ϑ.
                                                                  mum and minimum aerodynamic forces with
   As illustrated in Fig. 3, the power line is attached to the
towing point at the moving test rig. The flight behavior of the         CR,max − CR,min
wing is controlled by a bar that can slide along the power line   γ=                    ,                                    (5)
                                                                            CR,max
and attaches at its ends to the two steering lines. This setup
is commonly used for kitesurfing and allows for the individ-      thus evaluating the entire range 1 > up > 0. For ground-
ual actuation of the left and right steering lines and changing   generation AWE systems it is the traction force of the kite
the effective length of the power line. The effective length      that is converted into electricity (Schmehl et al., 2013). For
of the power line is defined as the distance between the kite     this variant of the technology, the kite is generally operated
attachment point and the control bar. For the “linear power”      in consecutive pumping cycles and for maximizing the en-
maneuver the control bar is automatically retracted along the     ergy output, the resultant force coefficient CR has to be max-
power line. During this maneuver the effective length lPL of      imized during the traction phases and minimized during the
the power line changes from lPL,0 for the depowered state to      retraction phases. For a flexible membrane wing, a good de-
lPL,1 for the powered state, as illustrated in Fig. 4.            power capability and flight stability are two conflicting de-
   Accordingly we define the relative power setting               sign drivers (van der Vlugt et al., 2013).
        lPL − lPL,0
up =                 ,                                      (1)   2.2    Aerodynamic efficiency
       lPL,1 − lPL,0
                                                                  The aerodynamic efficiency of a wing can be expressed as
which varies between up = 0 for the depowered state and
                                                                  the ratio between the aerodynamic lift and drag force com-
up = 1 for the powered state. A similar nondimensional vari-
                                                                  ponents. For a steady towing situation as illustrated in Fig. 2
able, the relative depower setting ud = 1−up , was introduced
                                                                  the lift-to-drag ratio can be calculated from the elevation an-
by Fechner et al. (2015) to quantify the actuation of an air-
                                                                  gle ϑ as
borne control unit suspended below the wing.
   In the following we describe the wing properties that are      FL   CL
used to characterize the flight dynamic behavior of the wing.        =    = tan ϑ.                                           (6)
                                                                  FD   CD
Because the primary objective of the study was to achieve
repeatable and reproducible measurements, we did not post-        The lift-to-drag ratio is also a measure for the achievable
process the measured data further, for example, to account        flight speed of the kite in crosswind motion (van der Vlugt,
for line sag and the influence of weight. Since kites of the      2010; Schmehl et al., 2013).

Wind Energ. Sci., 4, 41–55, 2019                                                            www.wind-energ-sci.net/4/41/2019/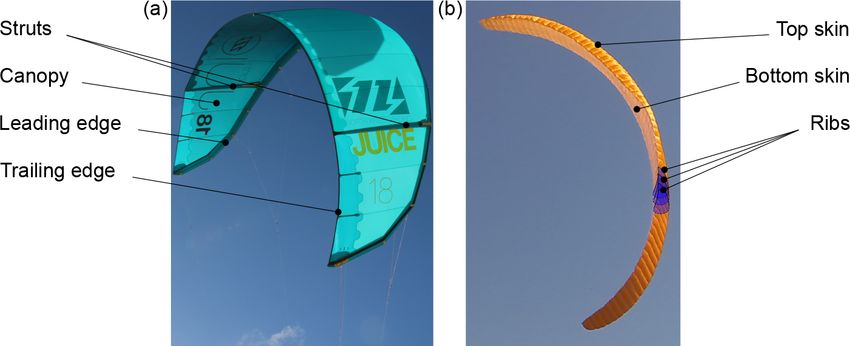
J. Hummel et al.: Automatic measurement and characterization of tethered membrane wings 45
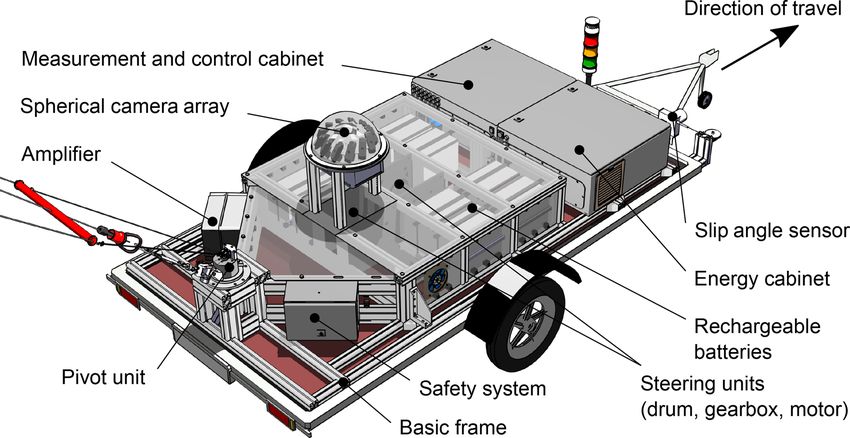
Figure 5. Components of the trailer-mounted test bench.
Figure 6. Towing test schematic.
2.3 Tether forces tether as well as the common steering input device) to gen-
erate realistic measurement data; (2) providing constant and
The tensile forces acting in the power and steering lines are
controllable flow conditions; (3) allowing for repeatable and
shown in Fig. 3. The ratio of the steering line forces to the
automated steering inputs; (4) permitting as little as possible
power line force,
of an impairment to the wing and its control unit by attach-
FSL,l + FSL,r ments; and (5) ensuring an easy transport and tow of the test
f= , (7)
FPL bench. The final version of the test bench is shown in Fig. 5
characterizes the load distribution between the rear and front and the schematic principle is illustrated in Fig. 6.
parts of the tethered wing, which allows for the validation
of simulation approaches. Additionally, to characterize sport
3.1 Structural design
kites this parameter has so far been used intuitively to de-
scribe the perceived steering forces. Hence, a quantitative With regard to the acquisition costs of the towed platform,
comparison of different wings regarding the load distribution a permanent mounting on a car trailer was decided. This so-
between power and steering lines is feasible. lution allows us to use any given car for towing and thereby
avoid additional costs. However, in contrast to heavier ve-
3 Test bench setup hicles (e.g., four-wheeled vehicles with a driver’s cab), the
influence of oscillations into the test bench by the tethers is
The following section gives a brief overview of the devel- expected. This results in an additional requirement for the de-
oped test bench. The main design goals are as follows: (1) us- sign of the test bench. All components are connected in such
ing the entire kite system (including the unscaled kite and a way that it is possible to change the driving platform in the
www.wind-energ-sci.net/4/41/2019/ Wind Energ. Sci., 4, 41–55, 2019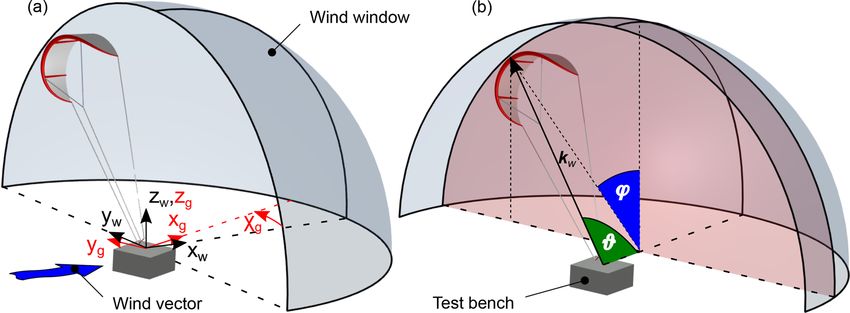
46                              J. Hummel et al.: Automatic measurement and characterization of tethered membrane wings

Figure 7. Design of the pivot unit.

future to further improvements. For example, vibrations in-         of the trailer (unavoidable tilting of the trailer is measured by
duced by the single-axle trailer could be greatly reduced by        an inertial sensor to correct the elevation angle described in
mounting the test rig on a heavier platform.                        Sect. 3.2). The design force was set to 5000 N. In the front
   The basic frame is used to mount the test bench modules          area in the direction of travel, space was provided for the
and absorb the load, in particular the line forces. It is assem-    control cabinets.
bled from aluminum profiles to avoid corrosion and easily af-
ford subsequent design modifications. The kite is connected
to the test bench by the pivot unit, which is located in the rear   3.2   Sensor systems
of the trailer (in relation to the direction of travel).
                                                                    This section gives a brief overview of the sensor technology
   The pivot unit is shown in Fig. 7. It is designed to have
                                                                    used to achieve the measuring results, which are described in
a minimum inertia, which allows for a smooth untwisting of
                                                                    Sect. 5. Components are termed as a sensor system, which
the lines. This leads to an automatic alignment of the line
                                                                    serves the purpose of determining certain measuring vari-
connection points towards the direction of the power line and
                                                                    ables and for which a clear distinction from the overall sys-
thus towards the direction of the wing within the wind win-
                                                                    tem is possible. For a complete documentation of all sensor
dow. The required torque for untwisting is realized by the
                                                                    systems please refer to Hummel (2017).
tensile force acting on the power line. The steering lines of
                                                                       The exact measurement of the line forces is highly priori-
the test bench are connected to the ends of the control bar
                                                                    tized due to the requirements for the majority of kite proper-
and passed through the center of the rotary axle to realize
                                                                    ties (see Sect. 2). To avoid impairments caused by additional
minimal inertia. They are redirected by pulleys connected to
                                                                    masses of the load cells within the steering lines, the load
rope drums that are operated by motors (see Fig. 5, steering
                                                                    cells are installed without insertion. Furthermore, this also
units). The tether forces are measured by means of load cells
                                                                    enables the use of load cells with a higher accuracy, which
in the steering lines, not interconnecting the lines. A mag-
                                                                    is related to a higher mass of the load cells (HBM S2M,
netic sensor attached to the static part measures the rotation
                                                                    precision class of 0.02 %, nominal force 1000 N, which re-
of a magnetic ring and thus of the unit itself. The rotary part
                                                                    sults in an absolute error of εFS2M = ±0.2 N). The resultant
essentially consists of the rotary axle. The universal joint is
                                                                    forces FS2M can be obtained from Eq. (8), as illustrated in
attached to it, transmitting the force of the power line.
                                                                    Fig. 8, assuming that the friction of the pulley is negligible.
   Each steering unit, which controls the length of a steering
                                                                    As shown in Eq. (8), the relation between the force measured
line, consists of a cable drum, a gearbox and a motor. The
                                                                    at the load cell and the force acting on the steering lines is
motors are each operated by a servo controller located within
                                                                    linear. This is caused by the constant line angle βSL . With
the measurement and control cabinet. The steering units are
                                                                    βSL = 90◦ the maximum measurable force within the steer-
located in the middle of the test bench, together with the bat-
                                                                    ing lines is 707 N. Field tests have shown that this value is
teries. Since the motors and batteries are the heaviest com-
                                                                    high enough for common wing sizes. If a higher maximum
ponents of the test rig, this arrangement allows the center of
                                                                    force is required in the future, the load cells can be exchanged
gravity to be close to the wheel axis to prevent a static tilting
                                                                    by sensors with a higher nominal force. However, this will be

Wind Energ. Sci., 4, 41–55, 2019                                                             www.wind-energ-sci.net/4/41/2019/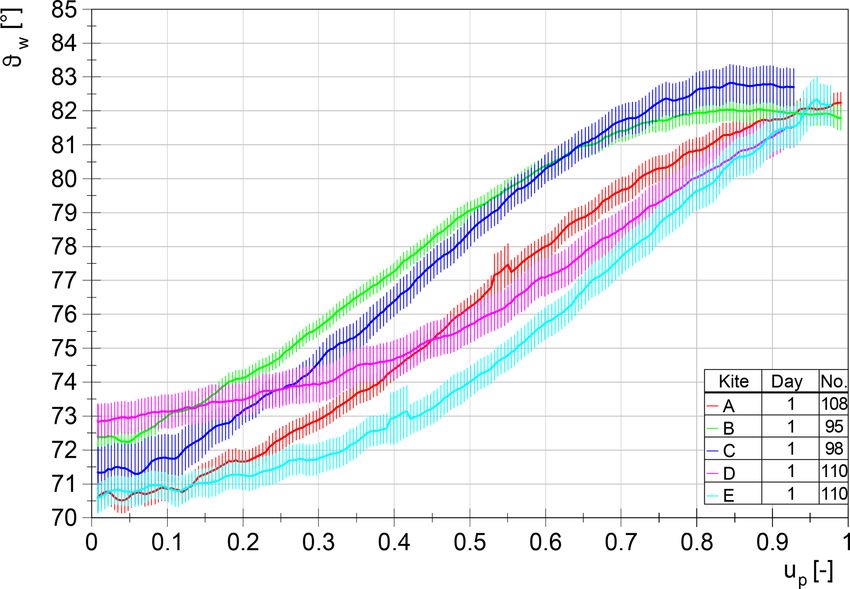
J. Hummel et al.: Automatic measurement and characterization of tethered membrane wings                                                     47

Figure 8. The resultant force F S2M on the load cell of a steering line.

Figure 9. Cartesian coordinates for Xg < 0◦ , index “g”: reference to the test bench, index “w”: reference to the wind direction (a), elevation
angle ϑ and azimuth angle ϕ for Xg = 0◦ (b).

accompanied by reduced accuracy:                                           elevation angle is suited for determining the aerodynamic ef-
          p                                                                ficiency, even if the kite is not located within the x–z plane
FS2M = FSL 2 − 2 cos βSL .                                       (8)       in reference to the wind direction. In contrast to other defi-
                                                                           nitions, i.e., β in Schmehl et al. (2013), ϑ does not vary for
   The measurement of the force in the power line is per-                  a constant glide ratio (see Fig. 9, intersection of red plane
formed by an interposition of the load cell (see Fig. 7). A                with grey wind window). This angle definition facilitates the
load cell with a nominal force of 5000 N is used, which has                calculation of the glide ratio even if the kite occasionally de-
a precision class of 0.2 % (HBM U9C). The absolute error                   flects from the symmetry plane of the wind window (down-
results in εFU9C = ±10 N. The signals of the load cells are                wind position). The rotary axle has a non-neglecting rota-
amplified and then sent to an extension board of the sbRIO.                tional inertia and therefore the measurement of the azimuth
The amplifiers are located as shown in Fig. 5.                             and elevation angle, with respect to the test bench, is com-
   Measuring the angle of the power line is intended to enable             posed of three sensors, which are shown in Fig. 7. First, the
a simple and reliable determination of the elevation angle ϑ               rotational deviation within the x–y plane is calculated by the
and the azimuth angle ϕ, which is illustrated in Fig. 9. The               sum of the rotation angle of the rotary axle 8RA (measured
polar coordinate system, in particular the elevation angle ϑ,              by the magnetic sensor) and the measured wind direction
is based on Erhard and Strauch (2013a). The definition of the

www.wind-energ-sci.net/4/41/2019/                                                                      Wind Energ. Sci., 4, 41–55, 2019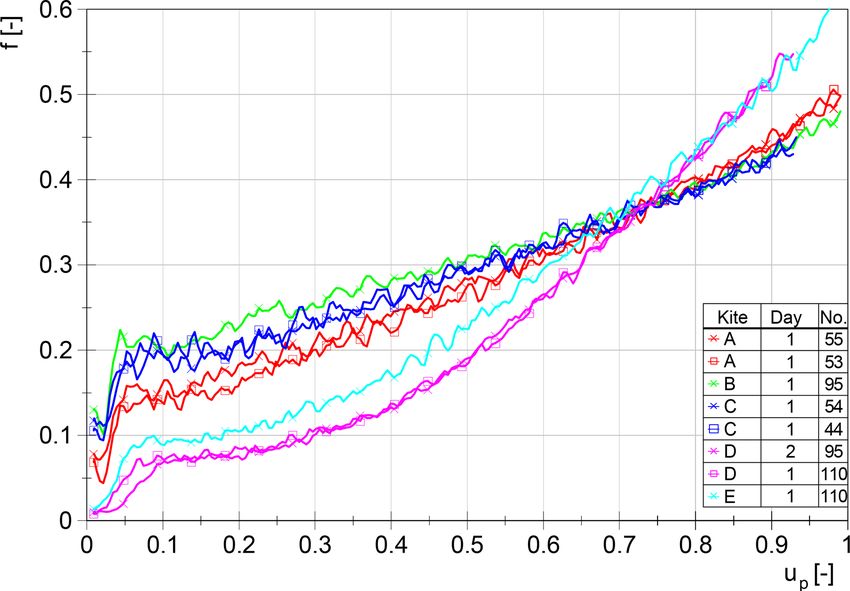
48 J. Hummel et al.: Automatic measurement and characterization of tethered membrane wings
Xg . The magnetic ring of the magnetic sensor has a suffi- 3.3.1 Wind speed
ciently large inner diameter to pass the steering lines through
The absolute error of the wind speed measurement for the
it. Thus, it is possible to mount it underneath the rotary axle
weather station according to the manufacturer is εvw =
without impairing the functionality of the pivot unit. Second,
0.05 m s−1 . The error of the wind direction measurement is
the rotational deviation of the universal joint is measured by
given by εX = 1◦ .
the elevation angle sensor (2UJ ) and the azimuth angle sen-
For calculating the kite properties, the resulting wind
sor (8UJ ) to realize low friction as well as a negligible in-
speed at kite level is needed, whereas the wind speed on top
fluence on the line angle. As a result, the universal joint will
of the towing vehicle is measured. Thus, as an additional
already deflect at low forces in the power line.
error for the given test setup, the error due to the height
The wing position k w within the wind window can be cal-
difference in wind measurement, must be investigated. The
culated by Eq. (11) as a result of the sensors; index “g” in-
weather station is located on top of the towing vehicle at a
dicates the reference to the test bench and index “w” to the
height zREF of 3 m. Depending on the length of the tether,
wind direction coordinate system:
the kite typically reaches a height z of 15 to 30 m. The most
commonly used extrapolation method is the wind power law
cos(8RA + Xg ) − sin(8RA + Xg ) 0
(Akdağ et al., 2013; Ghita et al., 2013). This method is as-
Mw = sin(8RA + Xg ) cos(8RA + Xg ) 0 (9) sumed to be valid within the ground-level boundary layer
0 0 1 (< 100 m). Empirical data presented by Archer (2013) show
that this model is well suited to approximate wind profiles by
cos 2UJ 0 − sin 2UJ cos 8UJ − sin 8UJ 0 measuring at a reference height zREF and thus to estimate the
0 1 0 sin 8UJ cos 8UJ 0 , wind speed vtw,plaw (z) on kite level z. The wind power law is
sin 2UJ 0 cos 2UJ 0 0 1 defined as follows:
α
z
vtw,plaw (z) = vtw (zREF ) . (13)
zREF
r
k w = Mw 0 (10) Here, vtw (zREF ) indicates the static true wind speed at a fixed
0 position above the ground at an altitude zREF (index “tw”:
true wind speed), which also cannot be directly measured
cos(8RA + Xg ) − sin(8RA + Xg ) 0 rPU
because of the moving test bench. The coefficient of fric-
+ sin(8RA + Xg ) cos(8RA + Xg ) 0 0 ,
tion α depends on the terrain type and increases with rising
0 0 1 0
terrain roughness. Despite testing on a former airfield, the
coefficient of friction is assessed in an overestimating way
to perform a safe calculation (this overestimation will result
kw = r (11) in an overestimated static wind speed on kite level, which
cos(8RA + Xg ) cos 2UJ cos 8UJ − sin(8RA + Xg ) sin 8UJ
in turn will result in an overestimation of the resulting error
sin(8RA + Xg ) cos 2UJ cos 8UJ + cos(8RA + Xg ) sin 8UJ δvw,real ). Thus, it is assumed as 0.25 for wooded countryside
sin 2UJ cos 8UJ with many trees. If the true wind vector vtw (zREF ) points to-
wards the opposite direction of travel, the influence of the
cos(8RA + Xg ) relative error δvw,real of the wind speed vw,real (z) at kite level
+ rPU sin(8RA + Xg ) . will be at a maximum. This is because the relative portion of
0 the true wind speed vtw (zREF ) is maximized and the required
speed of the towing vehicle vp (zREF ) to reach the desired test-
Here, r represents the tether length and rPU represents the ing speed vw (zREF ) is minimized:
distance between the axis of the rotary axle and the pivot
point of the universal joint (see Fig. 7). From Eq. (12) the vp (zREF ) = vw (zREF ) − vtw (zREF ). (14)
resulting elevation angle ϑw and azimuth angle ϕw can be The resulting wind speed vw,real at flight altitude z is com-
determined: posed of the traveling speed vp and the theoretical wind speed
according to the wind power law vtw,plaw (z), leading to
cos ϑw
k w = r sin ϕw sin ϑw . (12) vw,real (z) = vp (zREF ) + vtw,plaw (z). (15)
cos ϕw sin ϑw The resulting error is reduced with decreasing altitude, de-
creasing natural wind and increasing target speed. At present,
3.3 Error analysis line lengths of 24 m are used, while the minimum target
speed is set to 11 m s−1 . The relative error can thus be as-
The error analysis of the measured data leading to the results sumed as δvw,real ≤ +20 %. For a detailed calculation please
in Sect. 5 is described hereafter. refer to Hummel (2017).
Wind Energ. Sci., 4, 41–55, 2019 www.wind-energ-sci.net/4/41/2019/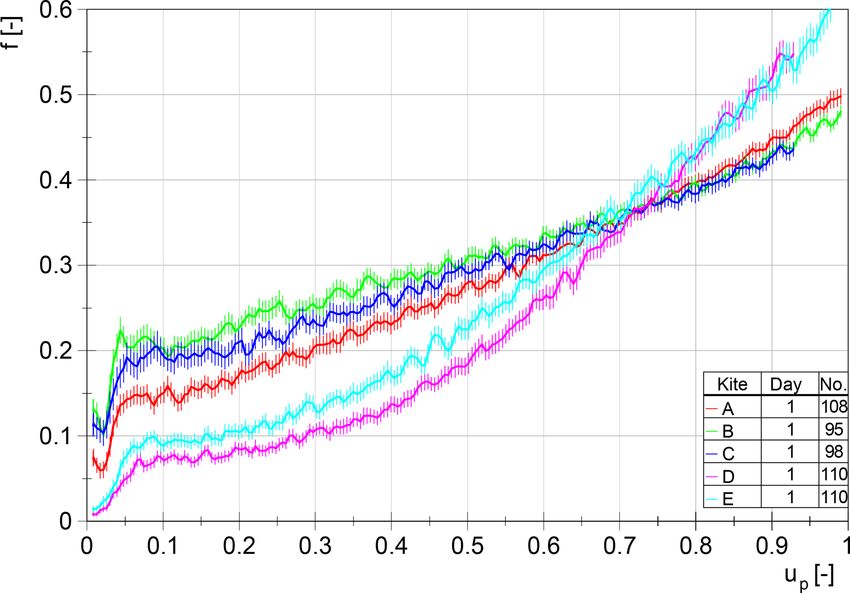
J. Hummel et al.: Automatic measurement and characterization of tethered membrane wings                                          49

3.3.2    Elevation angle

The angle sensors of the universal joint have an absolute
measuring error of ε2UJ = ε8UJ = ±0.72◦ , while the mag-
netic sensor has an absolute measuring error of ε8RA =
±0.3◦ . To determine the resultant error from the three an-
gle sensors, the error-prone angles ϑ and ϕ must be calcu-
lated analogously to Sect. 3.2. The maximum error was deter-
mined using a MATLAB script. At first, the error-free angles
were calculated, followed by a calculation of the error-prone
angles for each angle combination. These error-prone angles
result from a combination of the minimum and maximum
values, which arise due to the individual errors mentioned         Figure 10. Design of the user interface (bar stand).
before. The maximum error of the elevation angle in the co-
ordinate system of the test bench is εϑg = 1.2◦ . If the error
of the weather station εX = 1◦ is added to the error of the        the towing vehicle a direct view of the wing is impossible.
magnetic sensor ε8RA , the theoretical maximum error of the        The image is taken by means of a wide-angle camera atop
elevation angle within the wind direction coordinate system        the roof of the vehicle. To enable a subsequent video evalu-
results in εϑw = 2.1◦ .                                            ation, the recorded data are stored on the camera’s internal
   The quality of the analysis could be further improved by        memory card. When the measurement procedure is started
accounting for line sag and the influence of weight. Never-        by the pilot, video recording is initiated automatically by the
theless, as mentioned in Sect. 2, we did not post-process the      sbRIO (central control unit; see Sect. 4.1). An LED is placed
measured data because the primary objective of the study was       within the visual range of the camera for the later synchro-
the repeatability and reproducibility of the measurements.         nization of the video and the measured data. This enables the
                                                                   synchronization of the beginning of data recording with the
3.4     User interface                                             beginning of the video.
                                                                      To record the measurement data acquired from the sbRIO
The developed user interface (bar stand) allows us to manip-       and perform control inputs to set up the test run, a notebook
ulate the control bar position of the test bench. The pilot also   is used as a host computer. The host computer communicates
receives a haptic feedback of the line forces via the interface.   with the sbRIO via network interface. During a test run, the
The system was designed based on the assumption that an            notebook is placed in front of the pilot so that a perception
increase in safety and reliability is achieved through an im-      of the numerical display elements of the host computer is
proved perception of the prevailing flight condition, when a       possible. During a test procedure the pilot is not required to
fully or semi-manual flight is performed. The pilot should be      execute inputs on the host computer.
able to estimate the line forces without numerical display el-        Furthermore, a foot pedal connected to the host computer
ements to extend the pilot’s perception of the flight situation.   is used to execute maneuvers in the testing mode. When the
As a result, this device allows for the subjective evaluation of   pedal is actuated by the pilot, the previously set maneuver is
the kite properties.                                               executed by the sbRIO. Depending on the degree of automa-
   The user interface is located inside the towing vehicle and     tion, the pilot is enabled to act out certain steering inputs via
equipped with a common control bar used to control sport           the control bar. As soon as the pilot releases the pedal, the
kites (see Fig. 10). The measured line forces are induced to       maneuver is terminated and the kite can be controlled manu-
the lines of the user interface by means of winches operated       ally again.
by servomotors. The force acting on the power line is trans-
ferred to the pilot via a harness used for kitesurfing. The mo-
                                                                   4     Data acquisition
tor position and thus the current bar position is determined
by integrated encoders. This setup enables a control of the        4.1    Data processing system
wing, which is close to reality, by moving a common con-
trol bar as well as by transmitting the scaled forces acting on    This section briefly describes the structure of the data pro-
the lines. The maximum force of the steering lines was set         cessing hardware of the test bench. A schematic diagram is
to 50 N and the force of the power line to 350 N. This deter-      shown in Fig. 11. The data processing system and the DC
mination was made to avoid a physical overstressing of the         power supply are localized within the measurement and con-
pilot and to limit the size of the actuators. The measured line    trol cabinet (see Fig. 5). As shown in Fig. 11, the National In-
forces must therefore be scaled by a proportionality factor.       struments sbRIO 9632 serves as the central control unit. It is
   The visual feedback is realized by the display shown in         connected to various components, such as sensors, via a self-
Fig. 10. Because of the integration of the user interface into     made custom interface board. The servo controllers of the

www.wind-energ-sci.net/4/41/2019/                                                              Wind Energ. Sci., 4, 41–55, 2019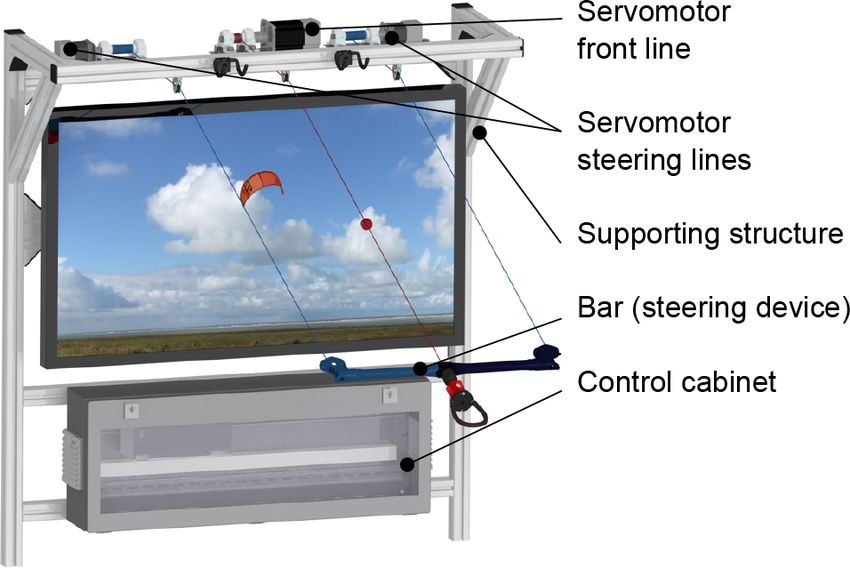
50                            J. Hummel et al.: Automatic measurement and characterization of tethered membrane wings

Figure 11. Measuring and control diagram.

motors mentioned in Sect. 3.1 communicate via a CAN mod-           Pütnitz, Germany. The target wind speed was consistently set
ule with the sbRIO. A network interface is used to communi-        to 22 kn (11.3 m s−1 ) to demonstrate the repeatability of the
cate with the host computer and retrieve measured values of        test method.
the spherical camera array. The sbRIO has been chosen be-             The range of wind speed that can be examined is only lim-
cause of the implemented central processing unit (CPU) and         ited by the cut-in wind speed of the kite (minimum wind
the field-programmable gate array (FPGA).                          speed for flying the kite) and the maximum tensile force re-
   The CPU allows the main control algorithm (the real-time        sulting from the kite acting on the test bench (the design force
operating system; RTOS) to be executed in real-time. To en-        was set to 5000 N; see Sect. 3.1). Because of the weight of the
sure a safe test operation, a real-time capability is required.    test bench the maximum vertical force is currently limited to
In particular, control inputs have to be executed in a prede-      3000 N, which could be increased by using a heavier trailer.
fined time. For this purpose, a deterministic loop was intro-      Assuming a coefficient of CR = 0.7 (representing the peak
duced within the RTOS (with a maximum execution period             value in Fig. 15), surface area of A = 10 m2 , air density of
of 20 ms). This allows the motors to be addressed at a fre-        ρ = 1.184 kg m−3 and apparent wind velocity of va = 50 kt
quency of 50 Hz. The FPGA processor, on the one hand,              (25.7 m s−1 ), the resulting force is FR = 2837 N < 3000 N
is used as an access to the analog and digital interfaces via      (see Eq. 4). Since the aerodynamic coefficients investigated
the internal bus of the sbRIO. On the other hand, programs         so far are wind independent, there is no need to test in higher
can be implemented that are converted into a logic circuit by      wind speeds to compare the wings against each other. For
means of the integrated gates. Due to the configurable logic       the presented maneuver “linear power” in combination with
circuit, parallel signal processing is possible, which increases   the presented wing sizes, a maximum testing speed of 50 kn
the speed of the data processing.                                  (25.7 m s−1 ) can be given. The traction force will increase
                                                                   substantially when the kite is operated in crosswind maneu-
                                                                   vers (Schmehl et al., 2013). To analyze kites in this flight
4.2   Experimental setup                                           mode with traction forces exceeding 5000 N, the design of
                                                                   the test bench has to be adapted or the surface area of the
The dynamic test procedure used in this paper is described         wing has to be reduced accordingly.
below. Dynamic tests are characterized by moving the test             Figure 12 shows the towing vehicle with the test bench in
bench. The procedure can be carried out on any straight            measuring operation. Measurements are solely conducted on
track. It is of paramount importance that the ground surface       the straight sections. As described above, tests are carried out
is as flat as possible to reduce oscillations. The measurements    on days with as little wind as possible. Testing under these
within this work have been carried out on the former airport

Wind Energ. Sci., 4, 41–55, 2019                                                           www.wind-energ-sci.net/4/41/2019/
J. Hummel et al.: Automatic measurement and characterization of tethered membrane wings 51
means of the maneuver “linear power” to demonstrate the
functionality of the test bench and the feasibility of the devel-
oped test procedure. Before starting the maneuver, the wing
is positioned and stabilized by the pilot at the zenith position
within the wind window. The foot pedal connected to the host
computer is then manually actuated to launch the maneuver.
The power position is automatically increased by the sbRIO
up to 1lPL,max = 500 mm (see Fig. 4) with a constant speed
over a period of 4.5 s. The pilot can still execute steering in-
puts to keep the kite in a stable position at the zenith.
The measurement diagrams are shown in the following
subsections. Only maneuvers lasting a given minimal time
span were taken into account. During some maneuvers an
unintentional change in position or orientation (e.g., caused
by gusts) led to the pilot aborting the maneuver; this can re-
sult in a too-short maneuver, which in turn would make the
Figure 12. Dynamic test procedure. statistical value calculation impossible. The valid results are
plotted against the power ratio up . The determination of the
angle of attack was not feasible within the scope of this work
conditions allows for the performance of multiple maneuvers and will be done in future research for this project.
without landing the kite since the track can be run both ways.
To launch the kite, it is set up behind the towing vehicle,
placed on its trailing edge and the lines are tightened. When
5.1 Tested kites
accelerating the test bench, the kite does an ascent movement
in the direction of the zenith. The driver of the vehicle is For characterization of the dynamic properties, five different
supplied with a display showing the duplicated view of the kites with the same surface area of 10 m2 were measured (de-
host computer. That way, the driver can assess the current noted by kite A to E within the graphs). All kites are designed
flight situation and the currently measured wind speed. The for different purposes in kite sports.
driver adjusts the desired wind speed via the cruise control On the one hand, kite C was designed to ride efficiently
of the towing vehicle. After reaching the target speed, the upwind, i.e., affording a high traveling angle in the wind di-
maneuvers can be carried out. rection. In addition, high jumps with a long air time should
be possible. Therefore, a high aerodynamic efficiency asso-
4.3 Measurement data evaluation ciated with a high resulting force is required. Furthermore,
this kite should provide a high depower capability, resulting
The measurement data are evaluated by means of the soft- in a significant change in the lift coefficient.
ware Diadem, which is originated by the company National Kites D and E have the same design, but originated from
Instruments, also supplying the software for the host as well different model years. Because of their shape, these kites
as the measurement and control unit. feature a significant contrast to the other kites. Significantly
The implemented script is used to preprocess, process and more wing area is located at the wing tips, which should re-
display the measurement data. First, the desired measure- sult in lower aerodynamic efficiency and a lower lift coeffi-
ment files are transferred to the script. Then, each measure- cient.
ment file is preprocessed in a loop. This includes, among Kite A is intended to be an all-rounder, which means the
other functions, an automatic detection of maneuvers and resulting lift and efficiency should be positioned between C
a distinction between driving along the straight track and and D–E.
turnaround. To obtain the desired graphs, statistical val- Kite B is designed to achieve good handling and turning
ues are calculated from the maneuvers. The graphs and an abilities as well as providing a good upwind performance at
overview of the measured data are then added to a report PDF the same time. For this reason the steering forces have to be
for each measurement file. Once each measurement file has higher while depowered (up ' 0) compared to the other kites.
been processed, the results are summarized in an additional The measurements were conducted during two different
overview to allow for a comparison between each file. days (marked as day 1 and 2). For each property, a figure is
shown that summarizes all measurement data into a single
5 Results curve for each kite to compare the kites against each other.
Additionally, these figures show the resulting error from all
This section presents the obtained results for the wing prop- maneuvers that were taken into account for a confidence in-
erties defined in Sect. 2. The measurements were taken by terval of 95 %.
www.wind-energ-sci.net/4/41/2019/ Wind Energ. Sci., 4, 41–55, 201952 J. Hummel et al.: Automatic measurement and characterization of tethered membrane wings
Figure 13. Elevation angle with resulting error (P = 95 %). Figure 14. Aerodynamic efficiency (lift-to-drag ratio) with result-
ing error (P = 95 %).
5.2 Aerodynamic efficiency
The measurement results of the elevation angle ϑw can be
seen in Fig. 13. The resulting aerodynamic efficiency can be
calculated by Eq. (6) (see Fig. 14). The different curves can
be distinguished by height and progression.
As discussed in the previous chapter, it can be shown that
kite C offers the highest and kites D–E the lowest aerody-
namic efficiency. It can also be concluded that a reliable re-
peatability within the same day can be achieved. This finding
was confirmed by further tests on different days. The only
significant deviation was found after a long period between
two test runs. The time between day 1 and day 2 was exactly
1 year. The elevation angle differs between these days only
by an offset. To determine this offset in the future and, if nec-
essary, to compensate for it, a reference kite was introduced, Figure 15. Lift coefficient with resulting error (P = 95 %).
which is measured once every test day. The resulting curves
of this reference kite should fit each other on different test
runs. If an offset occurs, the starting points of the graphs can The resulting curves of the datasets are shown in Fig. 15.
be corrected and thus the wings can still be compared rela- As predicted in Sect. 5.1, kite C offers the highest and
tively to each other. To fully compensate for this deviation in kites D–E the lowest lift coefficient. The deviation between
the future, the initial horizontal alignment of the test bench datasets for the same kite lies within the resulting error. The
will be measured by means of an inertial measurement unit. influence of the abovementioned deviation of the elevation
The deviation is most likely caused by changes in geometry angle measurement on the lift coefficient is negligible.
being difficult to control, for example a change in the tire As mentioned in Sect. 2.1, the depower capability for each
pressure of the trailer or the towing vehicle. kite can be calculated by the difference between the max-
imum and minimum values. Apparently, kites B and C are
5.3 Lift coefficient best suited for AWE systems using the pumping mode be-
cause of their high depower capability and their high lift
The lift coefficient CL is calculated according to Eq. (2) us- coefficient. A further distinction can be made based on the
ing the given manufacturer’s surface area of 10 m2 and a curve progressions. Kites A to C can be characterized by their
constant air density of ρ = 1.184 kg m−3 . The airflow veloc- degressive progression, whereas kites D and E are character-
ity is assumed as equal to the measured wind speed of the ized by a progressive increase in the lift coefficient.
weather station. The total tether force is calculated by the
sum of the measured forces of three load cells. Due to the
5.4 Force ratio
high elevation angles, the resulting force coefficient CR re-
sembles CL and is not shown separately (see Eqs. 4 and 2 Figures 16 and 17 show the force ratio f between steering
with sin(ϑw > 70◦ ) ≈ 1). lines and the power line, which can be calculated by Eq. (7).
Wind Energ. Sci., 4, 41–55, 2019 www.wind-energ-sci.net/4/41/2019/J. Hummel et al.: Automatic measurement and characterization of tethered membrane wings 53
6 Conclusion and outlook
In most cases, a reproducible, high-quality measurement of
the flight dynamic properties of tethered flexible membrane
wings exceeds the available budget. Furthermore, existing
approaches do not allow for a recording or even automation
of steering inputs, which is crucial for the reproducibility of
the experiment. In this paper, we have presented a unique tow
test setup for automatic measurement of the dynamic prop-
erties of different wing types at full scale and under realistic
conditions. The objective was to demonstrate the methodol-
ogy and particularly the repeatability of the test procedure.
Using the maneuver “linear power”, we determine the aero-
dynamic coefficients and lift-to-drag ratio of the wing as
functions of the ratio of power and steering line lengths – de-
Figure 16. All measurement files: force ratio between steering lines noted as the relative power setting – by measuring line forces
and the power line. and line angles. The ratio is varied automatically, while the
pilot is manually adjusting the steering line lengths to keep
the kite at a fixed position relative to the towing vehicle. By
automating the test cycles we can acquire mean values of
high statistical quality with minimal errors. We have demon-
strated repeatability on the basis of eight recorded datasets
using the maneuver “linear power” at a constant wind speed
of 22 kn (11.3 m s−1 ). We conclude from this study that it is
feasible to objectively measure the flight dynamic properties
of tethered membrane wings and to quantitatively assess and
compare different wing designs.
Based on this work, we propose several functional en-
hancements for future research. By performing more sophis-
ticated flight maneuvers the full operational envelope of air-
borne wind energy systems can be covered. By completing
the automation of the process we expect a significant in-
crease in measurement accuracy, which will improve the fu-
Figure 17. Force ratio between steering lines and the power line
ture aerodynamic parameter identification and evaluation of
with resulting error (P = 95 %).
existing simulation models. A further accuracy increase can
be achieved by adding sensors to the wing and directly mea-
To estimate the reproducibility for each kite property, all suring the flight state and the relative flow.
eight datasets are first presented together within the same di-
agram (Fig. 16). Obviously, a distinction between the kites
Code and data availability. The code and measurement data can
is possible. As a result of their different wing shapes, the
be made available in the framework of a cooperation agreement. If
curve progression of kites D and E compared to the other
interested please contact the corresponding author.
kites is clearly different (progressive). Furthermore, the kites
can be distinguished by the height of the force ratio. With
these curves and the force curve itself, existing simulation Author contributions. JH designed the test setup with the sup-
models can be evaluated reliably. port of DG and performed the measurements. The preparation of
For AWE systems the force ratio is of great importance, the paper was the joint work of JH, DG and RS.
since it determines the steering possibility of the wing while
fully depowered (especially during the retraction phase). To
guarantee the execution of control commands by transmitting Competing interests. The authors declare that they have no con-
the steering forces, the force ratio must not be too low. flict of interest.
Acknowledgements. Roland Schmehl has received funding
from the European Union Horizon 2020 research and innovation
program under Marie Skłodowska-Curie grant agreement no.
www.wind-energ-sci.net/4/41/2019/ Wind Energ. Sci., 4, 41–55, 201954 J. Hummel et al.: Automatic measurement and characterization of tethered membrane wings
642682 for the ITN project AWESCO and grant agreement no. Technology, chap. 31, Springer, Berlin Heidelberg, 517–546,
691173 for the “Fast Track to Innovation” project REACH. https://doi.org/10.1007/978-3-642-39965-7_31, 2013.
Dunker, S.: Tether and Bridle Line Drag in Airborne Wind Energy
Edited by: Johan Meyers Applications, in: Airborne Wind Energy – Advances in Technol-
Reviewed by: Julien Deparday and one anonymous referee ogy Development and Research, edited by: Schmehl, R., Green
Energy and Technology, chap. 2, Springer, Singapore, 29–56,
https://doi.org/10.1007/978-981-10-1947-0_2, 2018.
Erhard, M. and Strauch, H.: Theory and Experimental Validation
References of a Simple Comprehensible Model of Tethered Kite Dynamics
Used for Controller Design, in: Airborne Wind Energy, edited
Akdağ, S. A., Güler, Ö., and Yağci, E.: Wind speed ex- by: Ahrens, U., Diehl, M., and Schmehl, R., Green Energy
trapolation methods and their effect on energy genera- and Technology, chap. 8, Springer, Berlin Heidelberg, 141–165,
tion estimation, in: Renewable Energy Research and Ap- https://doi.org/10.1007/978-3-642-39965-7_8, 2013a.
plications (ICRERA), Madrid, Spain, 20–23 October 2013, Erhard, M. and Strauch, H.: Control of Towing Kites for
https://doi.org/10.1109/ICRERA.2013.6749793, 2013. Seagoing Vessels, IEEE T. Contr. Syst. T., 21, 1629–1640,
Archer, C. L.: An Introduction to Meteorology for Airborne Wind https://doi.org/10.1109/TCST.2012.2221093, 2013b.
Energy, in: Airborne Wind Energy, edited by: Ahrens, U., Diehl, Fagiano, L. and Marks, T.: Design of a Small-Scale Prototype for
M., and Schmehl, R., Green energy and technology, chap. 5, Research in Airborne Wind Energy, IEEE-ASME T. Mech., 20,
Springer, Berlin Heidelberg, 81–94, https://doi.org/10.1007/978- 166–177, https://doi.org/10.1109/TMECH.2014.2322761, 2015.
3-642-39965-7_5, 2013. Fagiano, L., Zgraggen, A. U., Morari, M., and Khammash,
Bosch, A., Schmehl, R., Tiso, P., and Rixen, D.: Dynamic nonlinear M.: Automatic crosswind flight of tethered wings for air-
aeroelastic model of a kite for power generation, J. Guid. Con- borne wind energy:modeling, control design and experi-
trol Dynam., 37, 1426–1436, https://doi.org/10.2514/1.G000545, mental results, IEEE T. Contr. Syst. T., 22, 1433–1447,
2014. https://doi.org/10.1109/TCST.2013.2279592, 2014.
Bosman, R., Reid, V., Vlasblom, M., and Smeets, P.: Airborne Fechner, U. and Schmehl, R.: Flight Path Planning in a Turbulent
Wind Energy Tethers with High-Modulus Polyethylene Fibers, Wind Environment, in: Airborne Wind Energy – Advances in
in: Airborne Wind Energy, edited by: Ahrens, U., Diehl, M., and Technology Development and Research, edited by: Schmehl, R.,
Schmehl, R., Green Energy and Technology, chap. 33, Springer, Green Energy and Technology, chap. 15, Springer, Singapore,
Berlin Heidelberg, 563–585, https://doi.org/10.1007/978-3-642- 361–390, https://doi.org/10.1007/978-981-10-1947-0_15, 2018.
39965-7_33, 2013. Fechner, U., van der Vlugt, R., Schreuder, E., and Schmehl, R.:
Breukels, J.: An Engineering Methodology for Kite De- Dynamic Model of a Pumping Kite Power System, Renew. En-
sign, PhD thesis, Delft University of Technology, ISBN: erg., 83, 705–716, https://doi.org/10.1016/j.renene.2015.04.028,
978-90-8891-230-6, available at: http://resolver.tudelft.nl/uuid: 2015.
cdece38a-1f13-47cc-b277-ed64fdda7cdf (last access: 19 Jan- Ghita, M. R., Andrei, H., and Marin, O. F.: Modeling of wind re-
uary 2019), 2011. source to the turbine hub height, in: Proceedings of the Interna-
Breukels, J., Schmehl, R., and Ockels, W.: Aeroelastic Sim- tional Conference on Electronics, Computers and Artificial Intel-
ulation of Flexible Membrane Wings based on Multibody ligence (ECAI), IEEE, Pitesti, Romania, 27-29 June 2013, 1–6,
System Dynamics, in: Airborne Wind Energy, edited by: https://doi.org/10.1109/ECAI.2013.6636175, 2013.
Ahrens, U., Diehl, M., and Schmehl, R., Green Energy and Gohl, F. and Luchsinger, R. H.: Simulation Based Wing De-
Technology, chap. 16, Springer, Berlin Heidelberg, 287–305, sign for Kite Power, in: Airborne Wind Energy, edited by:
https://doi.org/10.1007/978-3-642-39965-7_16, 2013. Ahrens, U., Diehl, M., and Schmehl, R., Green Energy and
Bungart, M.: Fluid-Struktur Kopplung an einem RAM-Air- Technology, chap. 18, Springer, Berlin Heidelberg, 325–338,
Kiteschirm, Master’s thesis, University of Stuttgart, 2009. https://doi.org/10.1007/978-3-642-39965-7_18, 2013.
Costa, D.: Experimental Investigation of Aerodynamic and Struc- Hummel, J.: Automatisierte Vermessung und Charakterisierung
tural Properties of a Kite, Master’s thesis, ETH Zurich, 2011. der dynamischen Eigenschaften seilgebundener, vollflexibler
Dadd, G. M., Hudson, D. A., and Shenoi, R. A.: Comparison of Tragflächen, Dissertation, Technische Universität Berlin, Berlin,
two kite force models with experiment, J. Aircraft, 47, 212–224, https://doi.org/10.14279/depositonce-5863, 2017.
https://doi.org/10.2514/1.44738, 2010. Hummel, J. and Göhlich, D.: Automatic Measurement and
de Groot, S. G. C., Breukels, J., Schmehl, R., and Ockels, Characterization of the Dynamic Properties of Tethered
W. J.: Modelling Kite Flight Dynamics Using a Multibody Re- Flexible Wings, in: Book of Abstracts of the Interna-
duction Approach, J. Guid. Control Dynam., 34, 1671–1682, tional Airborne Wind Energy Conference 2017, edited by:
https://doi.org/10.2514/1.52686, 2011. Diehl, M., Leuthold, R., and Schmehl, R., University of
de Wachter, A.: Deformation and Aerodynamic Performance Freiburg & Delft University of Technology, Freiburg, Ger-
of a Ram-Air Wing, Master’s thesis, Delft University of many, 126–127, available at: http://resolver.tudelft.nl/uuid:
Technology, available at: http://resolver.tudelft.nl/uuid: 89050243-6bc6-4e25-88f1-dcf4f6145bfe (last access: 19 Jan-
786e3395-4590-4755-829f-51283a8df3d2 (last access: 19 uary 2019), 2017.
January 2019), 2008. Jehle, C. and Schmehl, R.: Applied Tracking Control for Kite
Dunker, S.: Ram-Air Wing Design Considerations for Air- Power Systems, J. Guid. Control Dynam., 37, 1211–1222,
borne Wind Energy, in: Airborne Wind Energy, edited by: https://doi.org/10.2514/1.62380, 2014.
Ahrens, U., Diehl, M., and Schmehl, R., Green Energy and
Wind Energ. Sci., 4, 41–55, 2019 www.wind-energ-sci.net/4/41/2019/J. Hummel et al.: Automatic measurement and characterization of tethered membrane wings 55 Johari, H., Yakimenko, O., and Jann, T.: Aerodynamic Characteri- Stevenson, J. C.: Traction Kite Testing and Aerodynamics, PhD the- zation of Parafoils, in: Precision Aerial Delivery Systems: Mod- sis, University of Canterbury, available at: http://hdl.handle.net/ eling, Dynamics, and Control, edited by: Yakimenko, O. A., 10092/7688 (last access: 19 January 2019), 2003. Progress in Astronautics and Aeronautics, chap. 4, Ameri- Tauber, M. and Moroder, P.: Kite Surfing and Snow Kiting, in: can Institute of Aeronautics and Astronautics, Inc., 199–261, Adventure and Extreme Sports Injuries: Epidemiology, Treat- https://doi.org/10.2514/5.9781624101960.0199.0262, 2014. ment, Rehabilitation and Prevention, edited by: Mei-Dan, O. Leuthold, R. C.: Multiple-Wake Vortex Lattice Method and Carmont, M. R., chap. 8, Springer, London, 173–187, for Membrane Wing Kites, Master’s thesis, Delft Uni- https://doi.org/10.1007/978-1-4471-4363-5_8, 2013. versity of Technology, http://resolver.tudelft.nl/uuid: van der Vlugt, R.: Aero- and Hydrodynamic Performance Anal- 4c2f34c2-d465-491a-aa64-d991978fedf4(last access: 19 ysis of a Speed Kiteboarder, Master’s thesis, Delft Univer- January 2019), 2015. sity of Technology, available at: http://resolver.tudelft.nl/uuid: Mulder, J. A., Sridhar, J. K., and Breeman, J. H.: Identification 9e0c7a62-149c-4fab-8d27-afe15c1a8795 (last access: 19 Jan- of Dynamic Systems: Applications to Aircraft, Part 2, Non- uary 2019), 2010. linear Analysis and Manoeuvre Design, in: RTO AGARDo- van der Vlugt, R., Peschel, J., and Schmehl, R.: Design and Ex- graph 300: Flight Test Technique Series, vol. 3, Advisory Group perimental Characterization of a Pumping Kite Power System, for Aerospace Research and Development (AGARD), Neuilly in: Airborne Wind Energy, edited by: Ahrens, U., Diehl, M., and sur Seine, available at: https://www.sto.nato.int/publications/ Schmehl, R., Green Energy and Technology, chap. 23, Springer, AGARD/AGARD-AG-300-3-II/AGARDAG300.pdf (last ac- Berlin Heidelberg, 403–425, https://doi.org/10.1007/978-3-642- cess: 19 January 2019), 1994. 39965-7_23, 2013. Schmehl, R. (Ed.): Airborne Wind Energy – Advances in Technol- van Reijen, M.: The Turning of Kites: A Quantification of ogy Development and Research, Green Energy and Technology, Known Theories, Master’s thesis, Delft University of Springer Nature, Singapore, https://doi.org/10.1007/978-981-10- Technology, available at: http://resolver.tudelft.nl/uuid: 1947-0, 2018. 5836c754-68d3-477a-be32-8e1878f85eac (last access: 19 Schmehl, R., Noom, M., and van der Vlugt, R.: Traction Power January 2019), 2018. Generation with Tethered Wings, in: Airborne Wind Energy, Wood, T. A., Hesse, H., and Smith, R. S.: Predictive edited by: Ahrens, U., Diehl, M., and Schmehl, R., Green En- Control of Autonomous Kites in Tow Test Experi- ergy and Technology, chap. 2, Springer, Berlin Heidelberg, 23– ments, IEEE Control Systems Letters, 1, 110–115, 45, https://doi.org/10.1007/978-3-642-39965-7_2, 2013. https://doi.org/10.1109/LCSYS.2017.2708984, 2017. Stevenson, J., Alexander, K., and Lynn, P.: Kite performance testing by flying in a circle, Aeronaut. J., 109, 269–276, https://doi.org/10.1017/S0001924000000725, 2005. www.wind-energ-sci.net/4/41/2019/ Wind Energ. Sci., 4, 41–55, 2019
You can also read