Biovalorization of raw agro industrial waste through a bioprocess development platform for boosting alkaline phosphatase production by ...
←
→
Page content transcription
If your browser does not render page correctly, please read the page content below
www.nature.com/scientificreports
OPEN Biovalorization of raw
agro‑industrial waste
through a bioprocess development
platform for boosting alkaline
phosphatase production
by Lysinibacillus sp. strain APSO
Soad A. Abdelgalil*, Nadia A. Soliman, Gaber A. Abo‑Zaid & Yasser R. Abdel‑Fattah
This study highlighted the exploitation of mathematical models for optimizing the growth
conditions that give the highest phosphatase productivity from a newfound Lysinibacillus sp.
strain APSO isolated from a slime sample. Mathematical models facilitate data interpretation and
provide a strategy to solve fermentation problems. Alkaline phosphatase (ALP) throughput was
enhanced by 16.5-fold compared to basal medium based on a sequential optimization strategy
that depended on two-level Plackett–Burman design and central composite design. The additional
improvement for volumetric productivity and specific production yield was followed in a 7 L bench-top
bioreactor to evaluate microbial growth kinetics under controlled and uncontrolled pH conditions.
The pH-controlled batch cultivation condition neither supported cell growth nor enhanced ALP
productivity. In contrast, the uncontrolled pH batch cultivation condition provided the highest ALP
output (7119.4 U L−1) and specific growth rate (µ = 0.188 h−1) at 15 h from incubation time, which was
augmented > 20.75-fold compared to the basal medium. To the authors’ knowledge, this study is the
second report that deals with how to reduce the production cost of the ALP production process via
utilization of agro-industrial waste, such as molasses and food waste (eggshell), as a nutrimental
source for the improvement of the newfound Lysinibacillus sp. strain APSO ALP throughput.
White biotechnology refers to the usage of modern biotechnology for biochemical, industrial, and bioenergy
processing using living cells and/or their enzymes, which is an integral part of environmental sustainability
and industrial development and results in safe processes that reduce waste generation and energy u se1. White
biotechnology draws considerable attention from the scientific community for the target-oriented exploration of
microbial biocatalysis production for the service of the human healthcare system, industrial applications, ecosys-
tem functioning, and environmental sustainability. Currently, the biotechnological potential of ALP makes it gain
enormous attention in white biotechnology2. Phosphatases are one of the most crucial enzymes for an organism’s
survival and play a vital role in phosphate transportation and metabolism under phosphate-deficient conditions3.
Alkaline phosphatase (ALP) [orthophosphoric monoester phosphohydrolase; EC 3.1.3.1] is a ubiquitous,
homodimeric, hydrolytic, metallo-dependent, nonspecific, phosphormonoesterase that hydrolyzes a wide vari-
ety of phosphoric acid esters (dephosphorylation) to generate free inorganic phosphate at an alkaline pH or
move phosphoryl groups into other alcohols and catalyze the phosphorylation reaction in the presence of large
amounts of phosphate a cceptors4. Three strongly spaced metal reticulation positions ( M1–M3) are critical in the
enzyme catalytic reaction: two zinc ions ( Zn2+) occupy sites M 1 and M2 and magnesium ions ( Mg2+) occupy
site M3 near the bimetallic center, all of which are essential to the structural stability and catalytic activity of
the enzyme5. ALP has cosmopolitan distribution among microorganisms, plants, animals, and human tissue.
Bioprocess Development Department, Genetic Engineering and Biotechnology Research Institute (GEBRI), City
for Scientific Research and Technological Applications, New Borg El‑Arab City, Universities and Research Institutes
Zone, Alexandria 21934, Egypt. *email: sabdelgalil@srtacity.sci.eg
Scientific Reports | (2021) 11:17564 | https://doi.org/10.1038/s41598-021-96563-6 1
Vol.:(0123456789)
www.nature.com/scientificreports/
Figure 1. Schematic illustration of the exploitation of green chemistry sustainable strategies for the ultimate
benefit of biowaste sugarcane molasses for the scale-up production of bacterial ALP on bench top-scale
production.
Owing to its intrinsic stability, bacterial ALP tends to be catalytically active for a considerably longer duration
than its mammalian c ounterpart2.
Owing to the multiple vital roles of bacterial phosphatases in molecular regulatory activities, cell signaling
regulation, and phosphate homeostasis, bacterial phosphatases have gained attention in recent decades, as they
appear to have great potential in the fields of molecular biology and immunodetection and are being exploited
in environmental and agricultural biotechnology and animal f eeding4.
To meet the current and forecasted market demand, bacterial ALP production must be increased manifoldly
through innovative and efficient production strategies. An increase in productivity reduces the overall cost of the
product and the production cost. The key issues of industrial fermentation, process optimization, and scale-up
retain optimal and homogeneous reaction conditions that reduce the explanation to microbial stress and maxi-
mize metabolic precision to boost product yield and ensure good product quality. With the advent of modern
mathematical and statistical techniques, medium optimization has become more vibrant, effective, efficient,
economical, and robust in giving the r esults6.
Fermentation modeling and chemometric analysis can describe chemical and physical factors in near-real-
time data obtained through online and offline measurements7. To limit the number of significant experiments
done by employing large-batch and fed-batch bioreactor cultures, the optimal bioprocess development strategy
is identified and optimized initially via throughput screening on a small scale (shake-flasks)8. For a strain with
uncertain comfortability to establish a microbial production process, it is important to identify the physiological
features that describe the link between microbial development and ultimate output in a dramatic way. A high
initial microbial concentration and a low specific growth rate are often conducive to the optimized development
of product9. In the employment of enzymes in industrial processes, the related costs are of major significance.
The large-scale production of enzymes is a capital-intensive process that indirectly affects the cost of the
finished product in various manufacturing processes. The scale-up strategy is a complex biochemical process
for novel microbial production purposes based on low production cost, low environmental pollution, and high
innovation. There have been significant attempts to discover new enzymes from different species to boost cur-
rent enzymes, refine internal processes, or obtain marketable intellectual property10. Scale-up of bacterial ALP
production has no received attention to date. According to those mentioned above, this study is an innovative
step toward the scale-up of newfound Lysinibacillus sp. strain APSO ALP production from shake-flask to bench-
top bioreactor scale using biowaste sugarcane molasses, as illustrated in Fig. 1.
Results and discussion
Isolation and identification of ALP‑producing bacteria. In the preliminary exploration, the growth
of the bacterial microflora of a slime sample from Alexandria paper and pulp factory was enriched in a modi-
fied Pikovskaya (PVK) b roth11 medium supplemented with eggshell powder as a phosphate source. The pure
isolates were screened to produce extracellular ALP using chromogenic agar medium, such as methyl green
(MG)-phenolphthalein diphosphate (PDP) agar and rich medium supplemented with ρ-nitrophenyl phosphate
Scientific Reports | (2021) 11:17564 | https://doi.org/10.1038/s41598-021-96563-6 2
Vol:.(1234567890)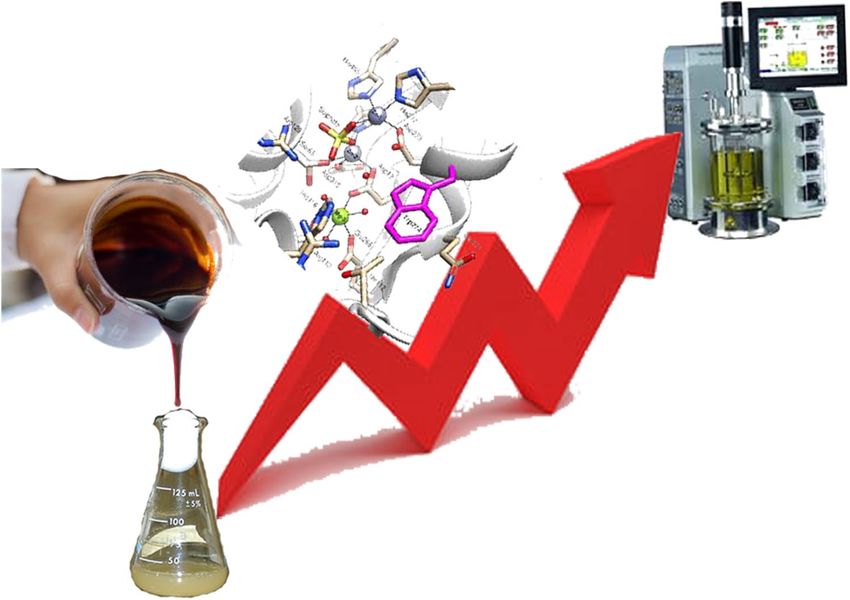
www.nature.com/scientificreports/
a)
KJ452163.1 Lysinibacillus macroides strain WS26
b)
KJ184909.1 Bacillus sp. CZGRY13
KP644237.1 Lysinibacillus xylanilyticus strain A8
KP670211.1 Lysinibacillus sp. DB14380
c) 32
KU950359.1 Lysinibacillus sp. strain GZUIFR-YC02
KX832684.1 Lysinibacillus xylanilyticus strain C5
60 MK824639.1 Bacterium strain BS1451
MT975241 Lysinibacillus sp. strain APSO
100 MK373033.1 Lysinibacillus sp. strain KDP-SUK-M5
MN216323.1 Lysinibacillus macroides strain LSO
KJ184852.1 Lysinibacillus sp. CZGRY3
NZ PYWM01000103.1 Lysinibacillus mangiferihumi strain M-GX18
93 NZ AUOZ01000066.1 Lysinibacillus sphaericus KCTC 3346
NZ PYUE01000018.1 Lysinibacillus tabacifolii strain K3514
0.5
d)
Figure 2. Isolation, screening, and identification of ALP-producing bacteria. (a) Qualitative screening of ALP-
producing bacteria. (b) Phylogenetic tree based on 16S rDNA gene sequence analysis showing the relationship
of Lysinibacillus sp. strain APSO with reference strains (NCBI GenBank) constructed using the neighbor-joining
method with the aid of MEGA 7.0 program. Sequence divergence is indicated by the scale bar. (c) Gram stain
of Lysinibacillus sp. strain APSO (magnification, oil lens, × 100). (d) SEM micrograph of Lysinibacillus sp. strain
APSO showing cell morphology at a magnification of × 3500 and × 1000 with 20 kV.
(ρNPP). The MG-PDP method has a unique advantage over other procedures, through which the contamination
opportunity is avoided and the distinction between excreted and cellular phosphatase was more obvious. These
media had previously been used to pick out the most potent ALP-producing bacteria, as reported by Patel Fal-
guni et al.12. Approximately 30 isolates showed notable ALP activity on MG-PDP agar. Based on the colony color
intensity, 4 of 30 isolates exhibited a high capability of ALP productivity. Among these, the colony of the APSO
isolate manifested the highest obviousness of green and yellow color intensity, as shown in Fig. 2a, and showed a
maximal ALP activity of 145 U L−1 min−1 compared to the other three isolates that showed enzyme activities of
76.99, 35.93, and 14.6 U L −1 min−1 according to the quantitative screening program. For this reason, the APSO
isolate was picked out for a further detailed investigation. The representative isolate that displayed the greatest
activity was identified using molecular identification. Sanger sequencing of the dideoxynucleotide of the ampli-
Scientific Reports | (2021) 11:17564 | https://doi.org/10.1038/s41598-021-96563-6 3
Vol.:(0123456789)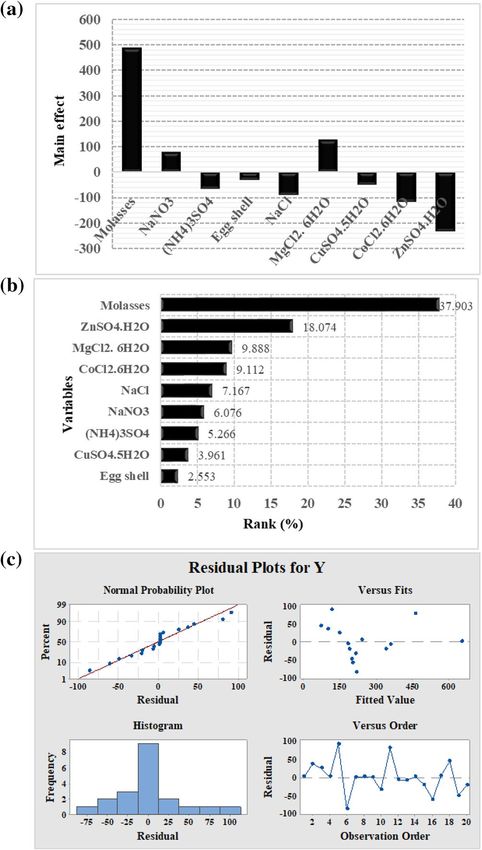
www.nature.com/scientificreports/
fied 16S rRNA gene (S.1.) has resulted in a 1211 bp nucleotide sequence. Analysis based on genome-derived
16S rRNA gene sequences in this study showed that the APSO isolate has a homology of > 99.92% relative to the
genus Lysinibacillus. The 16S rRNA gene sequences have been submitted to the national center for biotechnology
information (NCBI) GenBank with accession number MT975241. The 16S rRNA gene sequences of the refer-
ence taxa were retrieved from the NCBI GenBank and aligned using MEGA 7.0 for dendrogram construction.
The resultant tree topologies were evaluated by bootstrap analysis based on 500 replicates. The results of this
analysis (Fig. 2b) indicated that APSO formed a coherent branch within the genus Lysinibacillus, with a boot-
strap value of 100%. It also formed a robust cluster with strains of the genus Arenimonas and shared the highest
sequence similarity with Lysinibacillus sp. strain KDP-SUK-M5 (99.92%) and a query cover of 100%, so it could
be identified as Lysinibacillus sp. strain APSO. Lysinibacillus sp. strain APSO was characterized by a rod shape
(0.72 wide × 3.45 μm long), Gram-positive staining, and spherical endospore, as shown in Fig. 2c,d. Several ear-
lier studies reported that the Bacillus genus is one of the most authoritative ALP producers4,13.
Effects of physical parameters on ALP productivity. One of the factors that control ALP produc-
tion processes is the physical parameter. Temperature is one of the most critical environmental parameters for
controlling the physiological and biological activities of microorganisms; hence, it influences all bioprocess
operations14. To evaluate the optimal temperature for enhancing ALP productivity, the bacterial culture was
incubated at different temperatures (37 °C, 40 °C, and 45 °C) using a modified PVK broth m edium11 with egg-
shell powder. The results elucidated that ALP productivity gradually increased from 37 °C (29 U L −1) passing by
−1 −1
40 °C (41.5 U L ) until it reached the optimal activity peak at 45 °C with 209.61 U L . This finding was congru-
ent with earlier observations of Behera et al.13,15, who recorded that the maximal phosphatase production by
Serratia and Alcaligenes faecalis was accomplished at 45 °C. Recently, Abdelgalil et al.16 reported that the peak of
ALP production from Bacillus paralicheniformis strainAPSO was achieved at 45 °C.
ALP production depends greatly on the initial pH of the culture medium, as it can influence many enzy-
matic processes and nutrient transport across the cytoplasmic membrane. This study revealed that the optimal
ALP production was recorded at pH 6.0 and 7.0 (149.4 and 231.6 U L−1), and the gradual decline in enzyme
productivity (147.8, 106.3, and 63.2 U L −1) was obtained at pH 8.0, 9.0, and 10.0, respectively. The results were
in accordance with Jena et al. and Dhaked et al.18, who found that neutral pH (7.0) is the most suited for high
17
ALP production by Bacillus sp. In contrast, Abdelgalil et al.16 revealed that B. paralicheniformis strain APSO
exhibited maximal ALP production at pH 9.0, incompatible with this finding.
To optimize the inoculum size for improving ALP productivity, bacterial cells were grown on a series of acti-
vated precultured inoculum sizes (1%, 2%, 5%, and 10%). The results elucidated that a gradual decline in enzyme
production was observed as the inoculum size increased. Maximum ALP productivity was obtained using 1%
activated precultured inoculum size (343.4 U L−1), whereas a gradual decrease in productivity was noted as the
inoculum size increased by twofold (166.2 U L −1), 2.5-fold (137.1 U L
−1), and 3.5-fold (94.1 U L
−1) at 2%, 5%, and
19
10% inoculum sizes. This finding matched Qureshi et al. , who utilized 1% inoculum size for ALP production
by Escherichia coli EFRL 13 in submerged fermentation. In contrast, the optimal inoculum size for the highest
ALP throughout was recorded at 5% of the preactivated culture of B. paralicheniformis strain APSO16.
Statistical optimization of ALP production by Lysinibacillus sp. strain APSO. Medium optimi-
zation has reached new horizons with the development of statistical technologies, as these strategies increase
the productivity of the process, minimize production time and labor expense, and contribute to improving the
overall economy of the process. To optimize the ALP production process, the following experimental design
strategies are highly recommended: First, Plackett–Burman design (PBD) was employed to evaluate the rela-
tive significance of cultivation variables of the respective ALP production system (Screening). Table 1 shows
the randomized PBD matrix selected to screen the most significant variables for ALP production along with
the corresponding experimental and predicted response (ALP productivity). Table 1 shows a noticeably broad
variation in ALP productivity throughout different trials ranging from 14.8 to 959.4 U L −1, reflecting the sig-
nificance of medium optimization for improving ALP productivity. The highest ALP activity was achieved at
trial 17 followed by trials 16 and 7 that contained molasses and MgCl2·6H2O at the highest level. This inferred
that molasses and M gCl2·6H2O are the most significant variables for ALP stimulation by Lysinibacillus sp. strain
APSO. In contrast, trial 5 that contained the lowest level of molasses and M gCl2·6H2O showed unremarkable
activity (14.8 U L−1), demonstrating the significance of molasses and MgCl2·6H2O on the production process.
Analysis of variance (ANOVA) results provided the weight of each independent variable for the investigated
response, as shown in Table 2.
The probability (p) value was utilized to conclude the main nutrimental factors at a confidence level of > 95%,
as summarized graphically in Fig. 3. The lower probability value (p < 0.05) and the larger t-value indicated
that the process variable significantly affects ALP yield, and p-values > 0.05 indicate that the model terms are
nonsignificant. Based on ANOVA, the most significant factors that positively influence ALP production were
molasses (X1) with a contribution ratio of 99.99 and p = 0.00000063, followed by MgCl2·6H2O (X6) with a con-
tribution ratio of 96.383 and p = 0.036. The third significant variable in the production process was NaNO3 (X2)
with a contribution ratio of 82.5 and p = 0.174 (Table 2). The insignificant factors with a low contribution ratio
and p > 0.05, which negatively influenced the production process, including eggshell powder, C uSO4·5H2O,
(NH4)3SO4, NaCl, C oCl2·6H2O, and ZnSO4·H2O, were neglected in a further study. A standardized Pareto chart
(Fig. 3b) was employed to determine the influence of the most important parameters. It was constructed by bars
with a length proportional to the absolute value of the estimated effects divided by the standard error. The bars
are presented in order of the effect size, with the largest effects on top.
Scientific Reports | (2021) 11:17564 | https://doi.org/10.1038/s41598-021-96563-6 4
Vol:.(1234567890)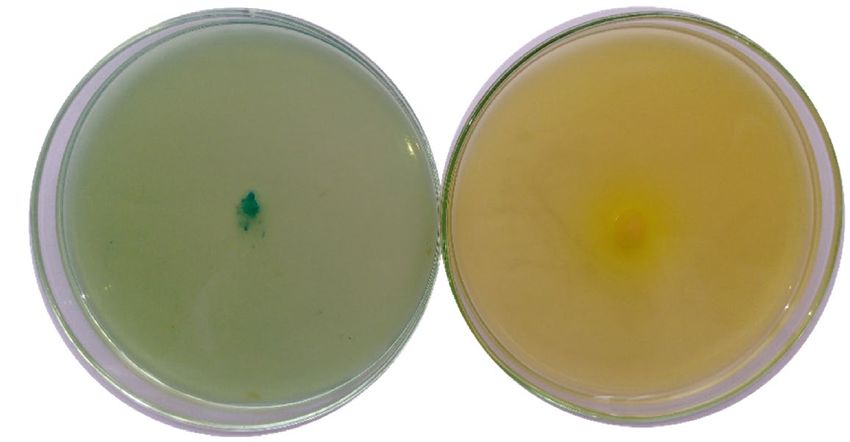
www.nature.com/scientificreports/
Variables ALP productivity (U L−1 min−1)
Trials X1 X2 X3 X4 X5 X6 X7 X8 X9 Actual value Predicted value Residual
1 −1 −1 −1 −1 1 1 −1 −1 1 30.228 30.26852 − 0.04052
2 1 −1 1 −1 −1 −1 −1 1 1 221.5278 297.0267 − 75.4989
3 −1 1 −1 −1 1 1 1 1 −1 90.68889 172.3118 − 81.6229
4 1 1 1 −1 1 −1 1 −1 −1 562.2222 580.8505 − 18.6283
5 −1 −1 1 1 −1 −1 1 −1 −1 14.86222 76.08983 − 61.2276
6 1 −1 −1 1 −1 −1 1 1 1 250.5556 281.0313 − 30.4757
7 1 1 −1 1 −1 1 −1 −1 −1 928.8889 885.1152 43.77368
8 1 1 1 1 1 1 1 1 1 244.4444 326.3203 − 81.8759
9 0 0 0 0 0 0 0 0 0 211.6889 276.7231 − 65.0342
10 −1 −1 −1 1 1 −1 −1 1 −1 25.09613 − 14.3436 39.4397
11 1 −1 −1 1 1 1 1 −1 1 331.5278 432.7664 − 101.239
12 1 −1 1 −1 1 −1 −1 −1 −1 531.6667 553.7209 − 22.0543
13 −1 1 1 1 1 −1 1 −1 1 38.92778 − 169.648 208.5757
14 −1 −1 1 1 1 1 −1 1 −1 63.55556 44.93015 18.6254
15 −1 −1 1 −1 −1 1 1 1 1 48.70556 − 112.977 161.6824
16 1 1 1 1 −1 1 −1 1 −1 777.6389 700.7556 76.88334
17 1 −1 −1 −1 −1 1 1 −1 −1 959.4444 789.1495 170.295
18 −1 1 −1 1 −1 −1 −1 −1 1 27.5814 40.55455 − 12.9731
19 −1 1 1 −1 −1 1 −1 −1 1 25.58502 132.56 − 106.975
20 1 1 −1 −1 1 −1 −1 1 1 488.8889 350.5623 138.3266
21 0 0 0 0 0 0 0 0 0 207.7778 276.7231 − 68.9453
22 −1 1 −1 −1 −1 −1 1 1 −1 71.43889 137.416 − 65.9772
23 0 0 0 0 0 0 0 0 0 211.6889 276.7231 − 65.0342
Coded and actual levels
Variable Code −1 0 1
Molasses X1 1 4.5 10
NaNO3 X2 0.1 0.3 0.5
(NH4)3SO4 X3 0.1 0.3 0.5
Eggshell X4 0.2 1.1 2
NaCl X5 0.1 0.3 0.5
MgCl2·6H2O X6 0.02 0.11 0.2
CuSO4·5H2O X7 0.0005 0.0015 0.0025
CoCl2·6H2O X8 0.0005 0.0015 0.0025
ZnSO4·H2O X9 0.0005 0.0015 0.0025
Table 1. Randomized PBD for evaluating factors influencing ALP production by Lysinibacillus sp. strain
APSO.
In this study, ANOVA of PBD demonstrated that the model was highly significant, as evident from a Fisher’s
F-test value of 12.91 with a very low probability value (p = 0.0000399; Table 2). This implied that there was a sta-
tistically significant relationship between the variables at the 99.999999% confidence level. Statistical R2 showed
that the fitted model explained 90% of ALP activity variation. Furthermore, the highest value of the adjusted R2
statistic (82%; Table 2) indicated that the model was highly significant, and the correlation between experimental
variables and ALP productivity was more precise and reliable. The first-order polynomial model describing the
correlation between the nine factors and ALP productivity could be expressed as follows:
Yactivity = 276.72+243X1 +38.95X2 −33.76X3 −16.36X4 −45.94X5 +63.39X6 −25.39X7 −58.41X8 −115.87X9
The important graphical method to detect and explain whether the obtained data set is normal or deviates
from normality is the normal probability p lot20. In this study, residuals were plotted against the expected normal
values of the model, as illustrated in Fig. 3c. The normal probability chart clearly showed that residuals were
distributed normally; the points were distributed nearly to the diagonal line. This indicated that the expected ALP
productivity was well fitted with experimental results. To assess the accuracy of PBD, a confirmation experiment
was performed. The culture conditions predicted to be optimum for maximal ALP production from Lysinibacillus
sp. APSO were pH 6.45, temperature 45 °C, inoculum size 1% v v−1, agitation speed 200 rpm, incubation time
48 h, and medium of the following composition: molasses, 10 g L −1; NaNO3, 0.5 g L
−1; and M gCl2·6H2O, 0.2 g
L−1. The maximal ALP activity obtained under these optimal conditions was 3208.333 U L −1, higher than ALP
activity obtained before application of PBD (343 U L −1) by ~ 9.3-fold.
Scientific Reports | (2021) 11:17564 | https://doi.org/10.1038/s41598-021-96563-6 5
Vol.:(0123456789)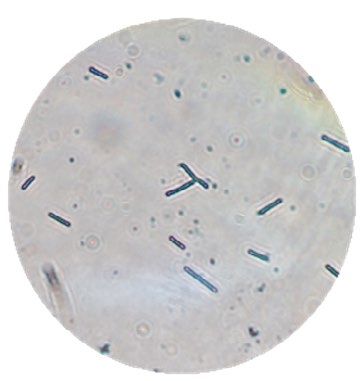
www.nature.com/scientificreports/
Variables Coefficient Main effect SE t-Stat P-value Confidence level (%)
Intercept 276.7230 25.30831 10.93407 6.32436E−08 99.99999
X1 243.0068 486.0136 27.14014 8.953775 6.38265E−07 99.99993
X2 38.95678 77.91356 27.14014 1.435393 0.1747964 82.52035
X3 − 33.76013 − 67.5202 27.14014 − 1.24391 0.2354926 76.45073
X4 − 16.36588 − 32.7317 27.14014 − 0.60301 0.5568738 44.31261
X5 − 45.94911 − 91.8982 27.14014 − 1.69303 0.1142609 88.57390
X6 63.39699 126.7939 27.14014 2.33591 0.0361627 96.38372
X7 − 25.39197 − 50.78394 27.14014 − 0.93559 0.3665408 63.34591
X8 − 58.41969 − 116.8393 27.14014 − 2.15251 0.0507224 94.92775
X9 − 115.8765 − 231.7530 27.14014 − 4.26956 0.0009134 99.90865
ANOVA df SS MS F Significance F
Regression 9 1,711,860 190,206 12.91134 0.0000399
Residual 13 191,512 14,731
Total 22 1,903,373
R2 0.90
Adjusted R2 Square 0.8297
Table 2. Statistical analysis of PBD showing coefficient values, t-values, and ρ-values for each variable
affecting ALP production.
There are very few reports on the optimization of bacterial ALP production using statistical and experimental
PBD. Pandey et al.21 reported the optimization of a physical parameter only for enhancing ALP production by
B. licheniformis. Glucose, yeast extract, and agitation were reported to enhance maximal ALP production from
Geobacillus thermodenitrificans I2 isolate, whereas NaCl, ZnSO4, and CuSO4 contributed negatively; this finding
matched that in this study22. The other published articles depended on the one-factor-at-a-time (OFAT) method
to optimize bacterial ALP production.
The most published articles used a synthetic medium and applied the OFAT method for bacterial ALP pro-
duction. In addition, the use of an agro-industrial waste-based medium for ALP production has been poorly
investigated. To the authors’ knowledge, Abdelgalil et al.16 were the first investigators to utilize an agro-industrial
waste to boost ALP production from B. paralicheniformis strain APSO. They demonstrated that the most signifi-
cant variables that directly enhanced ALP production by PBD are molasses, ( NH4)2SO4, and KCl; this finding
was consistent with this study. Adopting this trend, this study directed to the ultimate beneficial utilization
of agro-industrial and food waste and low-cost nutrimental variables for enhancing bacterial ALP output on
laboratory-scale production to reduce the cost of the production process through complicated statistical opti-
mization strategies.
Compared to the results obtained by other investigators, Qureshi et al.19 reported that 2% sodium nitrate had
the strongest influence on ALP from E. coli EFRL 13 among other variables used (tryptone, ammonium chloride,
and potassium nitrate). Furthermore, molasses (15 g L −1) and sodium nitrate were utilized for improving ALP
production from rhizospheric bacterial i solates23. In contrast to this study, Parhamfar et al.11 documented that
maximal ALP production from Bacillus spp. was achieved by glucose (10 g L −1) and ammonium sulfate (5 g L −1)
as the carbon and nitrogen source. Additionally, Jatoth et al.4 found that starch (5 g L −1) and egg albumin (5 g
L−1) were suited and acted as enhancers of ALP production from B. subtilis.
Response surface methodology (RSM). Based on the fit of empirical models to the experimental data
in relation to the experimental design, collections of mathematical and statistical approaches expressed as RSM
are utilized. To maintain high-efficiency and profitable bioprocesses, microbial industry sponsors are recom-
mended to utilize RSM approaches during production24. To determine the optimal response region of ALP
productivity, the most significant independent variables that positively affect ALP production as identified by
PBD design results (molasses, N aNO3, and MgCl2·6H2O with contribution percentages of 99.99%, 82.52%, and
96.38%, respectively) were explored more via the application of central composite design (CCD) with uniform
precision by five levels for each parameter. Consequently, the intercorrelations among independent variables and
their optimal levels were evaluated via regression analysis of this approach.
Table 3 illustrates the array of the design matrix for a total number of 20 experiential exploratories of CCD-
uniform precision with different combinations of the three independent factors along with experimental and
theoretically predicted results of ALP production with residuals. In contrast, the other variable according to the
PBD results exerted a negative effect on the ALP production process; hence, these insignificant variables were
omitted from further optimization by uniform precision-CCD to improve enzyme production and diminish the
final cost of the production process. The six axial points, eight factorial points, and six center points formed a
precision random array for CCD in 20 empirical probationary for optimizing the picked variables. To assess the
experimental errors, the six center point replicates were conducted. The findings indicated considerable varia-
tion in the potency of ALP activity depending on the three independent factor variations. ALP activities ranged
from 935 to 5316.66 U L −1 based on the observed data. In Table 3, center point experimental trials (numbers
Scientific Reports | (2021) 11:17564 | https://doi.org/10.1038/s41598-021-96563-6 6
Vol:.(1234567890)www.nature.com/scientificreports/
Figure 3. PBD results: (a) main effect of culture variables, (b) Pareto chart illustrating the order and
significance of the variables affecting ALP production by Lysinibacillus sp. strain APSO in a ranking percentage
from 2.553 to 37.903, and (c) normal probability plot of the residuals for ALP production determined by the
first-order polynomial equation.
1, 4, 7–9, and 14) that comprise zero-level molasses, NaNO3, and MgCl2·6H2O concentrations (30, 0.6, and
0.45 g L−1, respectively) were recorded to have the highest ALP yield with an approximate activity of 5306.47 to
5316.66 U L−1. In contrast, the lowest ALP titer was achieved at the highest molasses (50 g L−1) concentration
and middle N aNO3 (0.6 g L −1) and MgCl2·6H2O (0.45 g L
−1) concentrations with an ALP activity of 935 U L −1.
19
This resulted from the suppression effect of molasses, as reported by Qureshi et al. . The theoretically forecasted
ALP productivity was in line with the experimentally achieved ALP activity.
Multiple regression analysis and ANOVA. Arithmetic operators of multiple regression statistical analy-
sis and ANOVA computations, a critical approach to evaluating the significance and adequacy of the quadratic
regression model, were employed to analyze and interpret the CCD-uniform precision experimental data results
as enumerated in Table 4. In Table 4, the determination coefficient R2-value of this regression model was 0.964,
indicating that 96.40% of the disparity in ALP productivity was attributed to the independent variables and only
3.60% of the total disparity created by variables could not be explained by the model and could not explain ALP
activity. This regression model is trustworthy to reflect reality correlations between independent nutrimental
variables that influence ALP throughput.
Additionally, the model’s precision to calculate the predicted ALP output and a significant correlation between
the observed and fitted values for ALP production was confirmed by the coefficient of multiple correlations (mul-
tiple R) of 0.982 and the adjusted determination coefficient value (adjusted R2) of 0.933 and predicted R2-value
Scientific Reports | (2021) 11:17564 | https://doi.org/10.1038/s41598-021-96563-6 7
Vol.:(0123456789)www.nature.com/scientificreports/
Variables ALP productivity (U L−1 min−1)
StdOrder Trials Type X1 X2 X3 Actual value Predicted value Residual
17 1 Center 0.000 0.000 0.000 5315.3023 5302.5 12.74796686
8 2 Factorial 1.000 1.000 1.000 1102.0370 806.44 295.5874
2 3 Factorial 1.000 − 1.000 − 1.000 1403.5185 1203.5 199.9446
18 4 Center 0.000 0.000 0.000 5316.6604 5302.5 14.10599
5 5 Factorial − 1.000 − 1.000 1.000 1670.3703 930.84 739.5271
9 6 Axial − 1.6817 0.000 0.000 1073.5185 1775.6 − 702.117
16 7 Center 0.000 0.000 0.000 5309.1912 5302.5 6.63686
15 8 Center 0.000 0.000 0.000 5306.4752 5302.5 3.92082
20 9 Center 0.000 0.000 0.000 5309.8702 5302.5 7.31587
14 10 Axial 0.000 0.000 1.6817 1464.6296 1747.07 − 282.447
3 11 Factorial − 1.000 1.000 − 1.000 4406.5185 3758.03 648.4854
1 12 Factorial − 1.000 − 1.000 − 1.000 1432.0370 1485.1 − 53.1299
13 13 Axial 0.000 0.000 − 1.6817 2851.8518 2912.2 − 60.4404
19 14 Center 0.000 0.000 0.000 5316.6604 5302.5 14.1059
11 15 Axial 0.000 − 1.6817 0.000 1360.7407 1529.44 − 168.708
4 16 Factorial 1.000 1.000 − 1.000 1140.7407 1637.81 − 497.069
7 17 Factorial − 1.000 1.000 1.000 1994.2592 1951.74 42.5128
10 18 Axial 1.6817 0.000 0.000 935 575.770 359.229
6 19 Factorial 1.000 − 1.000 1.000 1218.1481 1624.17 − 406.027
12 20 Axial 0.000 1.6817 0.000 2578.8888 2753.06 − 174.179
Coded and actual levels
Variables Code −1.6817 −1 0 1 1.6817
Molasses X1 10 20 30 40 50
NaNO3 X2 0.2 0.4 0.6 0.8 1
MgCl2.6H2O X3 0.15 0.3 0.45 0.6 0.75
Table 3. Matrix design for Lysinibacillus sp. strain APSO CCD-uniform precision.
Term Estimate Std Error t-Ratio Prob >|t| Confidence level (%)
Intercept 5302.554 194.5854 27.250 1.9264E−08 100
X1 − 356.7224 129.1031 − 2.7630 0.02002 97.9976
X2 363.78493 129.1031 2.8177 0.01822 98.1770
X3 − 346.42114 129.1031 − 2.683 0.02296 97.7037
X1*X2 − 459.65740 168.6812 − 2.7250 0.021375 97.8624
X1*X3 243.73148 168.6812 1.4449 0.17907 82.0926
X2*X3 − 312.99074 168.6812 − 1.8555 0.093196 90.6803
X1*X1 − 1459.0671 125.6786 − 11.609 3.98486E−07 99.9999
X2*X2 − 1117.6905 125.6786 − 8.8933 4.60585E−06 99.9995
X3*X3 − 1051.0717 125.6786 − 8.3632 7.96433E−06 99.9992
df SS MS F Significance F
Regression 9 62,414,086 6,934,898 30.46608 4.15431E−06
Residual 10 2,276,268 227,626
Total 19 64,690,354
R2 0.964
Adjusted R2 0.933
Table 4. Statistical analysis of CCD-uniform precision showing coefficient values, t-values, and p-values for
each variable on ALP activity.
of 0.709. Furthermore, the model’s significance, fitness, and reliability determined by the low percentage of the
coefficient of variation value (16.89%) and the root mean square error and mean values were 477 and 2825,
respectively. Adequate precision measured the signal-to-noise ratio; a precision value of 14.008 indicated an
adequate signal, and this model could be used to navigate the design space. ANOVA revealed the chosen model
to be fabulously relevant, as obvious from the low probability p of 0.00000415 and the Fisher’s F-test of 30.4660,
Scientific Reports | (2021) 11:17564 | https://doi.org/10.1038/s41598-021-96563-6 8
Vol:.(1234567890)www.nature.com/scientificreports/
computed as the ratio of mean square regression and mean square residual. The higher the F-value is, the higher
is the connotation of the model. p-values, F-values, and t-test were utilized for data interpretation, verification of
the significance for each variable, and recognition of the mutual interaction dynamics between variables under
investigation as illustrated in the fit summary results (Table 4). Furthermore, the interrelation between two
variables can be either positive or negative to the response depending on the signs of the variable coefficients.
A negative sign implies an antagonistic effect, but the synergistic or complementary effect of two variables
on the response is demonstrated by a positive sign. Accordingly, the antagonistic or oppositional effect (negative
coefficients) was apparent in the mutual interaction between molasses (X1) and sodium nitrate (X2) together
with the mutual interaction between sodium nitrate ( X2) and M gCl2·6H2O (X3), with F-values (7.42 and 3.44,
respectively), p-values (0.0214 and 0.0932, respectively), and t-values (− 2.7250 and − 1.8555, respectively) with
confidence levels (97.8% and 90.6%, respectively). Based on the negative sign of a coefficient, these mutual inter-
action effects are nonsignificant model terms and do not improve the response. In contrast, mutual interaction
between molasses ( X1) and M gCl2·6H2O (X3) had a synergistic and significant effect on ALP productivity, obvi-
ously from the F-value of 2.09 and t-test value of 1.4449. Although its p-value and contribution percentage were
0.179 and 82%, respectively, it was a positive coefficient sign, contributing to the elevation and enhancement
of ALP production. Another point worth mentioning is that the linear coefficients of sodium nitrate (X2) had
highly significant effects on ALP productivity, as manifested from p-value (0.0182), F-value (7.94), and t-value
(2.817) with confidence level (98.17%). Although the linear coefficients of molasses ( X1) and MgCl2·6H2O (X3)
together with the quadratic effects of molasses ( X12), NaNO3 (X22), and MgCl2·6H2O (X32) were characteristic of
the negative sign of coefficients, they had not significantly contributed to the enhancement of ALP production
by the strain under study. Arithmetic indications for their significance degrees were computed as follows: p-value
(0.02, 0.022, 0.00000039, 0.0000046, and 0.0000079, respectively), F-value (7.63, 7.2, 134.7, 79, and 69.9, respec-
tively), and t-test (− 2.76, − 2.68, − 11.6, − 8.89, and − 8.36, respectively) with confidence level (97.99%, 97.7%,
99.99%, 99.99%, and 99.99%, respectively). The second-order polynomial function fitted to the experimental
results of ALP productivity was employed for predicting the optimal point within experimental constraints as
in the following equation:
Y = 5302.55−356.72X1 +363.78X2 −346.42X3 −459.65X1 X2 +243.73X1 X3 −312.99X2 X3 −1459X21 −1117.69X22 −1051.07X23
where Y is the predicted response (ALP activity), and X
1, X2, and X
3 are the coded levels of the independent
variables of molasses, N
aNO3, and MgCl2·6H2O, respectively.
Model adequacy checking. Some empirical statistics were conducted to ensure that the model was appro-
priate to meet the assumptions of the analysis. To illustrate whether the residuals follow a normal distribution
or deviated from it, the distribution residuals were drawn against a theoretical normal distribution through the
normal probability plot. As shown in the normal probability plot of the studentized residuals in Fig. 4a, the plot-
ted points are located nearly to a straight line without linearity, indicating that the model has been well fitted
with the experimental results. In contrast, most of the findings clustered in the center and the values distant from
the general mean dwindled on both sides of the center peak equally. Extreme residual values are not preferred on
both sides. Additionally, the residual versus predicted response chart was constructed and is depicted in Fig. 4b,
through which randomly scattered residuals around the horizontal zero-line reference were observed and no
particular patterns could be identified. In essence, this implied that the residuals are not correlated and dis-
tributed independently and thus have constant variance, meaning that the model is adequately compliant with
the study’s postulations. This indicated a good fit of the model for ALP production by Lysinibacillus sp. APSO.
Moreover, plotting the predicted values against the actual data sets (Fig. 4c) revealed that the data sets were
divided evenly down the 45° parallel. This could help detect if the model cannot smoothly predict some value(s);
however, all data points are measurable, guaranteeing model aptness. Figure 4d clarifies the Box-Cox graph.
The best λ-value (− 0.39) was represented by the green line, and this transformation (λ = 1) was denoted by the
blue line, whereas the red lines symbolized the lowest and highest values of confidence intervals between − 1.09
and 1.7. Because the λ best value was between the values of confidence intervals, no recommendation for data
transformation was required due to the blue line between the two red lines. This revealed that the model was well
appropriate to the obtained experimental data.
Contour and three‑dimensional (3D) plots. After the preceding assurance of model appropriateness,
the interactive effects of the three measured variables were defined. Also, the optimal values of each independent
variable needed for maximal ALP production were calculated through the construction and visualization of 3D
surface and outline contour chart by plotting ALP activity on the Z-axis against two of the variables while keep-
ing the third variable at the center point, as shown in Fig. 5.
The 3D surface and contour plot of Fig. 5a shows ALP productivity efficacy as a function of molasses ( X1) and
NaNO3 (X2) concentrations with maintained MgCl2·6H2O concentration at zero levels (0.45 g L−1). The high-
est point for ALP activity was situated around the center points of molasses, out of this range; rather, low ALP
productivity was noticed. Further, ALP activity was enhanced with increments of NaNO3 concentrations until
reaching its optimum, but the higher level supporting low ALP activity was remarked. The maximal predicted
pinpoint of ALP output was estimated through the software program of the point prediction option. The maximal
predicted ALP activity of 5363.26 U L −1 was attained at the optimal predicted molasses (28.23 g L −1) and NaNO3
(0.645 g L−1) concentrations at a MgCl2·6H2O concentration of 0.45 g L −1. The same trend of ALP productiveness
was noticed for the pairwise combination of molasses ( X1) and M gCl2·6H2O (X3) with zero levels of N
aNO3 (X2)
0.6 g L−1. In Fig. 5b, the highest ALP throughput was recorded at a low MgCl2·6H2O (0.4 g L−1) concentration
near the middle point; the molasses concentration increased, resulting in a declining trend of ALP productivity.
Scientific Reports | (2021) 11:17564 | https://doi.org/10.1038/s41598-021-96563-6 9
Vol.:(0123456789)www.nature.com/scientificreports/
Figure 4. Model adequacy checking of CCD-uniform precision: (a) normal probability plot of the residuals,
(b) externally studentized residuals versus predicted ALP production, (c) plot of predicted versus actual ALP
production, and (d) Box-Cox plot of model transformation.
Beyond the optimal center point of X1 and X3, their lower and higher levels caused a relative increase in ALP
yield. Therefore, by solving Eq. (3) and analyzing Fig. 5b, using a zero-level N aNO3 (0.6 g L−1) concentration at
the predicted optimal molasses (28.23 g L −1) and M gCl2·6H2O (0.41 g L −1) concentrations contributed to the
utmost ALP predicted productivity of 5354.8 U L−1. The 3D plot and the corresponding contour plot (Fig. 5c)
highlighted the effects of NaNO3 (X2) and MgCl2·6H2O (X3) concentrations on ALP production at 30 g L−1 of
zero-level molasses (X1) concentration. ALP activity increased progressively at a low NaNO3 concentration,
accompanied by increasing MgCl2·6H2O concentrations to its optimum; then, ALP production declined. The
greatest ALP throughput was clearly supported at the center level of MgCl2·6H2O (X3), passing the optimal points
of its concentration; whether an increase or decrease, it will lead to a reduction in productivity. By solving Eq. (3)
and analyzing Fig. 5c, the maximal predicted ALP activity of 5368.31 U L−1 was attained at the optimal predicted
NaNO3 (0.64 g L−1) and MgCl2·6H2O (0.41 g L −1) concentrations at a molasses concentration of 30 g L−1.
Verification of the experimental model. To estimate the optimal combinations of the variables under
investigation, which ameliorate ALP productivity, response optimization was carried out to augment the effi-
cacy of Lysinibacillus sp. APSO ALP. The optimal predicted molasses (28.23 g L−1), NaNO3 (0.64 g L−1), and
MgCl2·6H2O (0.41 g L −1) concentrations for boosting the efficacy of ALP production in the fermentation medium
−1
to 5413.91 U L were predictable and theoretically based on the equation of the quadratic model. Laboratory
Scientific Reports | (2021) 11:17564 | https://doi.org/10.1038/s41598-021-96563-6 10
Vol:.(1234567890)www.nature.com/scientificreports/
Figure 5. 3D response surface representing ALP activity yield (U L−1 min−1) from Lysinibacillus sp. strain APSO
as affected by culture conditions: (a) interaction between MgCl2·6H2O and NaNO3, (b) interaction between
molasses and M gCl2·6H2O, and (c) interaction between molasses and NaNO3.
validation via bench-scale experiments was utilized to confirm the theoretical data results of the optimization
process, revealing that the practical ALP activity of 5683 U L−1 was near that obtained theoretically by the regres-
sion equation of the model (5413.91 U L−1) with 104.97% accuracy, confirming the model’s authenticity. Hence,
the ultimate culture conditions and medium composition were molasses, 28.23 g L−1; NaNO3, 0.64 g L−1; and
MgCl2·6H2O, 0.41 g L−1, and the pH was adjusted to 7.0 by 1 M NaOH with 1% old activated preculture inocu-
lum. The inoculated medium was incubated at 45 °C and 200 rpm for 24 h.
Compared to the results cited by other investigators, very few investigators dealt with statistical optimiza-
tion strategies for improving ALP productivity. Pandey et al.21,25 were the only researchers who exploited CCD
to enhance the production process of ALP from B. licheniformis. In 201021, they documented the optimization
strategies of physical variables that influence ALP productivity. Their study revealed that the maximal ALP
yield of 792.043 U m L−1 was achieved at pH 8.0, temperature of 36.7 °C, fermentation time of 78 h, and orbital
speed of 165 rpm. In 201225, the same team recorded that the predicted glucose (2.39%), peptone (1.35%), yeast
extract (0.15%) concentrations were obtained from the theoretical calculation of the regression model of CCD
for enhancing the B. licheniformis ALP output. They documented that the correlation coefficient (R2) was found
to be 0.932 (93.2%). Recently, through the regression model of rotatable-CCD by Abdelgalil et al.16, the highest
predicted ALP productivity (3753.27 U L −1) produced from B. paralicheniformis strain APSO could be attained
using molasses, ( NH4)2NO3, and KCl concentrations of 30, 0.79, and 1.2 g L −1, respectively.
Scale‑up fermentation strategies for Lysinibacillus sp. APSO ALP. The improvement of ALP
productivity is needed, and the biomass necessary for sufficient yield is economically limited unless the phos-
phatase-specific activity is augmented. Therefore, the opportunity for optimizing growth conditions, which give
the highest specific phosphatase activity, was taken26.
Cell growth kinetics and ALP production in shake‑flask under batch conditions. Before moving
forward to bioreactor cultivations, this study intended to determine the correlations between the specific growth
rate of the culture and the ALP production rate via a cell growth kinetics study in a shake-flask cultivation sys-
Scientific Reports | (2021) 11:17564 | https://doi.org/10.1038/s41598-021-96563-6 11
Vol.:(0123456789)www.nature.com/scientificreports/
Parameters Shake flask cultivation Uncontrollable pH Batch Cultivation Controllable pH Batch Cultivation
Growth parameters
Xmax-conc. (g L−1) 0.90666 1.03223 0.70292
µ (h−1) 0.115 0.18875 0.127883
µMax (h−1) 0.776909 0.52260 0.4633217
dX/dt (g L−1 h−1) 0.0440305 0.068482 0.035143
Production parameters
Pmax (U L−1) 6365.74 7119.44 5795.37
Pmax.specific (U g−1) 1292.4222 1435.889 1215.026
Pmax.time (h) 20 15 20
Qp (U L−1 h−1) 588.703 605.5555 387.764
-Qs (g L−1 h−1) 0.26068 0.989393 0.559922
-Qs (g L−1 h−1) 0.0004169 0.0017068 0.000805
Yield coefficient parameters
Yp/s (U g−1) 965.85 1123.62 639.93
Yx/s (g g−1) 0.07 0.11 0.04
Overall cultivation time (h) 30 22 26
Table 5. Cell growth kinetics and ALP production parameters by Lysinibacillus sp. strain APSO as affected
by different cultivation strategies. Xmax-conc maximal cell dry weight, dx/dt cell growth rate, µ specific growth
rate, Pmax maximal ALP production, Pmax,specific specific productivity, Qp ALP production rate, Qs substrate
consumption rate, Yp/x (U g−1) ALP produced/g biomass, Yp/s (U g−1) ALP produced/g substrate consumed, Yx/s
(g g−1) biomass produced/g substrate consumed.
tem, which could likely be referred to for the bioreactor strategy for batch cultivation. Table 5 illustrates the cell
growth kinetics and ALP production parameters by Lysinibacillus sp. strain APSO affected by different cultiva-
tion strategies. Batch growth kinetics of Lysinibacillus sp. strain APSO followed a typical growth pattern, and
ALP was produced simultaneously with cell growth, as shown in Fig. 6a. This finding was analogous to Butler
et al.27 and Abdelgalil et al.16, who found that phosphatase production increased during exponential growth of a
Citrobacter sp. and B. paralicheniformis strain APSO, respectively.
Initial lag-phase cells experienced exponential growth with a growth rate of 0.044 (g L −1 h−1) and a specific
growth rate (µ) of 0.115 h−1. The culmination of biomass production (0.906 g L −1) was achieved at 28 h culti-
vation period with an obvious yield coefficient Yx/s (0.07 g of cells/g of the substrate), surpassing this point,
driving cell growth to stationary phase. The volumetric ALP production and protein content were concurrent
with the cell growth pattern. Both increased gradually until reaching their zenith (6365.74 U L−1 and 4.92 g L−1,
respectively) with production rate Qp (588.703 U L−1 h−1), specific productivity Pmax,specific (1292 U g−1), and yield
coefficient Yp/s (965.85 U g−1) at 20 h incubation time. A gradual decline in ALP activity and protein content
was observed beyond this time. Meanwhile, due to cell growth, proliferation, and the essential role of ALP in
phosphate transportation and m etabolism25, a notable decrease in total carbohydrate and total phosphatase
concentrations was found from their initial concentrations of 14.71 and 0.027 g L−1 to reach 5.03 and 0.0003 g
L−1, with a consumption rate of − 0.26068 and 0.0004169 g L −1 h−1, respectively. From the pH profile throughout
the fermentation process (Fig. 6a), at the first 10 h incubation period, considered a lag-phase period, a gradual
elevation in the initial pH of the culture medium from 6.4 to 7.6 occurred but decreased to 7.0 at 18 h. After that
time, the pH increased again with up-down fluctuations to reach 8.0 at 30 h cultivation time. This pH change
was accompanied by a gradual increase of bacterial growth, ALP productivity, and protein content to reach their
own climax. This resulted from the influence of pH on bacterial growth or pH-dependent control of the gene
expression for enzyme s ynthesis19.
There was an obvious need for metal ions to promote ALP productivity. Chaudhuri et al.2 reported that the
regulatory control was mainly carried out by metal ion chelation necessary for enzyme production or stabiliza-
tion. As noticed from the heavy metal survey throughout the cultivation period via atomic absorption spec-
trometry (AAS) analysis, the concentration of some metal ions, such as C u+, Pb+, Fe+, Zn+, Mg+, Sn+, and Ni+,
was synchronous with ALP productivity. In contrast, the apex of their concentrations (4.04, 20.36, 51.1, 5.835,
1530, 287.9, and 5.25 mg L −1) was achieved when the peak of ALP production was obtained, which was 20 h
incubation time. After transcending this point, their concentrations decreased until the end of the fermentation
period, as shown in Table 6. Li+ reached its peak (1.27 mg L −1) at the end of cultivation time after up-down fluc-
tuations throughout the fermentation period, there was no change observed in C o+, Cr+, and M n+ concentrations
2+ −1
throughout the fermentation period, and C d ions were consumed early to < 0.0335 mg L during the growth
course. This finding was in agreement with that recorded by Abdelgalil et al.16, who noticed that the growth of B.
paralicheniformis strain APSO was associated with an increment in S n+, Zn+, Mg+, and M n+ ion concentrations,
reaching their peak of 283, 22, 652.5, and 4.27 mg L −1 at 26 h, at the peak of ALP output. There was no change
in Co+ and Cr+ concentrations throughout the fermentation period.
Cell growth kinetics and ALP production in the bioreactor under uncontrolled pH batch condi‑
tions. The scale-up strategy is required to reproduce the culture characteristics and kinetic parameters from
Scientific Reports | (2021) 11:17564 | https://doi.org/10.1038/s41598-021-96563-6 12
Vol:.(1234567890)www.nature.com/scientificreports/
0.030 16 1.0 7000 6.0
Biomass (g L-1)
-1 -1
ALP activity (U L min ) 6000
0.025 14 Protein content (g L-1)
0.8 Total carbohydrate (g L )
-1
Total carbohydrate (g L-1)
5.5
ALP activity (U L min )
Total phosphate (g L-1)
-1
Total phosphate (g L )
Protein content (g L-1)
5000
-1
0.020 12
Biomass (g L-1)
-1
0.6
a)
4000
0.015 10 5.0
3000
0.4
0.010 8
2000
4.5
0.2
0.005 6
1000
0.000 4 0.0 0 4.0
0 5 10 15 20 25 30 35
Time (h)
0.030 16 1.2 10000 6.0
Biomass (g L-1)
-1 -1
ALP activity (U L min )
14 Protein content (mg mL )
-1
0.025 1.0 Total carbohydrate (g L )
-1 5.5
-1
8000
Total phosphate (g L )
Total carbohydrate (g L-1)
12
ALP activity (U L-1min-1)
Total phosphate (g L-1)
Protein content (g L-1)
0.020 0.8 5.0
Biomass (g L-1)
10
6000
0.015 8 0.6 4.5
b)
4000
6
0.010 0.4 4.0
4
2000
0.005 0.2 3.5
2
0.000 0 0.0 0 3.0
0 5 10 15 20 25
Time (h)
9 120 400 1.6
Dissolved Oxygen (%) 1.4
100 Agitation (rpm)
Aeration (VVM)
8 pH 300 1.2
Dissolved oxygen (%)
80
Aeration (VVM)
Agitation (rpm)
1.0
c)
pH
7 60 200 0.8
0.6
40
6 100 0.4
20
0.2
5 0 0 0.0
0 5 10 15 20 25 30
Time (h)
Figure 6. Monitoring of Lysinibacillus sp. strain APSO growth and ALP productivity in (a) a shake-flask scale
cultivation condition and (b) a 7 L stirred-tank bioreactor under uncontrolled pH conditions. (c) Online data
(DO, agitation, airflow rate, and pH) as a function of time during batch fermentation in the bioreactor under
uncontrolled pH conditions.
shake-flasks to fermenters. Therefore, the cultivation kinetics of Lysinibacillus sp. strain APSO was monitored in
a 7 L stirred-tank bench-top bioreactor (Bioflo 310; New Brunswick Scientific, Edison, NJ, USA) under uncon-
trolled pH for further development and optimization. Knowledge of the fermentation process kinetics may be
valuable for improving the performance of batch processes. Finally, product yield and substrate conversion are
the most significant criteria toward p roductivity28. The results showed great similarity in the growth and ALP
production pattern to those achieved in the shake-flask counterpart (Fig. 6b).
A significant improvement was seen in cell growth and enzyme production under uncontrolled pH batch
cultivation conditions. The peak of cell biomass production (1.0322 g L−1) was achieved at 18 h incubation
time, earlier than those in shake-flasks by ~ 10 h, whereas the stationary phase started beyond this point at 20 h
Scientific Reports | (2021) 11:17564 | https://doi.org/10.1038/s41598-021-96563-6 13
Vol.:(0123456789)www.nature.com/scientificreports/
Incubation time (h)
Metal ions (mg L−1) 0 6 10 14 20 30
Co < 0.0982 < 0.0982 < 0.0982 < 0.0982 < 0.0982 < 0.0982
Cu 0.997 0.75 1.0325 1.637 4.04 0.9075
Pb < 0.2696 < 0.2696 < 0.2696 < 0.2696 20.36 < 0.2696
Fe 8.392 24.25 10.8 24.155 51.1 22.26
Ni < 0.3662 5.712 < 0.3662 4.34 5.25 1.5625
Cd 0.05 < 0.0335 < 0.0335 < 0.0335 < 0.0335 < 0.0335
Zn 2.16 3.18 3.756 4.695 5.835 2.3825
Mg 630 543.75 596.25 517.5 1530 1046.25
Mn < 0.0627 < 0.0627 < 0.0627 < 0.0627 < 0.0627 < 0.0627
Li 0.3275 0.782 0.395 0.426 0.865 1.27
Sn 72 38.75 139.4 174.62 287.9 147.3
Cr < 0.7276 < 0.7276 < 0.7276 < 0.7276 < 0.7276 < 0.7276
Table 6. Flame AAS for heavy metal analysis of shake-flask batch cultivation.
incubation time. Cells growing exponentially with a growth rate of 0.068482 g L−1 h−1 and a specific growth
rate (µ) of 0.18875 h−1 showed a yield coefficient Y x/s of 0.11 g cells/g substrate), considerably higher than those
achieved by shake-flask cultivation. Further, ALP production and protein content were simultaneous with the
growth pattern. The peak volumetric ALP productivity was accomplished at 15 h cultivation with an activity of
7119.44 U L−1 and a production rate Qp of 605.55 U L−1 h−1, which were about 111.83% and 102.86%, respectively,
higher and earlier than those in shake-flask cultivation by ~ 5 h. Moreover, considerable elevation in ALP yield
coefficient Yp/s of 1123.62 U g −1 was noticed, about 1.16 times higher than the obtained counterpart. It is note-
worthy that growth and ALP production patterns were accompanied by substrate consumption patterns. With
cell growth and enzyme productivity increased progressively, substrate consumption also increased, leading to a
trend of total carbohydrate and total phosphate concentrations decreasing from their initial concentrations (14.71
and 0.027 g L−1, respectively) to reach their minimal concentrations (1.42 and 0.00038 g L−1, respectively) at the
end of the cultivation period. This was accompanied by an increasing consumption rate of total carbohydrate
and total phosphate (− 0.98 and − 0.0017 g L −1 h−1, respectively) by > 3.79- and 4.1-fold, respectively, than those
in shake-flask cultivation. Compared to the findings of Abdelgalil et al.16, ALP throughput of 6650.9 U L−1 and µ
of 0.0943 h−1 were achieved at 8 h incubation time of B. paralicheniformis strain APSO under uncontrolled pH
batch cultivation conditions in 7 L stirred-tank bioreactor.
Gupta et al.29 reported that changes in oxygen availability might lead to drastic effects on fermentation kinet-
ics. Therefore, in this investigation, dissolved oxygen (DO) availability in the culture medium was monitored
throughout the cultivation period. Figure 6c shows that the DO percentage at lag phase times of 2 and 4 h was
100% and 96%, respectively. Once bacterial cells moved toward the exponential phase, the DO percentage
declined sharply, reaching 0.7% at the mid-exponential phase (10 h) due to actively growing cells. After this
point, it was at a steady state from 12 to 20% until 15 h. This was synchronous with ALP peak production. At
the late log-phase and the beginning of the stationary phase, it increased again in obvious increments, reaching
88.9% at the end of the fermentation period. Additionally, the tracking of the culture medium pH showed the
same pattern as those in the shake-flask counterpart. A noticeable decline in pH values from 6.45 to 5.96 was
noticed at the initial lag-phase period from incubation time. After 6 h, a gradual increase in the culture medium
pH was observed, reaching 8.07 at the end of the fermentation period. This matched that of previous shake-flask
cultivation.
Based on the above results, a > 111.83% improvement of peak volumetric productivity was achieved, higher
than in shake-flask cultivation (6365.74 U L−1 at 20 h). These enhancements in efficiency resulted from good
cultivation of oxygenation and involvement conditions and the vessel’s bioreactor capacity. However, maximal
volumetric productivity increased by 148.18% from that in shake-flask cultivation (4488.266 U L−1 at 26 h) by
B. paralicheniformis strain APSO15.
Cell growth kinetics and ALP production in the bioreactor under controlled pH batch condi‑
tions. Based on previous results, uncontrolled pH batch cultivation showed the best conditions for improv-
ing and enhancing volumetric and specific ALP productivity. In this study, Lysinibacillus sp. strain APSO was
forced to grow under controlled pH culture conditions (pH 6.45) through a batch cultivation system in a 7 L
stirred-tank bench-top bioreactor (Bioflo 310) to evaluate the influence of constant pH value on the growth
and productivity characteristic features. Figure 7a shows the relations between cell growth, enzyme production,
and substrate consumption as a function of time for batch fermentation of Lysinibacillus sp. strain APSO under
controlled pH conditions. In Fig. 7a, the general patterns show an analogy with those in shake-flask cultivation.
As pointed out in previous cultivation conditions, the ascending increment of cell growth was noticed at 6 h
cultivation period with a growth rate of 0.035143 g L−1 h−1 until reaching its peak (Xmax = 0.702 g L−1) at 24 h,
about 22.51% and 31.9% lower than that in shake-flask and uncontrolled pH batch cultivation, respectively. Fur-
thermore, the lowest yield coefficient Yx/s (0.04 g cells/g substrate) was obtained compared to previous culture
conditions.
Scientific Reports | (2021) 11:17564 | https://doi.org/10.1038/s41598-021-96563-6 14
Vol:.(1234567890)You can also read