ChemComm COMMUNICATION - Royal ...
←
→
Page content transcription
If your browser does not render page correctly, please read the page content below
ChemComm
This article is licensed under a Creative Commons Attribution-NonCommercial 3.0 Unported Licence.
View Article Online
COMMUNICATION View Journal | View Issue
A mitochondria-targeting NIR fluorescent potassium
ion sensor: real-time investigation of the
Cite this: Chem. Commun., 2020,
mitochondrial K+ regulation of apoptosis in situ†
Open Access Article. Published on 14 April 2020. Downloaded on 6/26/2020 4:10:00 PM.
56, 5405
Received 21st January 2020,
Accepted 20th March 2020 Guangjie Song,ab Di Jiang,b Lei Wang,a Juewei Ning,a Xiangzhong Sun,a
Fengyu Su,*c Meiwan Chen*b and Yanqing Tian *a
DOI: 10.1039/d0cc00579g
rsc.li/chemcomm
The first NIR fluorescent mitochondria-targeting K+ sensor, denoted apoptosis.5,6 However, most of these studies did not delve deeply
as TAC-Rh, was developed. The produced sensor consists of a into the organelle level to explore the relationship between
rhodamine analog as the fluorophore and triazacryptand (TAC) as mitochondrial K+ and apoptosis due to the lack of appropriate
the K+ recognition unit. Compared to the K+ sensors reported tools. Therefore, constructing a tool to trace in real time the flow
previously, TAC-Rh exhibits two unique optical properties: the of K+ in mitochondria would be expected to be very beneficial
largest Stokes shifts (120 nm) and the longest emission peak wave- for analyzing the relationship between mitochondrial K+ and
length (720 nm). With the assistance of this novel sensor, real-time apoptosis.
changes of K+ concentrations in mitochondria during apoptosis In previous measurements of mitochondrial K+ concentration,
were monitored for the first time. Moreover, it was also the first it was usually necessary to isolate mitochondria, a complex process
time that the relationship between mitochondrial K+ flux and apop- not feasible for determining the concentration of mitochondrial K+
tosis was investigated in real time using fluorescence imaging. in real time.7 Confocal laser scanning microscopy has turned out
to be an important tool for understanding the biological states of
The potassium ion (K+) is one of the predominant ions in living metal ions, and doing so in a damage-free manner with high time-
cells (about 150 mM), and is closely involved in many biological space resolution.8 However, currently, only a few K+ sensors have
processes, such as kidney function, nerve transmission, heart beat been prepared.9 Moreover, PBFI, the most common potassium
and muscle contraction.1 Yu et al. first proposed an association indicator, was reported to be interfered with by sodium to some
between apoptosis and the loss of intracellular potassium ions.2 In extent.10 Since He et al. first reported a K+ sensor using a highly
2016, Vodnala et al. discovered that an increase in the concen- selective triazacryptand (TAC) ligand as the K+-sensing moiety,11 a
tration of K+ in tumor microenvironments could reduce the activity few TAC-derived K+ sensors were further developed and used for
of T cells and prevent their anti-tumor function,3 and discovered in intracellular imaging of K+.9c,e,g,12
2019 that an increased concentration of K+ would also destroy T The emissions of most fluorescent sensors have been observed
cell metabolism and nutrient uptake, leading to a starvation state to occur in the ultraviolet visible (UV/Vis) range (400–700 nm in
known as autophagy.4 These discoveries opened up new avenues wavelength), leading to light-induced toxicity, and weak tissue
for developing therapies aimed at mobilizing the immune system penetration and resolution, when applied in vivo due to the auto
against cancer, with these efforts involving exploring the role of fluorescence and light absorption of biomolecules. It would be
K+ in these processes. Therefore, determination of intracellular preferable to pursue low-energy NIR fluorescent sensors to
potassium levels is essential. minimize light-induced toxicity, to lower the level of interference
More and more studies have found mitochondria to be from biomolecules, and deepen tissue penetration.13 However, the
involved in a variety of key events involving the regulation of fluorophores used for K+ sensors, including boron dipyrromethenes
(BODIPYs),9f,14 naphthalimides,9g,15 and other dyes,9b,16 have emis-
a
Department of Materials Science and Engineering Southern University of Science
sion wavelengths below 600 nm. So far, only four K+ fluorescent
and Technology, Shenzhen, 518055, China. E-mail: tianyq@sustech.edu.cn sensors with emission wavelengths of over 600 nm have been
b
State Key Laboratory of Quality Research in Chinese Medicine Institute of Chinese reported (Zhou et al., 2011, lmax em = 650 nm;9c Sui et al., 2015,
Medical Sciences, University of Macau, Macao 999078, China. lmax em = 650 nm;9e Müller et al., 2016, lmax em = 688 nm;9d Bandara
E-mail: mwchen@umac.mo
c
et al., 2017, lmax em = 680 nm17) (see Table S1 in ESI†). Although
Academy for Advanced Interdisciplinary Studies Southern University of Science and
Technology, Shenzhen, 518055, China. E-mail: fysu@sustech.edu.cn
these fluorescence emission wavelengths are partly situated in the
† Electronic supplementary information (ESI) available: Synthesis, additional NIR region (700–900 nm in wavelength), the peaks of all these
methods, and figures (Fig. S1–S21). See DOI: 10.1039/d0cc00579g fluorescence emissions are at wavelengths of shorter than 700 nm.
This journal is © The Royal Society of Chemistry 2020 Chem. Commun., 2020, 56, 5405--5408 | 5405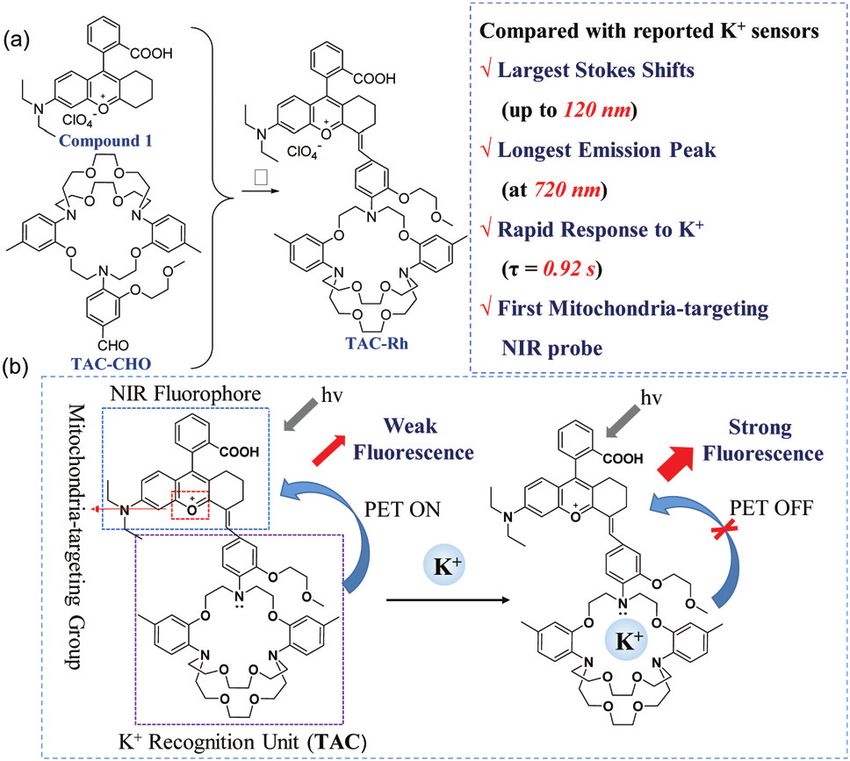
View Article Online
Communication ChemComm
Ideal intracellular K+ sensors should display the following the tertiary amino group of TAC acted as an electron donor and
characteristics:18 long-wavelength fluorescence, wide dynamic the rhodamine analog fluorophore served as an electron acceptor.
K+ detection range (100–300 mM), insensitivity to Na+ (5–15 mM The fluorescence quenching effect took place due to the photo-
in intracellular fluid) and other metal ions at physiological induced electron transfer (PET) (Fig. 1b) from TAC to the
This article is licensed under a Creative Commons Attribution-NonCommercial 3.0 Unported Licence.
concentrations, pH insensitivity, and rapid response. Our strategy rhodamine analog. As a result, TAC-Rh in free form displayed weak
was to integrate TAC for K+ recognition with a rhodamine analog as emission, while a significant fluorescence intensity increase occurred
an NIR fluorophore. Herein, TAC-Rh with a K+ detection range of 16 upon the addition of K+ because the complexation between TAC and
to 400 mM was designed and synthesized, enabling its suitable K+ effectively inhibited the fluorescence quenching from PET.
application for sensing intracellular K+. TAC-Rh is the first NIR Absorption and fluorescence titration experiments of TAC-Rh
fluorescent K+ sensor with a peak of emission wavelength of up to in a HEPES buffer containing centrimonium bromide (CTAB) as
720 nm, a value greater than those of all fluorescent K+ sensors a surfactant, which can increase the solubility of the probe, were
Open Access Article. Published on 14 April 2020. Downloaded on 6/26/2020 4:10:00 PM.
reported to date. And TAC-Rh in HEPES buffer shows a Stokes shift performed at various K+ concentrations. The acquired UV spectra
of 120 nm, also a value larger than those of all reported of the TAC-Rh–K+ complex show a stronger UV absorption than
potassium ion sensors. In addition, TAC-Rh with its positive that of the free TAC-Rh after the addition of K+ (Fig. S3, ESI†). As
charge preferentially accumulated in mitochondria, realizing exhibited in Fig. 2a and b, a remarkable fluorescence response at
in situ monitoring of mitochondrial K+ concentration. To date, 720 nm was observed with an excitation wavelength of 600 nm,
only two mitochondrion-targeting K+ sensors with short emission and the fluorescence response of TAC-Rh showed a linear
wavelengths have been reported by us.9h,12 And the sensors were relationship to log[K+] in the range 16–400 mM. The Kd value
only used to observe the fluxes of K+ in mitochondria, and were not was determined using the Benesi–Hildebrand plot to be 105 mM
used for exploring mitochondrial K+ regulation of apoptosis. In (Fig. S3b, ESI†),9c indicating the suitability of using TAC-Rh for
this work, the optical properties of TAC-Rh and its applications in monitoring intracellular K+ levels.
studying the relationship between mitochondrial potassium Any intracellular K+ sensor should be designed to be insensitive
concentration and apoptosis were investigated. to other metal ions at their intracellular physiological levels.
Fig. 1a shows the synthetic route to TAC-Rh. In brief, TAC-Rh Therefore, the fluorescence changes for TAC-Rh were tested in
was obtained by forming a covalent CQC bonds between TAC the presence of the following intracellular cations at their
and the rhodamine analog, in turn achieved by carrying out a respective physiological concentrations: Cu2+ (50 mM), Ca2+
condensation reaction of TAC-CHO9c with compound 1 in an (2 mM), Mg2+ (2 mM), Mn2+ (50 mM), Fe3+ (50 mM), Fe2+ (50 mM),
acetic anhydride solution. And the structure of TAC-Rh was
characterized by performing 1H NMR spectroscopy and high-
resolution mass spectroscopy (Fig. S1 and S2, ESI†).
Due to the electrostatic interaction resulting from the positively
charged cationic TAC-Rh and negative transmembrane potential of
mitochondria, most of the TAC-Rh was expected to localize in
the mitochondria.19 In the structure of the TAC-Rh molecule,
Fig. 2 Fluorescence titration spectra produced by gradually adding KCl at
concentrations from 0 to 400 mM to a solution of TAC-Rh (10 mM) in
HEPES/HCl buffer (pH 7.4, 5.0 mM)/CTAB (0.5 mM) and exciting the
solutions with light of a wavelength of 600 nm (a). Plot of the fluorescence
intensity of TAC-Rh at 720 nm versus K+ concentration. The inset shows
the relationship between the fluorescence intensity and K+ concentration
at concentrations between 16 and 400 mM and a fit of a line to these data
(R2 = 0.9924) (b). Fluorescence intensities at 720 nm of various solutions of
TAC-Rh (10 mM) containing different metal cations in HEPES buffer (pH 7.4,
5.0 mM)/CTAB (0.5 mM) (c). Fluorescence intensities at 720 nm of various
solutions of the TAC-Rh–K+ (200 mM) complex containing other metal
cations. The ions were from CuCl2 (50 mM), CaCl2 (2 mM), MgCl2 (2 mM),
MnCl2 (50 mM), FeCl3 (50 mM), FeCl2 (50 mM), ZnCl2 (2 mM), NaCl (15 mM),
Fig. 1 Rational design, synthetic route (a), and proposed PET process and KCl (200 mM), i.e., all of them at their respective intracellular physio-
(b) for TAC-Rh; I: acetic anhydride, 90 1C, 8 h. logical concentrations (d).
5406 | Chem. Commun., 2020, 56, 5405--5408 This journal is © The Royal Society of Chemistry 2020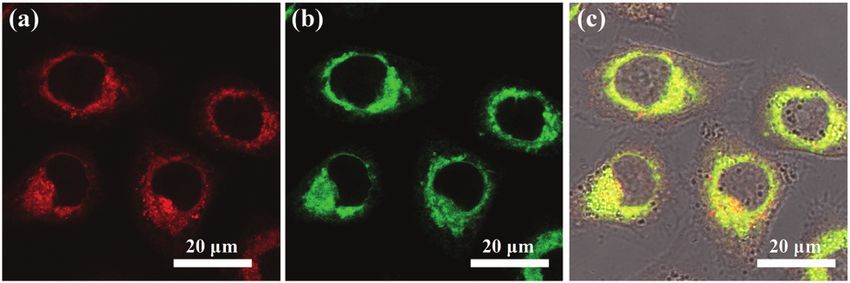
View Article Online
ChemComm Communication
Zn2+ (2 mM), Na+ (15 mM), and K+ (150 mM). The results mitochondria. Delayed mitochondrial K+ efflux was observed in
indicated that TAC-Rh showed little response to any of the the ionomycin- or nigericin-treated groups when the cells in
other intracellular cations (Fig. 2c), and it responded to K+ culture medium containing high concentrations of K+ compared
without interference in the presence of any of the above cations those containing a normal concentration of K+ (Fig. S12–S19,
This article is licensed under a Creative Commons Attribution-NonCommercial 3.0 Unported Licence.
(Fig. 2d). The fluorescence intensities of TAC-Rh and TAC-Rh– ESI†). The above phenomenon indicated that TAC-Rh can
K+ were also insensitive to pH over the range pH 5.0–9.0 (Fig. S4, respond in real time to mitochondrial K+ levels via fluorescence
ESI†). Notably, a remarkable fluorescence turn-on response was intensity changes.
observed almost immediately after adding of K+, revealing the D’Mello et al. pointed out that the depletion of potassium
rapid response of TAC-Rh to K+ (t95% = 0.92 s) (Fig. S5, ESI†). ions induced by ionomycin in cells could lead to cell shrinkage,
Based on the above satisfactory photophysical properties of activation of caspases, and DNA breakage, and finally cell
TAC-Rh in sensing K+, it was further applied to track potassium apoptosis.20 In this work, besides the observation of ionomycin-
Open Access Article. Published on 14 April 2020. Downloaded on 6/26/2020 4:10:00 PM.
fluxes in live cells (HeLa cells, MCF7 cells, and MDA-MB-231 induced mitochondrial K+ efflux by the designed sensor TAC-Rh,
cells) by recording fluorescence intensities in real time. The annexin V/FITC-PI staining was simultaneously performed to
cytotoxicity of TAC-Rh towards HeLa, MCF7 and MDA-MB-231 in situ monitor the apoptosis process. The results showed that
cells was first assessed by performing the 3-(4,5-dimethyl-2- along with the markedly decreased fluorescence intensity of TAC-
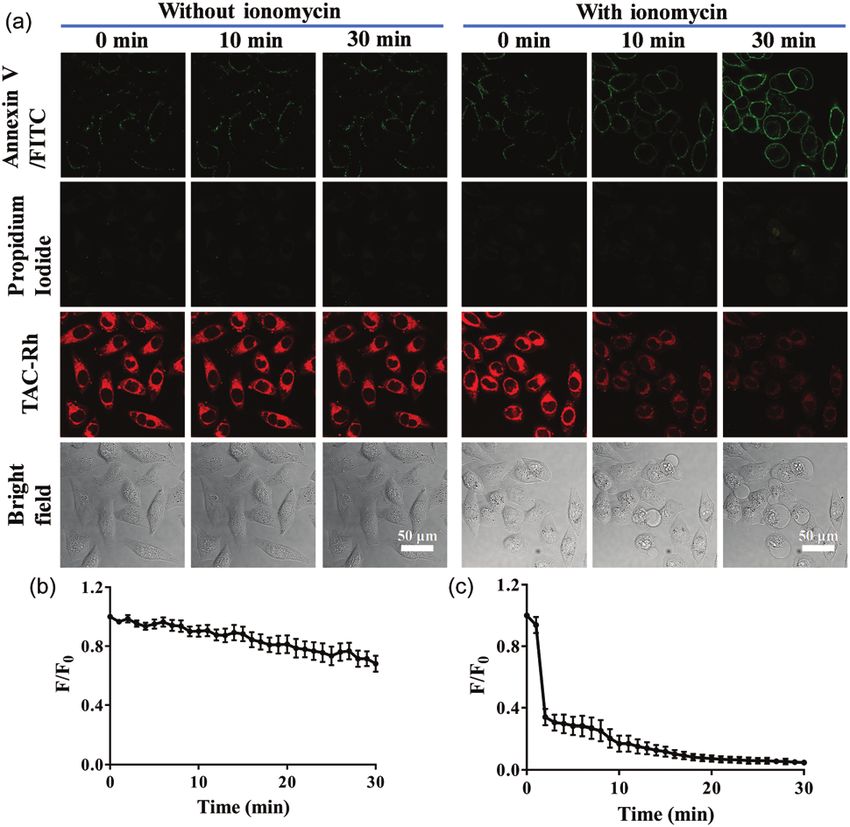
thiazolyl)-2,5-diphenyl-2-H-tetrazolium bromide (thiazolyl blue Rh within 10 min of treatment with ionomycin (Fig. 4a and c), the
tetrazolium bromide, MTT)-based colorimetric assay. After being fluorescence signal of annexin V/FITC indicating early-stage apop-
incubated with TAC-Rh at a concentration of 3 mM for 2 h, the tosis gradually strengthened. And the typical characteristics of cell
viability of each of the three cell lines was over 95% (Fig. S8, apoptosis including cell shrinkage and membrane blebbing were
ESI†), suggesting that TAC-Rh had no marked cytotoxicity toward observed in the bright field, but the positive PI signals indicating
the three cell lines under these experimental conditions. late-stage apoptosis or dead cells did not appear until B30 min
The ability of TAC-Rh to target mitochondria was then of treatment with ionomycin. The results indicated that mito-
assessed by evaluating the colocalization of TAC-Rh using chondrial K+ efflux and early-stage apoptosis occurred almost
MitoTracker Green (MTG, a commercial mitochondrial marker). simultaneously in the presence of ionomycin. In contrast, cells
The results showed that TAC-Rh mainly localized in mitochondria in control groups without drug stimulation only showed a small
with a Mander’s overlap co-efficiency of 0.94 (Fig. 3). decrease in fluorescence intensity within 30 min, and no significant
After the demonstration of the specific colocalization of morphological changes were observed (Fig. 4a and b). According to
TAC-Rh in mitochondria, TAC-Rh was used to monitor mito- these results, we can infer that a potential correlation may exist
chondrial K+ fluxes. Three kinds of cells (HeLa, MCF7 and between mitochondrial K+ efflux and early-stage apoptosis.
MDA-MB-231 cells) internalized with TAC-Rh (3 mM) for 30 min Furthermore, while a reactive oxygen species (ROS)-induced
were treated with ionomycin or nigericin, which can effectively apoptosis has been indicated to trigger a large amount of
induce K+ efflux. The intensity of the fluorescence of TAC-Rh in potassium ions flowing out of the cytoplasm,21 levels of K+ in
the single ionomycin or nigericin groups significantly decreased mitochondria during apoptosis have remained undetermined
within 2 min, as did the rate of efflux of mitochondrial K+ in real time owing to the lack of organelle-specific K+ sensors.
(Fig. S12–S19, ESI†). While as a control, fluorescence signals in Since TAC-Rh was determined to be an excellent mitochondria-
all three of these cells without any treatment showed relatively targeting fluorescent K+ sensor, we further applied it to real-
small decreases in 10 min (Fig. S9–S11, ESI†). Furthermore, time monitoring of mitochondrial K+ changes in the H2O2-induced
mitochondrial K+ effluxes could be obviously delayed by treating apoptotic model. The results showed that compared with the
the cells with ionomycin/nigericin in an extracellular environ- control group (without H2O2), the cells of the H2O2-treated group
ment having a high concentration of K+, which was supposed to were shriveled and the green fluorescence of FITC generally
have an inhibitory effect on potassium ion efflux owing to the increased; meanwhile, the intensity of the overall red fluorescence
decreased [K+] gradient between the insides and outsides of the of TAC-Rh declined gradually, indicating the ability of the
apoptosis induced by H2O2 to trigger mitochondrial potassium
ion efflux (Fig. S20, ESI†). This was the first time that mito-
chondrial K+ has been imaged in real time during the process
of apoptosis.
As a high concentration of extracellular K+ can reduce apoptosis
and prolong survival of some cells by decreasing the [K+] gradient
between the inside and outside of cells,22 achieving a delayed
apoptosis by increasing the concentration of extracellular K+
was further carried out. As can be seen in Fig. S21 (ESI†),
Fig. 3 Confocal fluorescence microscope images of HeLa cells co-stained in contrast to the noticeable weakening of the fluorescence of
with MitoTracker Green FM and TAC-Rh (3 mM). Red emission from TAC-Rh
TAC-Rh and the obvious strengthening of FITC signals in the
(a). Green emission from MitoTracker Green FM (b). Overlay of MitoTracker
Green and TAC-Rh (c). Excitation filter: 638 nm for TAC-Rh, 488 nm for
normal culture medium within 8 min of ionomycin stimulation,
Mito-Tracker Green. Emission: 650–750 nm for TAC-Rh, 500–550 nm for negligible small changes were observed in the red fluorescence
Mito-Tracker Green. of TAC-Rh and the green fluorescence of FITC as well as in the
This journal is © The Royal Society of Chemistry 2020 Chem. Commun., 2020, 56, 5405--5408 | 5407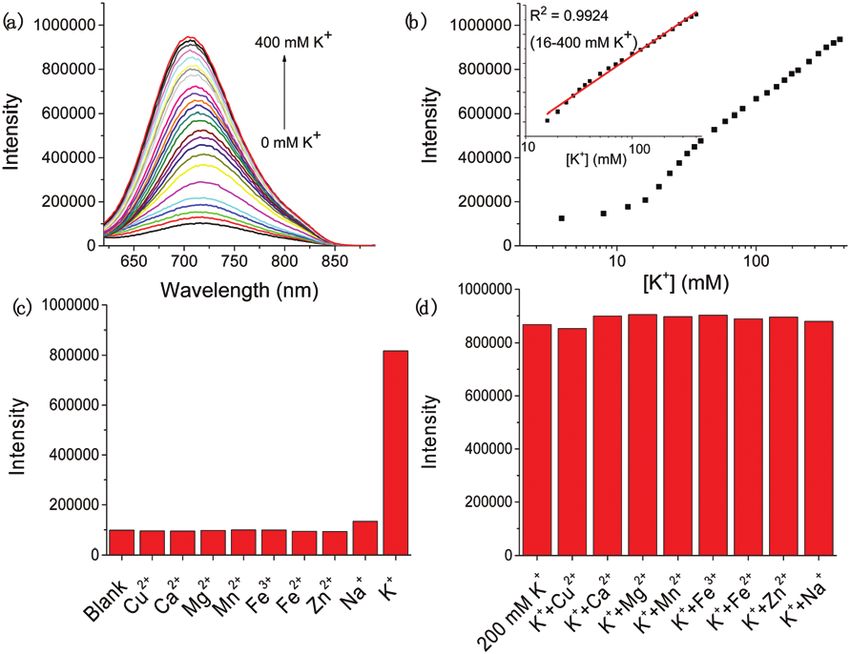
View Article Online
Communication ChemComm
fundamental research programs (JCYJ20170412152922553),
the Macao Science and Technology Development Fund (083/
2017/A2), and the Research Fund of the University of Macau
(MYRG2016-00130-ICMS-QRCM, MYRG2017-00182-ICMS).
This article is licensed under a Creative Commons Attribution-NonCommercial 3.0 Unported Licence.
Conflicts of interest
There are no conflicts to declare.
Notes and references
Open Access Article. Published on 14 April 2020. Downloaded on 6/26/2020 4:10:00 PM.
1 C. M. Lopez, A. E. Pineiro, N. Nunez, A. M. Avagnina, E. C. Villaamil
and O. E. Roses, Pharmacol. Res., 2000, 42, 599.
2 S. P. Yu, C. H. Yeh, S. L. Sensi, B. J. Gwag, L. M. Canzoniero, Z. S.
Farhangrazi, H. S. Ying, M. Tian, L. L. Dugan and D. W. Choi,
Science, 1997, 278, 114.
3 R. Eil, S. K. Vodnala, D. Clever, C. A. Klebanoff, M. Sukumar, J. H.
Pan, D. C. Palmer, A. Gros, T. N. Yamamoto, S. J. Patel, G. C.
Guittard, Z. Yu, V. Carbonaro, K. Okkenhaug, D. S. Schrump, W. M.
Linehan, R. Roychoudhuri and N. P. Restifo, Nature, 2016, 537, 539.
4 S. K. Vodnala, R. Eil, R. J. Kishton, M. Sukumar, T. N. Yamamoto,
N. H. Ha, P. H. Lee, M. Shin, S. J. Patel, Z. Yu, D. C. Palmer,
Fig. 4 Time-dependent confocal fluorescence microscopy images of M. J. Kruhlak, X. Liu, J. W. Locasale, J. Huang, R. Roychoudhuri,
HeLa cells stimulated without and with ionomycin (20 mM) into culture T. Finkel, C. A. Klebanoff and N. P. Restifo, Science, 2019, 363, 135.
medium stained with annexin V/FITC, propidium Iodide and TAC-Rh (a). 5 R. A. J. B. S. Gottlieb, Receptors, 2001, 10, 147.
Average fluorescence intensity ratio (i.e., F/F0) values of TAC-Rh without 6 C. Brenner and G. Kroemer, Science, 2000, 289, 1150.
ionomycin (b) and with ionomycin (c) as measured using Image J, with F0 7 R. A. Eliseev, J. D. Salter, K. K. Gunter and T. E. Gunter, Biochim.
denoting the average fluorescence intensity at t = 0 min, and F the average
Biophys. Acta, Bioenerg., 2003, 1604, 1.
8 (a) F. Gottfert, T. Pleiner, J. Heine, V. Westphal, D. Gorlich, S. J. Sahl
fluorescence intensity at a given time point. Excitation filter: 488 nm for
and S. W. Hell, Proc. Natl. Acad. Sci. U. S. A., 2017, 114, 2125; (b) N. Ji,
annexin V/FITC, 552 nm for PI, 638 nm for TAC-Rh; emission: 493–540 nm Nat. Methods, 2017, 14, 374.
for annexin V/FITC, 600–650 nm for PI, 650–750 nm for TAC-Rh. 9 (a) G. Song, R. Sun, J. Du, M. Chen and Y. Tian, Chem. Commun.,
2017, 53, 5602; (b) P. Padmawar, X. Yao, O. Bloch, G. T. Manley and
A. S. Verkman, Nat. Methods, 2005, 2, 825; (c) X. Zhou, F. Su, Y. Tian,
cell morphology in medium containing 80 mM KCl. These C. Youngbull, R. H. Johnson and D. R. Meldrum, J. Am. Chem. Soc.,
2011, 133, 18530; (d) B. J. Müller, S. M. Borisov and I. Klimant, Adv.
phenomena demonstrated that high concentrations of extra- Funct. Mater., 2016, 26, 7697; (e) B. Sui, X. Yue, B. Kim and K. D.
cellular K+ could simultaneously inhibit the outflow of K+ from Belfield, ACS Appl. Mater. Interfaces, 2015, 7, 17565; ( f ) B. Sui,
mitochondria as well as early-stage apoptosis. X. Yue, M. G. Tichy, T. Liu and K. D. Belfield, Eur. J. Org. Chem.,
2015, 1189; ( g) X. Zhou, F. Su, W. Gao, Y. Tian, C. Youngbull,
In summary, we have developed the first mitochondria-targeting R. H. Johnson and D. R. Meldrum, Biomaterials, 2011, 32, 8574;
NIR fluorescence K+ sensor (TAC-Rh) by integrating a NIR rhod- (h) J. Ning and Y. Tian, Sens. Actuators, B, 2020, 307, 127659.
amine analog with the K+-binding group TAC. The fluorescence 10 S. K. Yao, Y. Qian, Z. Q. Qi, C. G. Lu and Y. P. Cui, New J. Chem.,
2017, 41, 13495.
intensity of TAC-Rh showed an excellent [K+]-dependent response 11 P. Padmawar, X. Yao, O. Bloch, G. T. Manley and A. S. Verkman, Nat.
and a linear relationship with log[K+] in the [K+] range 16–400 mM, Methods, 2005, 2, 825.
features suitable for detecting changes in mitochondria K+ concen- 12 X. Kong, F. Su, L. Zhang, J. Yaron, F. Lee, Z. Shi, Y. Tian and
D. R. Meldrum, Angew. Chem., Int. Ed., 2015, 54, 12053.
tration. The large Stokes shift and NIR emission of TAC-Rh mini- 13 (a) J. Li and K. Pu, Chem. Soc. Rev., 2019, 48, 38; (b) D. Wu, L. Chen,
mized the photo-bleaching, light-induced injury, and interference W. Lee, G. Ko, J. Yin and J. Yoon, Coord. Chem. Rev., 2018, 354, 74;
by hemoglobin oxygenation and the cellular fluorescence back- (c) G. Hong, A. L. Antaris and H. Dai, Nat. Biomed. Eng., 2017, 1.
14 (a) W. Namkung, P. Padmawar, A. D. Mills and A. S. Verkman, J. Am.
ground. Due to these excellent performance measures, TAC-Rh Chem. Soc., 2008, 130, 7794; (b) M. Baruah, W. Qin, R. A. Vallee,
was found to be an excellent material to explore mutual regulation D. Beljonne, T. Rohand, W. Dehaen and N. Boens, Org. Lett., 2005,
between mitochondrial K+ flux and apoptosis. This study indicated 7, 4377.
15 H. He, M. A. Mortellaro, M. J. P. Leiner, R. J. Fraatz and J. K. Tusa,
that (1) HeLa cells treated with ionomycin could result in J. Am. Chem. Soc., 2003, 125, 1468.
excessive mitochondrial K+ efflux accompanied by apoptosis, 16 R. D. Carpenter and A. S. Verkman, Eur. J. Org. Chem., 2011, 1242.
(2) H2O2-induced apoptosis would trigger a large amount of K+ 17 H. M. D. Bandara, Z. Hua, M. Zhang, S. M. Pauff, S. C. Miller,
E. A. C. Davie and W. R. Kobertz, J. Org. Chem., 2017, 82, 8199.
flux out of mitochondria, and (3) ionomycin-induced mitochondrial 18 (a) J. Li, D. Yim, W. D. Jang and J. Yoon, Chem. Soc. Rev., 2017,
K+ efflux and apoptosis could be inhibited by increasing the K+ 46, 2437; (b) J. Yin, Y. Hu and J. Yoon, Chem. Soc. Rev., 2015, 44, 4619.
concentration in culture medium. Therefore, TAC-Rh was shown to 19 W. Xu, Z. Zeng, J. H. Jiang, Y. T. Chang and L. J. A. C. Yuan, Angew.
Chem., Int. Ed., 2016, 55, 13658.
offer a novel strategy to understand mitochondrial K+ changes 20 S. R. D’Mello, C. Galli, T. Ciotti and P. Calissano, Proc. Natl. Acad.
during apoptosis, and further investigations using TAC-Rh would Sci. U. S. A., 1993, 90, 10989.
help researchers derive more information about apoptosis. 21 C. C. Vu, C. D. Bortner and J. A. Cidlowski, J. Biol. Chem., 2001,
276, 37602.
The authors would like to thank the National Natural Science 22 S. R. D’Mello, C. Galli and T. Ciotti, Proc. Natl. Acad. Sci. U. S. A.,
Foundation of China (21774054, 21574061), the Shenzhen 1993, 90, 10989.
5408 | Chem. Commun., 2020, 56, 5405--5408 This journal is © The Royal Society of Chemistry 2020You can also read


