City of Bellingham 2018-2022 Consolidated Plan
←
→
Page content transcription
If your browser does not render page correctly, please read the page content below
City of Bellingham
2018-2022
Consolidated Plan
May 29, 2018

Covers the period from July 1, 2018 – June 30, 2023

This is a public summary version of the City of Bellingham Consolidated Plan. The full version of the
Consolidated Plan submitted to HUD is available in the same locations as this version, mirroring as closely
as possible what is submitted digitally to HUD through their Integrated Disbursement and Information
System (IDIS). Please contact the Community Development Division, Department of Planning &
Community Development, at cd@cob.org with any questions or comments, or visit http://www.cob.org.
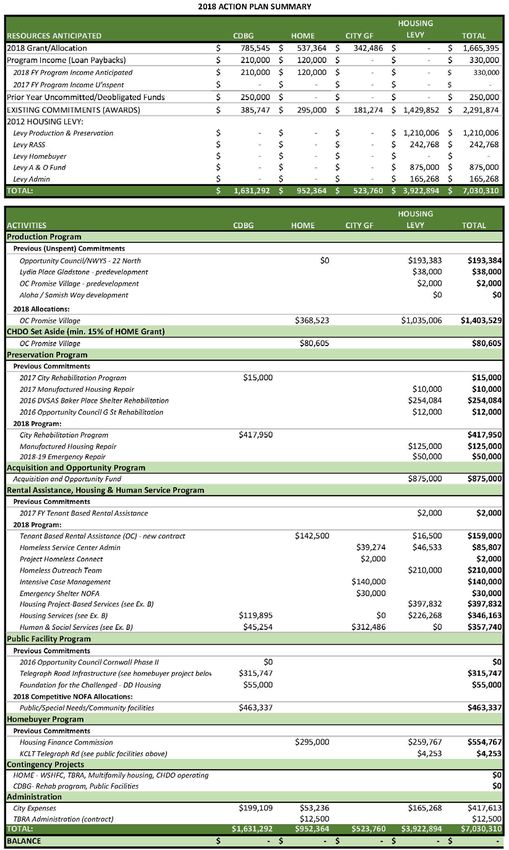
Table of Contents
I.          A Note about Data Sources ................................................................................... 3
II.         Executive Summary............................................................................................... 4
III.        Public Participation ............................................................................................... 7
IV.         Community Profile ............................................................................................... 11
      Demographics ............................................................................................................................................................... 11
      Population growth and housing demand ................................................................................................................. 13
      Incomes.......................................................................................................................................................................... 14

V.          Housing Market Assessment ............................................................................... 16
      Analysis of housing stock............................................................................................................................................ 16
      Programs and services ................................................................................................................................................. 21
      Housing needs .............................................................................................................................................................. 22

VI.         Homelessness Assessment ................................................................................... 27
      Homeless facilities and services ................................................................................................................................. 27
      Homeless housing needs ............................................................................................................................................. 28

VII. Community Development Assessment ................................................................ 31
      Job market analysis....................................................................................................................................................... 31
      Poverty by neighborhood ........................................................................................................................................... 33
      Community development needs ................................................................................................................................ 36

VIII. Special Needs Assessment ................................................................................... 39
      Elderly population ........................................................................................................................................................ 39
      Disabled population ..................................................................................................................................................... 41
      Victims of domestic violence ..................................................................................................................................... 43
      Persons with behavioral health needs ....................................................................................................................... 44
      Other special needs populations ................................................................................................................................ 46

IX.         Strategic Plan ........................................................................................................ 47
      HUD and Levy Goals.................................................................................................................................................. 47
      Consolidated Plan goals and priorities ...................................................................................................................... 49
      Resources and contingencies ...................................................................................................................................... 53
      Barriers to affordable housing .................................................................................................................................... 56
      Discussion ..................................................................................................................................................................... 58

CITY OF BELLINGHAM 2018-2022 CONSOLIDATED PLAN – MAY 29, 2018                                                                                                                           1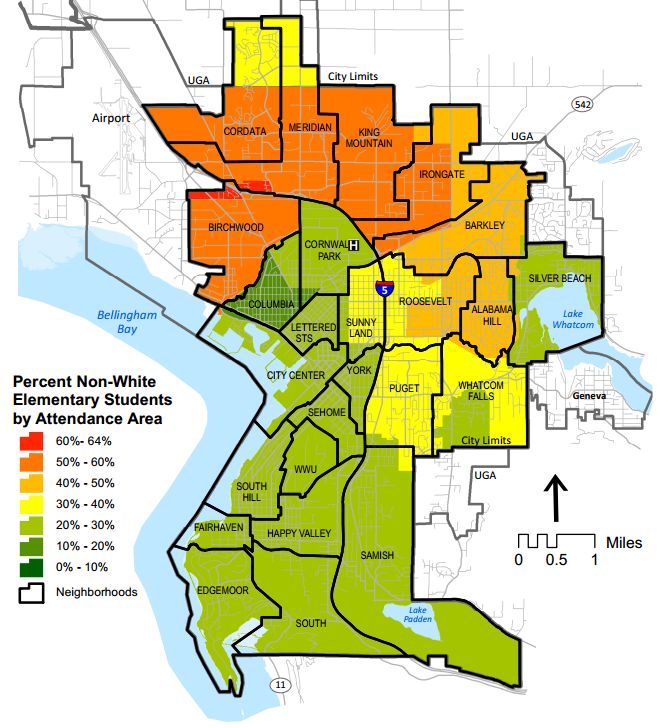
X.         2018 Action Plan ................................................................................................... 60
     Expected Resources ..................................................................................................................................................... 61
     2018 Projects Summary ............................................................................................................................................... 63

XI.        Appendices ........................................................................................................... 65
     Appendix 1. Public comments ................................................................................................................................... 65
     Appendix 2. Affordable housing inventory ............................................................................................................. 80

CITY OF BELLINGHAM 2018-2022 CONSOLIDATED PLAN – MAY 29, 2018                                                                                                                 2
A Note about Data Sources
The City of Bellingham receives federal funds through the U.S. Department of Housing and Urban
Development (HUD). HUD provides a certain amount of default data for use in the development of the
Consolidated Plan. Most of the data tables supplied by HUD are from the 2009-2013 American Community
Survey (ACS). Wherever possible the data from these tables was updated or supplemented to reflect the most
accurate and timely data available, which includes the following sources:
• US Census: The Census is the most statistically accurate source of data for the jurisdiction, but as we
approach the end of a decade, most of the 2010 Census data is now outdated. 2000 and 2010 data are
used throughout this report as a benchmark to compare changes and analyze longer term trends. All
Census data is available to the public at: https://factfinder.census.gov.
• American Community Survey (ACS): This survey is a sample meant to provide more timely estimates
between decennial Censuses. The ACS is available in 1-year, 3-year, and 5-year averages. Because the 1-
and 3-year estimates have a high margin of error, the most recent 5-year estimates are used as a default
for all calculations, unless otherwise specified. The most recent 5-year ACS available is the 2012-2016
estimate. All ACS data is available to the public at: https://factfinder.census.gov.
• Comprehensive Housing Affordability Strategy (CHAS): HUD commissioned the Census Bureau
for special data tabulations that address housing and community development needs for low income
households. CHAS data is based on the 2010-2014 ACS 5-year estimate, and can be accessed at:
https://www.huduser.gov/portal/datasets/cp.html#2006-2014
• Enterprise Community Partners – Opportunity360 Reports: Enterprise Community Partners is a
non-profit housing and community development organization, which also engages in policy and advocacy
to benefit low-income communities. They developed the Opportunity360 tool to help inform local
decision-making by providing an analysis of “opportunity indicators” at the Census Tract level. Having
scores on a variety of indicators that affect opportunity is a helpful way to make comparisons within the
jurisdiction and region. Their reports were used to analyze differences between neighborhoods within
Bellingham. More information is available at: https://www.enterprisecommunity.org/opportunity360
• Housing and Service Providers: The City of Bellingham works with and provides funding to many
community partners that provide affordable housing and critical human services. Housing inventory
information was compiled from various sources, and is only accurate as of the date the information was
provided. Statistics, analyses, and anecdotal evidence about trends and needs was also solicited from
knowledgeable partners, especially the Bellingham/Whatcom County Housing Authority, the
Opportunity Council/Homeless Service Center, Catholic Housing Services, and the Northwest Regional
Council.
CITY OF BELLINGHAM 2018-2022 CONSOLIDATED PLAN – MAY 29, 2018 3Executive Summary Bellingham, like the entire Western Washington region, has seen population growth and increased housing costs over the past five years. As a result, there are not enough affordable rental units or homes to purchase for low- and moderate-income residents. This is primarily a function of the fact that rents and home values have risen much faster than wages in recent years, and new construction has not caught up with population growth. As a result, almost 43% of households in Bellingham pay more than 30% of their income for housing. This rate is higher than both the state and US averages for cost burden. Affordable housing and human services are broadly needed. Certain groups are especially underserved at this time, including: • People who are dealing with disability, mental health, or addiction issues • Homeless single adults • Single-parent households • Elderly homeowners A lack of affordable housing contributes to the rise in homelessness because it makes it even more difficult for low-income residents to save enough money to avoid eviction or foreclosure in the event of unforeseen expenses. Bellingham’s homeless population has increased by 50% over the last five years to a total of 742 homeless individuals on a given night in 2017. Approximately 40% of this population is unsheltered at a point in time. Family poverty has remained steady since the previous Consolidated Plan. Our analysis reveals that poverty is especially concentrated in a handful of neighborhoods, which also generally correspond to those with the highest minority (non-white) populations. We also see that minority households at some income levels are disproportionately cost burdened when compared to the general population. The population of Bellingham is young and well-educated, but the senior population is growing and is expected to become a higher proportion of the population over time. This will present challenges for meeting housing and care needs for the elderly in the future, but will also present new economic opportunities. The community has many diverse needs, and the City cannot address all of them with our limited resources. After a robust community participation process, the City has selected the following goals: • Increase affordable housing supply • Address and prevent homelessness • Preserve existing housing • Promote neighborhood equity • Coordinate effective delivery of services The City has prioritized actions accordingly to meet each of the above goals, which are detailed in the Strategic Plan section. While all actions are priorities over the next five years, the City has developed a tiered system to highlight the most urgent needs within the community, as well as a way to depict those priority CITY OF BELLINGHAM 2018-2022 CONSOLIDATED PLAN – MAY 29, 2018 4
actions in which our partners take a lead role (with the City playing a strategic supporting role). This is done
also due to the uncertainty of funding over this five-year period, as a way to simply depict how the City will
handle various funding scenarios. The Tier 1, 2, and priorities with the city’s partners as the lead are shown in
the chart that follows.

CITY OF BELLINGHAM 2018-2022 CONSOLIDATED PLAN – MAY 29, 2018                                                   5
Figure 1. 2018-2022 Consolidated Plan Priorities

CITY OF BELLINGHAM 2018-2022 CONSOLIDATED PLAN – MAY 29, 2018   6
Public Participation
City staff engaged in a robust public participation preprocess beginning in spring 2017, and which included
the Assessment of Fair Housing that was accepted by HUD in December 2017. The complete Community
Participation Plan is available at: https://www.cob.org/Documents/planning/community-
development/consolidated-plan/consolidated-plan-ppp.pdf. The main components of the community
participation process were:

•   Consultation with the Community Development Advisory Board
•   Regular email communication with a stakeholder list of 170 community organizations
•   A website with regular updates and a public comment form: www.cob.org/cpupdate
•   Online and printed surveys targeting the general public, low-income residents, and local service agencies
•   A Community Solutions Workgroup on the continuum of housing
•   A service provider workgroup focused on homeless housing and service needs
•   An interactive exhibit during Bellingham Housing Week (Nov 6-9, 2017)
•   Social media posts
•   In-person meetings with community groups, committees, and commissions upon request
•   Public hearing on March 8, 2018
•   A 30-day public comment period (from March 9-April 10, 2018)
•   An open house to present the draft plan to the public on March 26, 2018
•   City Council updates and deliberations

Every effort was made to solicit public feedback from the greatest diversity of community members and
agencies possible through a variety of different strategies. This included translation of surveys and
promotional materials into Spanish, targeting disabled residents, coordinating with public housing resident
councils, and hand delivering printed surveys, postcards and fliers to places that provide services to low-
income residents, such as Unity Care Northwest, Walton Place, Goodwill, Opportunity Council, and Francis
Place. Every neighborhood was contacted by email and through the Mayor’s Neighborhood Advisory
Commission. Feedback was solicited from the business community and technology advocacy groups.
Throughout the process, public comments were received in the form of survey responses, letters, emails, and
verbal comments in public hearings and meetings. All public comments were compiled, summarized, and
reported to City Council and the Community Development Advisory Board. See Appendix 1 for all written
comments submitted during the formal comment period. Several citizens wrote to express their general
support for the Consolidated Plan as written, and appreciation for the community engagement process. The
other main themes of comments and suggestions received were:
Housing affordability and zoning:
    •   The need for more housing units in general, and support for the City taking a more active role in the
        development of affordable multi-family housing.
    •   Both support for and opposition to more density and infill development in single-family
        neighborhoods, including accessory dwelling units.

CITY OF BELLINGHAM 2018-2022 CONSOLIDATED PLAN – MAY 29, 2018                                                   7
• The difficulty of finding affordable housing in general, and concern with elderly residents being
“priced out” of their homes through high property taxes.
• Expansion of the Urban Growth Area, while protecting sensitive environmental areas and
greenspace within city limits.
• The need for building capacity of Community Housing Development Organizations through
operational support.
Homelessness and human services:
• The need for more low-barrier housing and services for those experiencing homelessness (shelter,
transitional, and permanent housing with supportive services), especially for adults without children.
• Support for programs that build self-sufficiency and self-respect, including providing jobs for people
experiencing homelessness.
Neighborhood equity and public facilities:
• Insuring equal access to parks and greenways throughout the City.
• The need for more specific goals to promote racial equality, including equity training for all
employees who deal with housing.
• The need for additional day facilities for special needs populations such as those with developmental
disabilities, seniors with dementia, and those experiencing homelessness.
• The need for community gathering space and an affordable grocery store in the Birchwood
neighborhood.
• The need for facility improvements and additional funding to cover operating costs at the Bellingham
Senior Activity Center.
Community Solutions Workgroup
A major contribution to the priorities reflected within our Strategic Plan came from the formal
recommendations of the Community Solutions Workgroup. Mayor Kelli Linville, Councilmember April
Barker, and Councilmember Dan Hammill convened a Workgroup on the “Continuum of Housing and
Service Needs” beginning in July 2017 and meeting monthly through October 2017. Community members on
the board represented the following local stakeholder agencies:
• Bellingham/Whatcom County Housing Authority
• Community Development Advisory Board members
• Domestic Violence Sexual Assault Services
• Downtown Bellingham Partnership
• Lighthouse Mission Ministries
• Lydia Place
• Northwest Youth Services
• Opportunity Council
• PeaceHealth
• Philanthropic community: Chuckanut Health Foundation
• Pioneer Human Services
CITY OF BELLINGHAM 2018-2022 CONSOLIDATED PLAN – MAY 29, 2018 8• Public housing resident/Housing advocate
• Whatcom County Health Department
The group was asked to identify key issues, and recommend strategies, actions, and solutions to address
homelessness and the continuum of housing and service needs in Bellingham. Over the course of four
meetings, the group identified a number of gaps and prioritized strategies to address them. All Workgroup
materials, including meeting agendas, presentations, and the final Report of Recommendations can be found
at: https://www.cob.org/gov/public/bc/Pages/Community-Solutions-Workgroups.aspx.
Consolidated Plan survey results
In addition to the Community Solutions Workgroup and Assessment of Fair Housing survey, the City
launched a Consolidated Plan survey. The survey was designed to gather information about priorities from
low-income residents who receive housing assistance, staff working at agencies that provide housing or other
services to low-income residents, and the general public. The survey was open from November 5, 2017 until
February 5, 2018, and there were a total of 865 participants. Figure 2 shows survey responses by group. A
detailed summary of the survey results can be found online at: https://www.cob.org/Documents/planning/
community-development/consolidated-plan/consolidated-plan-survey.pdf.
Figure 2. Consolidated Plan survey respondents
Agency
staff
Low-
income
14% residents
5%
81%
General
public*
*Note that those who did not answer demographics questions were included in the “general public” group.
The survey asked participants to rank issues related to affordable housing, homelessness, human services, and
community development from highest to lowest by priority, and to select their top two or three priorities
from a range of options which are permissible under HUD and local funding guidelines.
The top three problems related to affordable housing identified by all three groups were:
• Rents have increased too much (38%)
• Most of the jobs here don’t pay enough to afford housing costs (38%)
• Low-income and working families can no longer afford to live here (37%)
CITY OF BELLINGHAM 2018-2022 CONSOLIDATED PLAN – MAY 29, 2018 9Many aspects of the Consolidated Plan survey reflect the priorities that were recommended by the
Community Solutions Workgroup. The top solution that the general public, agency staff, and low-income
residents thought the City should prioritize is to build or purchase more housing to be reserved for low-
or mixed-income residents (prioritized by 51% of all respondents). The second highest priority given by
the general public and low-income residents was to recruit companies that will bring higher wage jobs to
town (40% and 42%, respectively). Among agency staff, the second highest priority was to change zoning to
allow multi-family buildings in more neighborhoods (36%).
There was significant variation in opinions about homeless housing programs. The top program selected by
the general public was transitional housing (46%) followed by emergency shelter (32%) and single-room
occupancy housing (28%). Meanwhile, among staff who work for a human service or housing agency, the top
priority by far was permanent supportive housing (53%), followed by transitional housing (29%) and single-
room occupancy housing (26%). About 4% of respondents said the City should not provide any homeless
housing programs or services.
There was much greater agreement among the community about what types human services the City should
prioritize. The top service need chosen by each group was mental and behavioral health services, followed by
housing support services and affordable childcare. There were some minor differences between groups: a
greater proportion of low-income residents prioritized legal and/or mediation assistance compared to the
general public, while the general public prioritized job training more highly than both other groups.
Figure 3. What type of services should the City prioritize for funding?
Mental and behavioral health services
Housing support services (case management, etc.)
Affordable childcare
Physical health services (including food)
Job training
Economic development
Social support and mentorship
Legal and/or mediation assistance
Other (please specify)
0 50 100 150 200 250 300 350 400
General public Agency staff Low-income residents
Participants were also asked to select three special needs populations which they think should receive more
help. The top three populations prioritized by all groups were people with mental illness (49%), families with
children or single parents (48%), and people experiencing homelessness (43%). These special needs
populations align closely with the human services that survey respondents prioritized.
CITY OF BELLINGHAM 2018-2022 CONSOLIDATED PLAN – MAY 29, 2018 10Community Profile
Demographics
The population of Bellingham estimate was 86,720 as of April 1, 2017. 1 The entire Western Washington
region has been experiencing steady population and economic growth since the previous Consolidated Plan
period. Both Whatcom County and Bellingham’s populations have grown, but at a rate that is slightly below
the state’s average. Since 2010 the population of Washington State has grown by 8.7%. Of the 39 counties in
the state Whatcom County was 11th in terms of population growth, with its population growing by 7.5% since
2010. Compared to both the state and the county, Bellingham as a city has seen slightly lower than average
population growth, for a total increase of 7.2%. As Figure 4 shows, the annual growth rate jumped above
state average in 2013 and 2017, and was below state average in all other years. Smaller cities in Whatcom
County have seen much faster growth in recent years compared to Bellingham. Lynden has grown by 14%
since 2010, and nearby Ferndale has grown by 18%.
Figure 4. Percent change in population by year
2.5
2.0
Percent change
1.5
1.0
0.5
0.0
2011 2012 2013 2014 2015 2016 2017
WA State avg Bellingham
Bellingham’s housing shortage is sometimes attributed to a high number of students and retirees. In fact,
Bellingham has a college-age population that is larger than average, but has an average-sized senior
population. In both Washington State and the US as a whole, people age 20-24 make up about 7% of the
population. As a college town, 18% of Bellingham’s population is 20-24 years of age. 2 However, the student-
age population has not risen significantly in recent years. This portion of the population has remained
consistently around 18% since 2000, before housing prices began to climb dramatically.
1 Washington Office of Financial Management. Available at: https://ofm.wa.gov/washington-data-research/population-
demographics/population-estimates/april-1-official-population-estimates. Note that other total population estimates are
used throughout this report, depending on the year of the data source in use.
2 Of course, not everyone age 20-24 is a college student, and some undergraduate and graduate students fall outside that
age range. Academic year 2016-17 average enrollment at Western Washington University was 12,795 full-time students
(or about 15% of the population). Enrollment varies quarter by quarter for all institutions, but we estimate around
21,000 people (or about 24% of the population) attend a community college, technical college, or university in
Bellingham during the year – this includes part-time students and professional or continuing education students.
CITY OF BELLINGHAM 2018-2022 CONSOLIDATED PLAN – MAY 29, 2018 11On the other hand, the senior population in the city has risen since the last Census—but it is still not above
the national or state average. People age 65+ make up 14% of Bellingham’s population, the same as
Washington State as a whole. This is just slightly lower than the US average of 14.5%. 3 However, there are
significantly fewer people in the 45 to 64 age group. Figure 5 shows how Bellingham’s population by age
group compares to the US population.
Figure 5. Population by age group in United States and Bellingham
30%
United States
25%
Bellingham
20%
15%
10%
5%
0%
Under 5 5 to 19 20 to 24 25 to 44 45 to 64 65+
Bellingham also differs from the state and nation in that our non-White population is lower than average.
Although the city is gradually becoming more diverse, Table 1 shows that Bellingham remains a majority
White community with the following racial and ethnic composition:
Table 1. Bellingham’s population by race and ethnicity
Percent of
Race or Ethnicity Total population
population
White (non-Hispanic and no other race) 69,938 82.8%
Asian 5,015 5.9%
American Indian or Alaska Native 1,540 1.8%
Black or African American 1,224 1.4%
Native Hawaiian or Pacific Islander 175 0.2%
Other race 2,453 2.9%
Hispanic or Latino (of any race) 6,912 8.2%
Data source: 2012-2016 ACS
3 2012-2016 American Community Survey (ACS)
CITY OF BELLINGHAM 2018-2022 CONSOLIDATED PLAN – MAY 29, 2018 12Population growth and housing demand
The composition of Bellingham’s population today is not well matched to our existing housing stock. Of all
the housing units in Bellingham, 46% have three or more bedrooms, while the average number of people per
housing unit is 2.17. The average family size and number of persons per household has steadily declined over
time 4, and therefore has increased demand for smaller units like one-bedroom and studio apartments. Today
only 16% of housing units have one bedroom. Coupled with the slowdown in housing production that has
not kept pace with population growth in general, this has resulted in a very low rental vacancy rate (estimated
at 1.79%) and rapidly rising rents.
Figure 6. New residential units permitted and population growth in Bellingham
2,500 1200
Total populatino growth per year
Number of new residential units
1000
2,000
800
1,500
600
1,000
400
500
200
0 0
2004 2005 2006 2007 2008 2009 2010 2011 2012 2013 2014 2015 2016
Total new units permitted Population change
Data source: City of Bellingham (residential permits); WA Department of Commerce, April 1 population estimates
Even as population growth continued, the development of new housing units slowed significantly between
2007 and 2013 during the Great Recession, as shown in Figure 6. While the production of new units has
accelerated since 2013, this has not yet alleviated preexisting demand or affordability challenges. For example,
the population has risen by 3,140 since 2015 to a total of 86,720 residents. Meanwhile, there were 1,267 new
units permitted in 2015 and 2016 combined. As Table 2 shows, using the average persons per household for
multifamily and single family units, we can estimate there are enough housing units available to accommodate
2,633 new residents, a shortage of 507 housing units. This estimate does not take into consideration any
preexisting housing shortage and reflects only the shortage for that two-year period.
4Office of Financial Management. Historical estimates for population and housing. Available at:
https://ofm.wa.gov/washington-data-research/population-demographics/population-estimates/historical-estimates-
april-1-population-and-housing-state-counties-and-cities
CITY OF BELLINGHAM 2018-2022 CONSOLIDATED PLAN – MAY 29, 2018 13Table 2. Population growth and new housing units from 2015 to 2017
a. 2015 population estimate 83,580
b. 2017 population estimate 86,720
c. Population change (b - a) +3,140
d. Total multifamily residential units permitted in 2015-2016 947
e. Total single family residential units permitted in 2015-2016 320
f. Average persons per multifamily unit 1.937
g. Average persons per single family unit 2.495
h. Estimated # of people housed in new multifamily units (d x f) 1,834
i. Estimated # of people housed in new single family units (e x g) 798
j. Total estimated number of additional people housed (h + i) 2,633
k. Estimated 2-year housing shortage (j - c) -507
In response, this demand has encouraged developers to build more units. Much of Bellingham’s total land
area (42%) is zoned as single-family residential, compared to 14% that is zoned as multi-family residential.
This puts constraints on what types of housing developments can be sited in which neighborhoods,
concentrating lower-income families in neighborhoods with multi-family zoning where housing is more
affordable. As demographics change, there is demand for a greater variety of housing options in more
neighborhoods.
Incomes
In Bellingham, the median household income is $44,441, compared to $54,207 in Whatcom County. Both lag
behind the state’s median household income of $62,848. 5 Even so, Whatcom County and Bellingham have
seen housing costs grow faster than incomes. 6 According to the 2016 1-year ACS, the median household
income in Bellingham has risen 46% from 2000 to 2016, while the median rent has risen 59%, and the
median home value has risen 137%. 7 Increases in Whatcom County have followed a similar trend, but are a
bit less dramatic.
5 2012-2016 American Community Survey (ACS) 5-year estimates. Available at: https://factfinder.census.gov
6 American Community Survey 1-Year Estimates, Whatcom County.
7 2000 Census (Base Year), 2016 ACS 1-year estimate (Most recent year).
CITY OF BELLINGHAM 2018-2022 CONSOLIDATED PLAN – MAY 29, 2018 14Figure 7. Percent changes from 2000 to 2016 in Bellingham and Whatcom County
35%
Median income Whatcom County
46% Bellingham
54%
Median rent
59%
101%
Median home value
137%
0% 20% 40% 60% 80% 100% 120% 140%
Data source: 2000 Census and ACS 2016 1-year estimates for Whatcom County and Bellingham
Bellingham also has very high rates of poverty. Over 22% of individuals live below the Federal Poverty Level.
This is almost ten percentage points higher than the Washington State poverty rate of 12.7%. It is important
to note that the poverty rate is not equal across all racial or ethnic groups. For example, 44.9% of Native
American or Alaska Natives in Bellingham live in poverty. This percentage is above the City’s average for all
non-white groups. Non-married families with children are also more likely to live in poverty. Over 50% of
single female households with children live below the poverty level. All of the poverty measurements
described here are slightly higher than during the last Consolidated Plan period, showing that there has been
no significant reduction in poverty in recent years.
CITY OF BELLINGHAM 2018-2022 CONSOLIDATED PLAN – MAY 29, 2018 15Housing Market Assessment
Analysis of housing stock
As of January 2018, there were 38,228 housing units within Bellingham’s city limits. 8 Roughly half were
single-family or manufactured homes, and half were multi-family homes, such as apartments, townhomes, or
condominiums.
Although multifamily housing is being added to the overall housing stock at a faster rate than single-family
detached units, the largest proportion of housing units (49%) are still single-unit detached homes, according
to Table 3. Altogether, multi-family units of all sizes make up 46% of housing units. Mobile homes, boats,
RVs, and attached one-unit structures, such as mother-in-law units, make up the remaining units.
There are about 3,400 more renter-occupied than owner-occupied housing units in Bellingham. From 2012-
2016, on average 45% of housing units were owned and 55% were rented. Compared to the last Consolidated
Plan period, these percentages have changed very little. Smaller units such as studios and 1-bedrooms are
more likely to be renter-occupied, whereas larger units (3 or more bedrooms) are more likely to be owner-
occupied. Two-bedroom units are 63% renter-occupied and 37% owner-occupied.
Table 3. All residential properties by number of units
Property Type Number %
1-unit detached structure 17,930 49%
1-unit, attached structure 1,083 3%
2 units 1,895 5%
3-4 units 2,219 6%
5-19 units 6,207 18%
20 or more units 6,150 17%
Mobile Home, boat, RV, van, etc. 1,080 3%
Total 36,564 100%
Data source: 2012-2016 ACS
Compare this housing stock to the average household size. In Bellingham, nearly 70% of residents are part of
a one- or two-person household (each make up roughly 35% of all households). And while 69% of owner-
occupied homes have three or more bedrooms, only 30% of all households have three or more people.
Although the number of occupants per housing unit is slightly higher for owner-occupied households (2.44)
than renter-occupied households (2.25), 9 the fact that people today are not as likely to share housing with
large families also helps explain the strong demand for smaller housing units.
8 Source: City of Bellingham Estimated Population and Housing Unit Model. Updated January 2018. Available at:
www.cob.org/housingstats. Note that City of Bellingham estimates are slightly higher than the 2012-2016 ACS, because
they represent a more recent count.
9 2016 ACS 5-year estimates. Tenure by Household Size (B25009).
CITY OF BELLINGHAM 2018-2022 CONSOLIDATED PLAN – MAY 29, 2018 16Table 4. Unit Size by Tenure
Owners Renters
Number % Number %
No bedroom 106 1% 1,928 10%
1 bedroom 519 3% 4,679 25%
2 bedrooms 4,166 27% 7,184 38%
3 or more bedrooms 10,542 69% 4,972 26%
Total 15,333 100% 18,763 100%
Data source: 2012-2016 ACS
Condition of housing
Overall, the condition of most housing units in Bellingham is good. Because of the steadily increasing
property values and high demand for housing, Bellingham has very few blighted or abandoned properties –
so few that there is no database for tracking such properties. According to USPS data, the number of vacant
residential units in the first quarter of 2017 was 961 (about 2.5% of all housing units). 10
Age of housing
As the production of new housing picks up, the percentage of older homes within the City declines gradually.
As of the latest ACS estimate, about 8,216 units (or 24% of all housing units) were built before 1950. A
higher proportion of older units are owner-occupied, which reflects the fact that many older homes are in
Bellingham’s historic, mostly single-family neighborhoods.
Table 5. Year Unit Built
Year Unit Built Owner-Occupied Renter-Occupied
Number % Number %
2000 or later 2,448 18% 3,810 19%
1980-1999 3,871 28% 6,100 30%
1950-1979 4,557 33% 5,194 25%
Before 1950 4,557 32% 3,659 18%
Total 15,333 100% 18,763 100%
Data source: 2012-2016 ACS
Lead-based paint
Lead-based paint is more common in houses built before 1980, and presents more of a health hazard when
young children are present. The 2010-2014 ACS data indicates that 56% of owner-occupied households and
47% of renter-occupied households were built before 1980. Of those, there were 1,060 owner-occupied
households and 915 renter-occupied households with children under six years of age.
HUD/US Postal Service Residential Vacancy Rate Data. 1st Quarter (Jan-Mar) 2008-2017 for Bellingham and
10
Washington State.
CITY OF BELLINGHAM 2018-2022 CONSOLIDATED PLAN – MAY 29, 2018 17Table 6. Risk of Lead-Based Paint Hazard
Risk of Lead-Based Paint Hazard Owner-Occupied Renter-Occupied
Number % Number %
Total Number of Units Built Before 1980 8,585 56% 8,837 47%
Housing Units build before 1980 with children under 1,060 12% 915 11%
6 years old present
Source: 2011-2014 CHAS tabulations
Regardless of the year the home was built, low- and moderate-income households may have less ability to
remove or stabilize lead-based paint, a process which can be quite expensive. A more accurate estimate might
be done by subtracting those households earning over 80% of the area median income (AMI). In that case,
the risk of lead based paint hazard is most likely to be highest in the 470 owner-occupied houses and 740
renter-occupied houses where moderate or low income households with young children reside (a total of
1,210 households).
Cost of housing
Since 2000, the median home value in Bellingham has increased by 137% and the median rent has increased
by 59%. In comparison, the median income in Bellingham increased by 46% over this same time period.
Predictably many families are now paying more than they can afford for housing.
Table 7. Change in median home value and contract rent from 2000 to 2016
Base Year: 2000 Most Recent Year: 2016 % Change
Median Home Value $148,900 $352,700 137%
Median Contract Rent $559 $887 59%
Data source: 2000 Census (Base Year), 2016 ACS 1-year estimate (Most Recent Year)
An “affordable” home is considered to be one priced so that the mortgage payment or rent plus utilities
would cost no more than 30% of household income. Lack of homes affordable to low- and moderate-income
families (those earning below 50% and 80% of median, respectively) has made it increasingly difficult for
potential homebuyers to find houses in their price range. In the five years since the last Consolidated
Plan, the median home price in Bellingham has increased by almost 27%, while the median family
income (MFI) has increased by 3%. In 2016, less than 18% of all houses sold in Bellingham were
affordable to a household at 80% MFI making $55,920 per year.
CITY OF BELLINGHAM 2018-2022 CONSOLIDATED PLAN – MAY 29, 2018 18Table 8. Affordable home sales: 2012 and 2016
Year 2012 2016
80% Bellingham MFI $ 54,240 $ 55,920
Affordable mortgage for 80% MFI 11 $ 238,018 $ 246,307
Affordable home purchase price $ 261,819 $ 270,937
# of homes sold affordable to 80% MFI 337 232
Data source: City of Bellingham Single Family (2 bedroom or larger) Median Sales Price: 2005-2016
Whatcom County is well below the State average for homes affordable to a household earning median
income (100% MFI), at just 34% of homes compared to 54% of homes statewide. 12 About 25,000 homes in
Whatcom County are affordable to median-income earners, and there are about 40,000 households earning
less than 100% of the county’s median income. In the Puget Sound region, Whatcom County has the second
lowest percentage of homes that are affordable to median-income earners.
Figure 8. Percent of homes affordable to a median-income household in Puget Sound by county
70% 64.4%
58.7%
60%
50.0% 49.7%
50% 47.3%
41.3%
40% 33.9%
30%
19.2%
20%
10%
0%
Data source: WA State Department of Commerce.
Cost burden
The four housing problems monitored by HUD are complete plumbing, complete kitchen, overcrowding,
and cost burden. Cost burden is by far the most prevalent issue in Bellingham. For example, only 0.4% and
1.5% of units lack complete plumbing and complete kitchens, respectively. Meanwhile 19% of all households
in Bellingham are cost-burdened and 24% are severely cost-burdened. That means 43% of households
overall are paying too much of their income for housing.
11 This assumes 4.5% fixed interest rate and 10% down payment on a 30-year mortgage, minus $150 per month for
utilities. Calculation does not include property taxes or insurance.
12 Department of Commerce. 2015 Washington State Housing Needs Assessment. Available at
www.commerce.wa.gov/housingneeds
CITY OF BELLINGHAM 2018-2022 CONSOLIDATED PLAN – MAY 29, 2018 19Cost burden is defined as paying more than 30% of household income for housing (rent or mortgage, plus
utilities). Severe cost-burden is defined as paying more than 50% of household income for housing.
50% of income going to housing Severely cost burdened
The percentage of Bellingham residents who are either cost-burdened or severely cost burdened is higher
than both the Washington State and the National average, 13 indicating that a large portion of residents cannot
find a home that is within their budget. Housing affordability affects people at all income levels, as Figure 9
below shows. Even among those households making above 100% of the area median income (AMI), 11% are
cost burdened or severely cost burdened.
Figure 9. Total cost-burdened households by income
Cost burdened
Severely cost burdened
6000
83%
5000
4000 79%
55%
3000
2000
11%
1000 29%
0
30% to 50% to 80% to >100%Programs and services
The City of Bellingham administers a Rental Registration and Safety Inspection Program. Property owners are
required to register their rental properties with the City and undergo a health and safety inspection every three
years. This inspection includes a wide range of standards. A property may fail an inspection for major issues
or may pass with conditions if issues are minor, such as the need to install the appropriate amount of smoke
detectors, and would not require a second inspection. The City has approximately 19,000 rental units
registered. Of the units that have been inspected so far, 54% passed the first inspection without any issues,
and 23% passed with minor conditions. The remaining 23% failed the first inspection. However, all but three
of those passed final re-inspection. While not all rental properties in the City have undergone inspection,
preliminary results indicate that very few rental properties in Bellingham are in need of major rehabilitation.
There are several ways the City helps low-income homeowners make health and safety repairs, including
stabilization of lead paint. Since 2001, 236 homes in Bellingham have been rehabilitated through the Home
Rehabilitation Loan Program. Low-income homeowners who qualify can receive zero-interest loans for
necessary repairs, which keep owner-occupied properties from becoming blighted or condemned. Homes
that test positive for lead paint-based receive assistance with lead stabilization in addition to other health and
safety repairs. The Rental Registration and Safety Inspection Program helps ensure that rental properties are
meeting local health and safety codes, and that property owners are making necessary ongoing repairs.
Public and assisted housing
For households that are struggling to find or maintain their housing, there is a continuum of housing
programs run by the City of Bellingham and our partner organizations. Table 9 is a summary of the total
number of units by type of housing program, as of January 2018. This chart includes all types of housing
programs for low-income residents – from those facing homelessness to home owners. Depending on the
type of housing program, a housing “unit” could be a single-family house, an apartment, a motel room, or a
bed/cot. Therefore, the total units below should be considered roughly equivalent to the number of
households that are being served by each program, not the number of individuals. A complete list of all
public and assisted/subsidized housing developments in the city can be found in Appendix 2.
Table 9. Total number of units by housing program
Type of housing program Total units
Emergency shelter 282
Home ownership or repair 1,129
Public or nonprofit housing (permanent) 2,766
Supported housing (permanent) 134
Transitional housing 189
Tenant- based rental vouchers* 1,301
Total 5,801
*Note that there is significant overlap between vouchers and public or nonprofit housing units, since low-income
voucher holders may use their vouchers in the nonprofit housing as opposed to on the private market. Vouchers are
administered by BHA can be used anywhere within Whatcom County.
CITY OF BELLINGHAM 2018-2022 CONSOLIDATED PLAN – MAY 29, 2018 21Public housing programs
Most public housing units and voucher programs in Bellingham are administered by the
Bellingham/Whatcom County Housing Authority (BHA). The BHA administers “public housing” that they
own, and HUD vouchers that assist low-income households with the cost of housing and utilities in various
buildings – many of which have been developed by the BHA in partnership with tax credit entities. Table 10
depicts the number of units and vouchers in use as of January 2018, based on a 99% unit occupancy rate in
their housing and a 98% lease rate for rental vouchers.
Table 10. Number of BHA managed units/vouchers in use by program type
Vouchers
Public Special Purpose Voucher
Project - Tenant - Veterans Affairs Family
Housing Total
Supportive Unification Disabled*
based based
Housing Program
523 1,559 258 1,301 44 0 147
Data source: Bellingham Housing Authority. January 2018. Includes all units/vouchers in Whatcom County.
*Includes Non-Elderly Disabled, Mainstream One-Year, Mainstream Five-year, and Nursing Home Transition programs
Housing needs
The information presented previously in this section explains why the housing cost burden in Bellingham is
above average. Put simply, there are not enough housing units available for all income levels of the
population. That means lower income residents are in tight competition for the units that are affordable to
them. This is even true for households who receive market-based rental assistance vouchers because some
property owners and managers will not accept them. 14 Housing prices continue to rise at a much faster rate
than earnings, which is unlikely to change in the near future. This trend not only puts strain on household
finances, it also puts more households at risk of homelessness because it’s nearly impossible to save up
enough money to cover unexpected expenses. In this way, cost burden, supply of subsidized housing,
homelessness, and housing problems such as overcrowding are interrelated issues.
There is no exact estimate of the total number of people who need access to affordable housing. Table 11
shows several different ways to estimate the number of households in Bellingham who are most likely to be
in need of assistance. The four categories represent different types of measures that could be used to
approximate the need among populations who are especially vulnerable to increases in housing costs. These
cannot be totaled because there is duplication between several of the categories. Keep in mind that these
estimates represent households that may be comprised of multiple individuals, and therefore the total number
of people in need would be greater.
14In response to this issue, Bellingham City Council approved Agenda Bill 21778, amending the Bellingham Municipal
code by prohibiting source of income discrimination. At the time that Consolidated Plan was drafted and the public
participation was taking place, this source of income discrimination was legal in Bellingham.
CITY OF BELLINGHAM 2018-2022 CONSOLIDATED PLAN – MAY 29, 2018 22Table 11. Different estimates of housing need
Households in need
A. Number of very low income households who are paying over 50% of
income for housing 6,810
B. Number of households on Housing Authority waiting lists as of January
2018 (added before waitlists were closed) 3,240
C. Number of families (related households) living below the Federal
poverty level 2,013
D. Number of low-income senior households that are paying over 50%
of income for housing 1,545
Sources: A. 2010-2014 CHAS tabulations, “very low income” is below 50% of the area median income;
B. Bellingham Housing Authority (list not unduplicated); C. 2012-2016 ACS; D. 2009-2013 ACS, “low income” is below
80% of the area median income, “senior” is age 65+.
Among all income levels, those making below 30% AMI have the highest rates of severe cost burden,
regardless of household type. Seniors, single-parent families, and students are populations that have a
particularly high need for affordable housing. Many retired seniors live on a fixed income and cannot afford
rental costs or property tax increases. In fact, senior households make up the majority of owner-occupied
households that are cost burdened. This may force low-income seniors to move away from family,
community, and services if they cannot find housing within their budget, which can be particularly
detrimental if a senior does not drive and has no easy access to transit.
Single parent families in Bellingham also have especially high needs. Over 50% of single mothers with
children live in poverty. Working families with children in general report that it is a struggle to find affordable
housing in the city with adequate space for themselves and their children.
The housing provided by local colleges and universities houses a portion of the student population, leaving a
significant gap in student housing supply. While students are not a population for which the City offers
housing or services, the lack of adequate student housing impacts the city’s housing needs and must be
acknowledged. Full-time college students are limited in the number of hours they can work, and the wages
they can earn. Increasing housing costs often translate to an increased student debt burden after graduation.
There are currently 3,666 on-campus student housing beds at Western Washington University. In the 2016-
2017 academic year, there were an average of 12,795 full-time students enrolled. 15 Therefore, the on-campus
housing can accommodate about 29% of the student body. This does not include the nearby private off-
campus housing that is marketed to students, which adds another 1,065 beds. There are currently plans under
consideration to develop an additional 980 beds of on- and off-campus student housing in the city.
Disproportionate housing problems
Analysis of HUD-provided data also indicates that there are disproportionately high needs among particular
racial and ethnic groups in Bellingham, when compared to the city’s population as a whole. HUD’s definition
Western Washington University. Office of Institutional Research. WWU Total Enrollment, 2016-17 Academic Year
15
Average for State-Funded students (i.e., not continuing education or professional development), not including Everett.
CITY OF BELLINGHAM 2018-2022 CONSOLIDATED PLAN – MAY 29, 2018 23of disproportionately greater need is defined as “when the members of a racial or ethnic group at a given
income level experience housing problems at a greater rate (10 percentage points or more) than the income
level as a whole.” 16 Table 12 below shows the percentage of households at each income level who have
housing problems in Bellingham as a whole compared to the percentage of households of each race/ethnicity
who have housing problems. The chart indicates there are several groups who have disproportionately greater
needs related to housing problems. As mentioned earlier, it is important to remember that the primary
“housing problem” experienced in Bellingham is cost burden.
Table 12. Rate of housing problems by race/ethnicity
Has one or more Total households at Percent with housing
Race or ethnicity
housing problems income level problems
0-30% AMI
Jurisdiction as a whole 4,945 6,210 79.6%
White 4,275 5,055 84.6%
Black / African American 50 170 29.4%
Asian 225 415 54.2%
American Indian, Alaska Native 100 145 69.0%
Pacific Islander 0 0 0.0%
Hispanic 270 350 77.1%
30-50% AMI
Jurisdiction as a whole 3,355 4,170 80.5%
White 2,660 3,425 77.7%
Black / African American 40 40 100.0%
Asian 100 115 87.0%
American Indian, Alaska Native 65 80 81.3%
Pacific Islander 0 0 0.0%
Hispanic 215 225 95.6%
50-80% AMI
Jurisdiction as a whole 3,755 6,620 56.7%
White 3,215 5,690 56.5%
Black / African American 35 45 77.8%
Asian 65 190 34.2%
American Indian, Alaska Native 60 70 85.7%
Pacific Islander 0 0 0.0%
Hispanic 315 540 58.3%
80-100% AMI
Jurisdiction as a whole 1,055 3,125 33.8%
White 955 2,750 34.7%
Black / African American 0 30 0.0%
16HUD. Using IDIS to Prepare the Consolidated Plan, Annual Action Plan, and CAPER. Page 109. Available at:
https://www.hudexchange.info/resources/documents/Econ-Planning-Suite-Desk-Guide-IDIS-Conplan-Action-Plan-
Caper-Per.pdf
CITY OF BELLINGHAM 2018-2022 CONSOLIDATED PLAN – MAY 29, 2018 24Has one or more Total households at Percent with housing
Race or ethnicity
housing problems income level problems
Asian 35 75 46.7%
American Indian, Alaska Native 0 60 0.0%
Pacific Islander 0 0 0.0%
Hispanic 75 160 46.9%
No groups in the 0-30% AMI level have disproportionately greater housing needs, even though that category
has the highest level of housing problems. We see disproportionately greater needs in all other income
categories. In the 30-50% AMI level, Black/African American and Hispanic households have housing
problems at a rate greater than 10 percentage points above the jurisdiction’s average – with 100% of
Black/African American households at that level having housing problems compared to 80% for the income
category as a whole. At the 50-80% AMI income level, 57% of all households have housing problems;
meanwhile, 78% of Black/African American households and 86% of American Indian or Alaska Native
households have housing problems. Both of these groups have a disproportionate need over 20 percentage
points higher than the income level. At the 80-100% AMI income level, we see only 34% of all households
have housing problems. However, among this group, 47% of both Asian and Hispanic households have one
or more housing problems.
Disproportionate severe housing problems
The designation of “severe” housing problems means that there is severe cost burden, more than 1.5 persons
per room (severe overcrowding), or lack of complete plumbing or kitchen facilities. Similar to the other
housing problems, we also see disproportionate representation of particular racial or ethnic groups who
experience severe housing problems in Bellingham. The table below shows all households with one or more
severe housing problems.
Table 13. Rate of severe housing problems by race/ethnicity
Has one or more
Total households at Percent with severe
Race or ethnicity severe housing
income level housing problems
problems
0-30% AMI
Jurisdiction as a whole 4,560 6,215 73.4%
White 3,930 5,060 77.7%
Black / African American 35 170 20.6%
Asian 215 415 51.8%
American Indian, Alaska Native 100 145 69.0%
Pacific Islander 0 0 0.0%
Hispanic 270 350 77.1%
30-50% AMI
Jurisdiction as a whole 1,970 2,200 47.2%
White 1,545 1,880 45.1%
Black / African American 0 40 0.0%
CITY OF BELLINGHAM 2018-2022 CONSOLIDATED PLAN – MAY 29, 2018 25Has one or more
Total households at Percent with severe
Race or ethnicity severe housing
income level housing problems
problems
Asian 80 35 69.6%
American Indian, Alaska Native 25 55 31.3%
Pacific Islander 0 0 0.0%
Hispanic 155 70 68.9%
50-80% AMI
Jurisdiction as a whole 1,215 6,620 18.4%
White 955 5,695 16.8%
Black / African American 0 45 0.0%
Asian 45 195 23.1%
American Indian, Alaska Native 0 70 0.0%
Pacific Islander 0 0 0.0%
Hispanic 155 535 29.0%
80-100% AMI
Jurisdiction as a whole 275 3,125 8.8%
White 255 2,740 9.3%
Black / African American 0 30 0.0%
Asian 20 75 26.7%
American Indian, Alaska Native 0 60 0.0%
Pacific Islander 0 0 0.0%
Hispanic 0 155 0.0%
Like the previous analysis of housing problems, there are no disproportionate needs by race/ethnicity among
households in the 0-30% AMI group. At the 30-50% AMI level, Asian and Hispanic households have severe
housing problems at a significantly greater frequency compared to the jurisdiction as a whole – both are more
than 20 percentage points above average. At the 50-80% AMI level, Hispanic households have
disproportionately more severe housing problems. At the 80-100% AMI level, Asian households do.
While there has been some improvement for other racial/ethnic groups since the last Consolidated Plan
period, low-income Hispanic households are still disproportionately experiencing severe housing problems, as
they were in the last Consolidated Plan.
CITY OF BELLINGHAM 2018-2022 CONSOLIDATED PLAN – MAY 29, 2018 26You can also read


