CLEARPATH Spencer Nelson - Clear Path to a Clean Energy Future 2021
←
→
Page content transcription
If your browser does not render page correctly, please read the page content below
Clear Path to a Clean Energy Future 2021:
      The Role of Utility Commitments
            on the Path to 2050

              Spencer Nelson

            CLEARPATH

                 August 2021
Clear Path to a Clean Energy Future 2021

Table of Contents
                                                                        2
Executive Summary
                                                                        3
  Main Takeaways
                                                                        7
  Recommendations

Introduction: The Path to 2050                                          8

Where Are We Now? A 2020 Climate and Energy Review                      9
  Emissions Trends in the U.S. Economy                                  9
  Power Sector Trends                                                   11
  Recent Federal Policy Updates                                         13
     Energy Act of 2020                                                 13
     Clean Energy Tax Extensions                                        15
  Utility, State, and Corporate Clean Electricity Commitments           15
     Utility Decarbonization Commitments                                15
     State Clean Energy and Climate Targets                             17
     Corporate Clean Energy and Climate Trends                          18

What Does the Future Hold for the Power Sector?                         21
  Modeling Assumptions and Caveats                                      21
  Current Electricity Trends Through 2050                               22
     Emissions and Price Projections                                    26
  Impact of Utility Decarbonization Commitments                         27
     The Role of Dispatchable Clean Energy Is Unclear                   33
  Mind the Gap: Remaining Emissions Through 2050                        34
     Benefits of Closing the Emissions Gap                              35

Recommendations for Closing the Gap                                     37

Conclusion                                                              39

Appendix A: States with 100 percent Clean Energy Targets                41

Appendix B: State Economy-wide Emissions Reduction Requirements         42

Appendix C: Significant Utility Decarbonization Commitments             43

Sources                                                                 48

About ClearPath, Major Contributions, Acknowledgements and Disclaimer   52

                                                                             1
Clear Path to a Clean Energy Future 2021

Executive Summary
America has greatly reduced emissions in the power sector over the last 15 years, yet as this report shows,
the easy part is over and power sector emission reductions could flatline under current conditions. One
bright spot is that some of America’s largest publicly owned utilities and major American companies
are taking action against climate change by pledging to further reduce carbon dioxide emissions by
midcentury. These “net-zero commitments” may avoid the flatline but improved public policy is needed to
help deploy clean, reliable, and affordable energy technologies to fully reach net zero.

Clear Path to a Clean Energy Future is a first-of-a-kind report that will be published annually to track
the latest power sector trends and model future technology and policy impacts. This inaugural edition
focuses on the role of electric utility decarbonization targets. The authors engaged Rhodium Group, a
leading research firm that analyzes energy policy and climate risk, to model ClearPath-designed scenarios
using RHG-NEMS, a version of the National Energy Modeling System created by the Energy Information
Administration as modified and maintained by Rhodium Group. The analysis led to several key findings:

      1. Carbon emissions in the power sector are expected to flatline after 2025, remaining at 96% of
         today’s emissions in 2050, even with recently enacted federal incentives and state-level clean
         energy standards. Over the coming decades the exhaustion of economic coal-to-gas shifting,
         existing nuclear plant closures, and continued load growth in states without climate targets will
         lead to shallow decarbonization, creating a cul-de-sac effect.

      2. This modeling found large electric utilities’ decarbonization pledges, many of which are for net-
         zero emissions by 2050, will have a significant impact of avoiding this flatline. The scenario based
         on existing utility commitments reduced carbon emissions to 56 percent below 2005 levels in
         2050—20 percent lower than the reference scenario.

      3. However, the power sector will continue to emit over a gigaton of carbon emissions annually
         in 2050, a gap that must be overcome through new market-friendly policies and technology
         improvements to enable power companies to fully reach their goals. Lowering the cost of
         dispatchable clean energy technologies such as carbon capture, long-duration energy storage,
         or advanced nuclear, as well as flexible demand technologies could make it easier for utilities to
         reduce emissions faster, and for additional utilities to commit to net-zero emissions.

      4. Maintaining existing nuclear reactors is one of the cheapest ways to help meet utility
         commitments and reduce carbon emissions. The utility commitments scenario preserved 22
         gigawatts (GW) of nuclear that closed in the reference scenario.

      5. Under current market dynamics, natural gas, solar, and wind technologies will be the vast majority
         of new generation under construction in the United States for the foreseeable future.

                                                                                                              2
Clear Path to a Clean Energy Future 2021

Main Takeaways
We Could Be Heading Toward an Emissions Cul-De-Sac
The last 15 years has seen a remarkable period of very low natural gas prices, decreasing costs and
incentives for renewables, and economic downturns from the financial crisis and Covid-19. Collectively,
this has driven a 40 percent reduction in electricity carbon emissions since the peak in 2005. However, this
relatively easy decarbonization appears to be coming to an end. As a result of nearly all uneconomical coal
being driven out of the market and projected nuclear reactor retirements, the reference scenario projects
that carbon emissions will largely flatline after 2025 if natural gas prices stay low. The total of new natural
gas generation emits more than the remaining economic coal reductions and also replaces non-emitting
nuclear energy. This “cul-de-sac” in shallow decarbonization comes despite state-level clean energy
policies, since load growth is accelerating in parts of the country without those policies in place.

Existing Utility Decarbonization Targets Have a Significant Impact
In late 2018, a number of large electric utilities began to make voluntary net-zero decarbonization
commitments on a midcentury time horizon. Since then, a total of 51 utilities, representing 71 percent
of customer accounts in the U.S., have established carbon-free or net-zero goals by 2050.1 We modeled
the electric utility decarbonization commitments in place as of October 2020 assuming investors hold
them to those commitments, many of which are for net-zero emissions by 2050.2 Utility decarbonization
commitments have a nontrivial impact on carbon emissions and on solar and nuclear energy generation.
With current utility commitments taken into account, emissions are projected to continue their decline

                                                                                                              3
Clear Path to a Clean Energy Future 2021

rather than flatline, ultimately reaching 56 percent below 2005 levels by 2050. Additional solar, nuclear,
and “other fossil”—essentially gas combustion turbine generation—comprise the biggest gains, offsetting
large amounts of additional coal and combined cycle gas electricity.

                                                                                                             4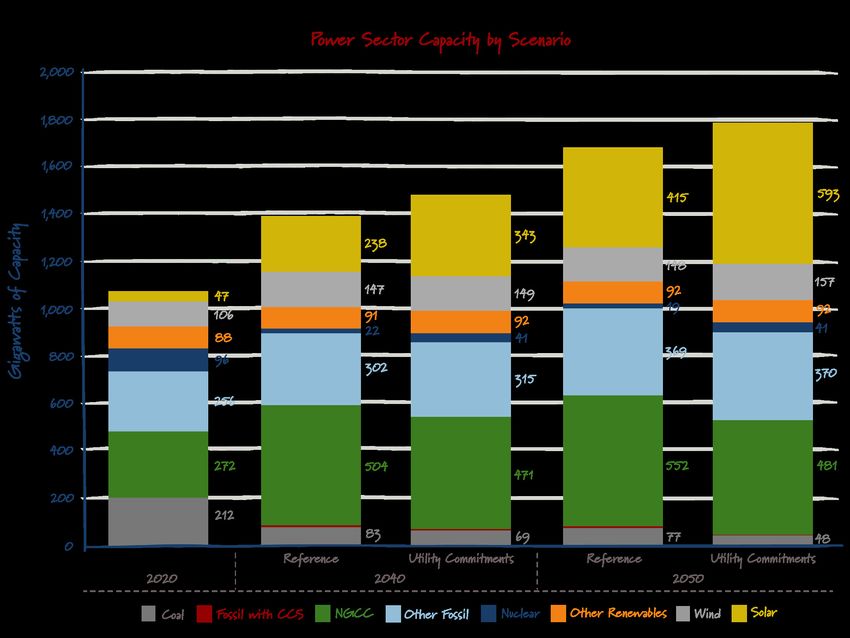
Clear Path to a Clean Energy Future 2021

Large Emissions Gap Remains; Affordable Clean Dispatchable Tech Could Help
Even with existing state policies and utility decarbonization commitments, the U.S. is not heading toward
net-zero power sector emissions by 2050. To do so would require annual emissions reductions to continue
for the next 30 years at a similar rate as the last 15 years. Significant levels of natural gas combined
cycle deployment continues through 2050 to ensure dispatchable capacity, despite the low cost of solar
in the out years. Lowering the cost of dispatchable clean energy technologies such as carbon capture,
long-duration energy storage, or advanced nuclear, as well as flexible-demand technologies could make it
easier for utilities to affordably reduce emissions faster, and for additional utilities to commit to net-zero
emissions. Public policy support is needed to further drive these costs down, making the technologies
affordable and deployable for utilities and the customers they serve.

Existing Nuclear Is a Reliable and Affordable Way to Reach Utility Decarbonization Targets
In areas of the country with utility net-zero goals in place but no state-level clean energy policies,
preserving existing nuclear plants is projected to be one of the most affordable ways to achieve those
utilities’ decarbonization goals. In the utility commitments scenario, 22 GW of nuclear power that would
have closed are preserved, resulting in over twice as much nuclear-generated electricity in 2050. More
companies establishing a net-zero commitment would likely lead to even more nuclear being preserved.

                                                                                                            5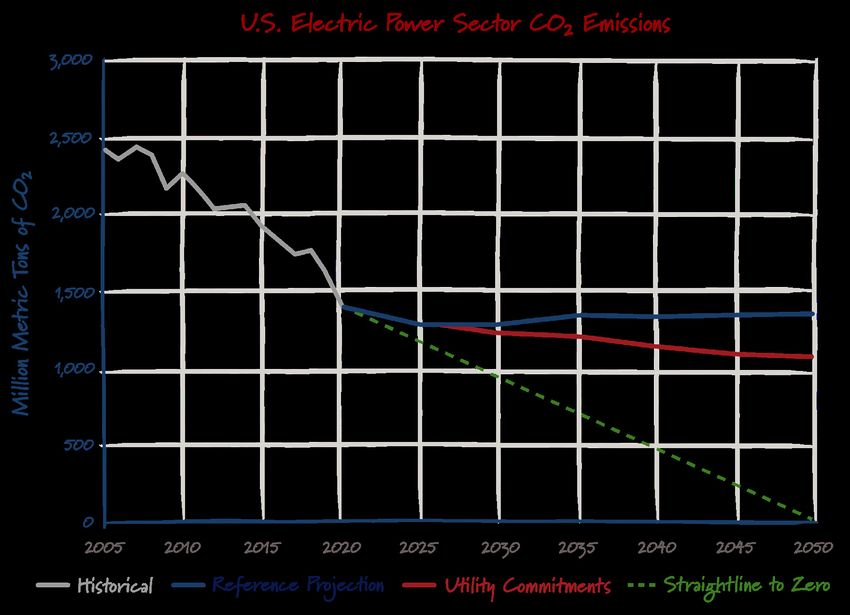
Clear Path to a Clean Energy Future 2021

Market-Driven Shift in Power—Only New Gas, Solar, and Wind on Horizon
Capacity additions and retirements in 2020 are a sign of future trends. Twenty-five GW of wind and solar
were added in 2020, along with a net addition of five GW of natural gas combined cycle capacity. Offsetting
these additions was the retirement of 10 GW of coal and two GW of nuclear power.

                                          Source: U.S. EIA Form 860                                      6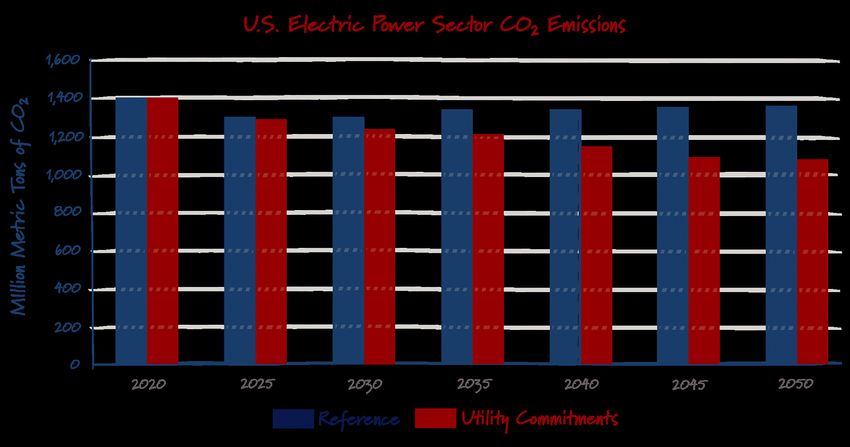
Clear Path to a Clean Energy Future 2021

Our reference scenario projects that these trends will only continue, with significant coal and nuclear
retirements, and most new generation coming from renewables and natural gas combined cycle.3 Due to
higher rates of operation (also known as the capacity factor), natural gas combined cycle ultimately adds
more annual electricity generation by 2050 than renewable energy. Wind energy additions eventually
peter off after the expiration of the wind tax credit (in 2021 for onshore wind and 2025 for offshore wind);
however, solar continues to grow after the tax credit expiration, ultimately representing the vast majority
of new renewable energy generation post-2035.

Recommendations
A number of key actions could close the remaining electricity emissions gap of over one gigaton of CO2e
through 2050.

Additional Utilities Need Net-Zero Carbon Goals and Clear Action Plans
The analysis projects that individual utility decarbonization goals can add up to a significant impact if they
are met. However, while much of the continental U.S. has its electricity supplied by utilities with net-zero
goals, many of the areas with the fastest load growth have limited or no goals. For utilities with goals in
place, clear action plans should be established in Integrated Resource Plans (IRP). If there are policy or
technological advances needed to achieve the goal, those utilities should establish a scenario analysis to
showcase the potential impact of various policy mechanisms or technology improvements. Retail utilities
must also define their goals based on electricity delivered, rather than produced.

                                                                                                                 7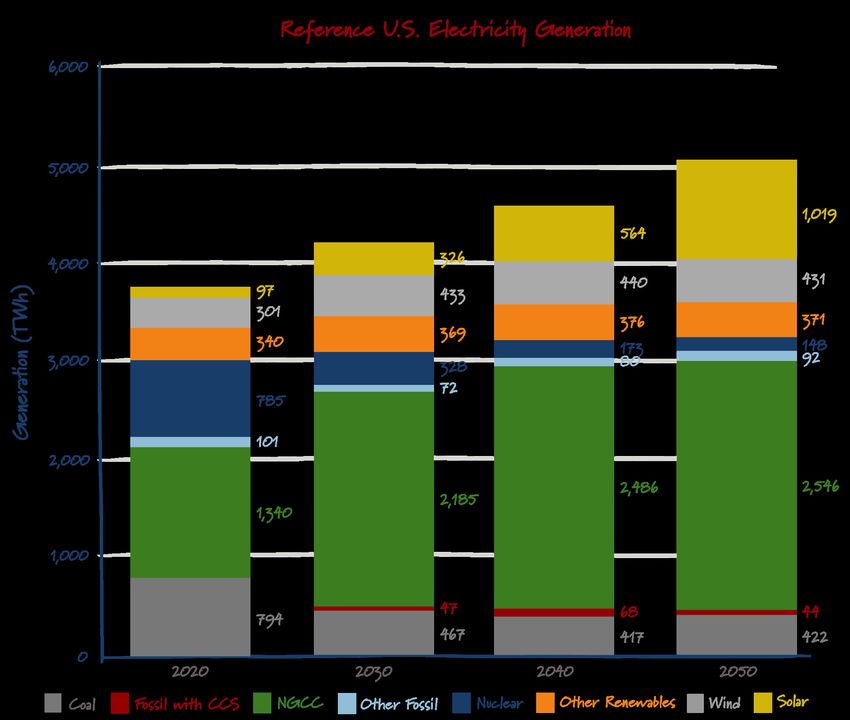
Clear Path to a Clean Energy Future 2021

More Affordable Dispatchable Clean Energy Is Needed
There is general agreement that dispatchable clean energy will help lower costs in a net-zero electric grid;
however, almost no new dispatchable clean energy was added in either scenario. More diverse affordable
clean energy options could reduce the total capacity construction required to achieve decarbonization
goals, reducing the cost of achieving those targets. Additionally, the vast majority of large utilities with net-
zero goals have stated that new technologies will be required to reach those goals at scale. Programs to
demonstrate cheaper dispatchable clean technologies and incentives to support early stage technologies
can help reduce the cost of those technologies.

State and Federal Policy Is Still Needed to Support Existing Nuclear
This analysis demonstrates that extending the operation of nuclear power plants can be a cost-effective
source of emissions reductions and that without action a majority of the nuclear fleet will become
increasingly uneconomical over the next decade. State and federal support is warranted to avoid
unnecessary retirements.

State and Federal Policy Is Still Needed to Support Existing Nuclear
There are a number of recent federal policy proposals that could help reduce the cost and timeline of
decarbonizing the power sector. Some of the proposals with the greatest bipartisan support include:

    1.   Extending and Enhancing the 45Q Carbon Capture Credit
    2.   Preserving Existing Nuclear Plants for Climate Benefits
    3.   Funding Demonstration Projects Authorized in the Energy Act of 2020
    4.   Technology-Neutral Tax Incentives for Emerging Technologies
    5.   Improved Energy Technology Permitting Methods

Introduction: The Path to 2050
ClearPath’s underlying thesis is that developing new and improved clean energy technologies is critical to
affordably and rapidly reduce carbon emissions globally. Furthermore, we believe that the United States
has a positive role to play by innovating affordable technology to reduce carbon emissions. In 2019
the U.S. represented only 11 percent of global greenhouse gas emissions,4 a percentage that’s likely to
continue decreasing. The U.S. must continue to reduce emissions, but as every molecule of carbon dioxide
has the same effect on warming, the ability to influence other nations through technology and policy
development should be a major consideration.

This report is intended to serve as an annual baseline to track U.S. progress toward decarbonization
in the power sector, including recent trends in federal and state policy and the energy sector more
broadly. This initial installment assesses the role of utility decarbonization commitments made thus far.
Future installments will focus on the role of new technologies and policies in accelerating clean energy
deployment. This report distills energy and climate trends into guideposts and policy recommendations to
chart a clear path forward.

                                                                                                                    8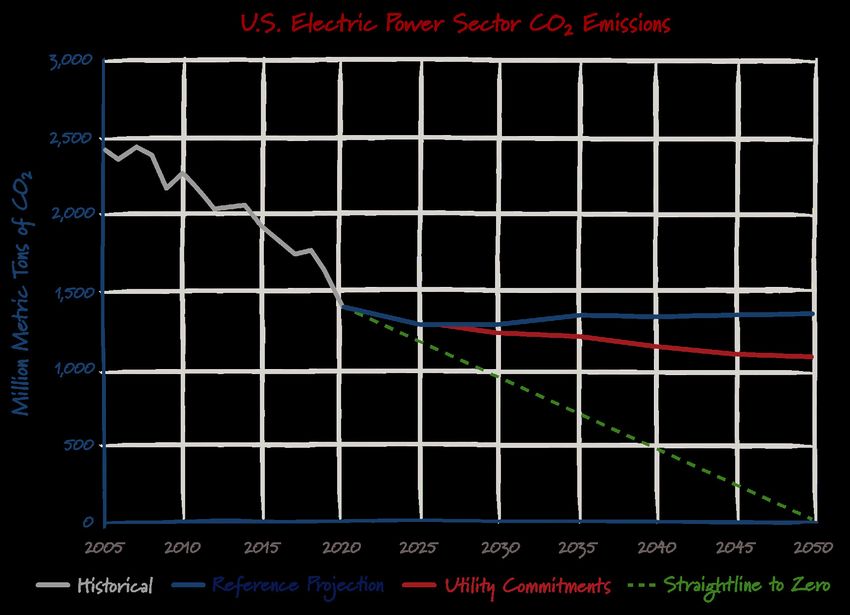
Clear Path to a Clean Energy Future 2021

This report is structured as follows:

    First, it provides an overview of energy and climate trends in the U.S. over the last year, including
    trends in emissions, electricity, utility decarbonization commitments, federal and state policy, and
    corporate clean energy.
    Second, the report covers a new set of energy sector modeling between now and 2050, which
    includes the first ever modeling of utility decarbonization targets, along with a reference scenario
    for comparison.
    Finally, the report covers the remaining emissions gap between existing decarbonization
    commitments and a net-zero power sector, along with policy recommendations to affordably
    accelerate emissions reductions.

Where Are We Now? A 2020 Climate and Energy Review
The events of the last year, from Covid-19 to the grid issues in Texas and California, will reverberate
through the energy system for years to come. There were significant changes in emissions and power
sector deployments over the last year, many of which were overlooked due to the pandemic. In addition to
energy sector trends, there were big federal and state policy developments regarding clean energy.

Emissions Trends in the U.S. Economy
Economy-wide U.S. greenhouse emissions declined 10.3 percent in 2020, setting a new record in the
modern era.5 Thus far, U.S. emissions have fallen 21.5 percent since 2005, well exceeding the 2009
Copenhagen accord goal of a 17 percent reduction by 2020. These emissions reductions have been
driven by reductions in the power sector, where emissions have dropped 40 percent since 2005. This
success has been spurred on by the tremendous cost declines in both natural gas and renewable energy
technologies. At the same time, it is clear that the dramatic drop in carbon emissions in 2020 came at a
tremendous cost to both public health and the U.S. economy. Globally, it is expected that emissions in
2020 will represent an eight percent reduction compared to 2019, twice as large as all other reductions
since WWII—combined.6 In 2021 it is also expected that emissions will rebound somewhat as the
economy recovers.

In addition, emissions from the transportation sector fell, while industrial sector emissions remained flat.
For the first time, the industrial sector emitted more than the power sector—a trend unlikely to reverse
anytime soon.7

                                                                                                               9
Clear Path to a Clean Energy Future 2021
Source: Rhodium Group ClimateDeck
Carbon emissions are likely to rebound somewhat in 2021, but they will remain below pre-Covid levels. It
is expected that as the economy improves, so will carbon emissions. This is not a bad thing, as lowering
emissions should not be conflated with lowering economic growth. In fact, over the last decade, the rate
of emissions per GDP has declined dramatically as economic growth has decoupled from energy use and
as the energy sector has grown cleaner.8
10Clear Path to a Clean Energy Future 2021
As stated, for the first time, industrial sector emissions were higher than power sector emissions.
However, without new technologies industrial sector emissions are expected to increase quicker than
all other sectors over the next decade. In fact, by the end of the decade, the industrial sector will likely
represent the largest source of emissions in the United States, something that would have been extremely
surprising until recently. This trend is why ClearPath recently expanded its portfolio to include clean
industrial technologies. The ability to manufacture and build affordably and cleanly will be essential to
continue economic growth while reducing emissions.
Overall, carbon emissions trends in the United States have demonstrated the ability to reduce emissions
through a combination of technological improvement and clean energy tax incentives. With continued
investment in clean technologies, it is likely that emissions will continue to decline. That said, the United
States is not on track to achieve net-zero emissions by 2050, which the global electric sector must
reach to have a high likelihood of limiting the worst impacts of climate change.9 Doing so would require
additional policy and improvements in technology.
Power Sector Trends
The impact of the Covid-19 pandemic had significant impacts on the ways Americans use energy, both
in the transportation and power sectors. The drop in demand coupled with large increases in renewable
energy capacity led to a 10 percent reduction in electricity emissions, far steeper than the three percent
reduction in demand.10
Coal-powered electricity generation fell nearly 20 percent in 2020, which was the greatest decrease of the
year and the largest contributor to reduced emissions. This large decline in generation was due to both
retirements and fewer hours of operation. The average coal plant capacity factor fell seven percentage
points in 2020, with coal plants only operating 40 percent of the time.11 EIA’s short-term energy outlook
predicts coal generation will recover in 2021 and 2022, but it is unlikely to return to 2019 levels.12
Generation from natural gas combined cycle increased about two percent in 2020, and added just under
five gigawatts in new generating capacity.
As a result of this large reduction in generation, coal was the third largest source of electricity generation
in 2020, behind nuclear energy for the first time in history. However, as nuclear plants represent over half
of planned retirements in 2021 and coal generation is expected to increase, this was a temporary blip.
Solar and wind energy grew significantly in 2020. Both the solar and wind energy industries set new
records for annual utility-scale installations with over 14 and 10 gigawatts of capacity, respectively. This
14 gigawatts of wind energy construction also represented the largest amount of capacity installed in
2020. Meanwhile, overall solar energy generation grew by a whopping 35 percent year over year, and
wind energy generation grew by four percent.13
11Clear Path to a Clean Energy Future 2021
Source: U.S. EIA Form 860
Utility-scale energy storage also finally took off in 2020. In total, over 3.5 GWh of energy storage was
deployed in 2020, which was more than the previous six years combined.14 This represents exponential
growth. Much of this increase was dominated by several very large battery projects, and future projects of
this scale are not under development. Two-thirds of the new energy storage deployment was in California,
due to that state’s high solar penetration (26.4 percent in 2020), as well as state-level energy storage
targets. Solar now represents nearly all power generated during the middle of a sunny day in California,
and because solar energy’s marginal operating cost is close to zero, that drives the price of electricity
close to zero as well. Therefore, the realized price for solar electricity in California in 2020 was nearly 30
percent lower than for a generation facility that ran all the time, and as more solar is added, that capacity
is increasingly worthless without some type of storage capacity that can hold and redeploy that electricity
when there’s higher market demand.15 These megabatteries are expected to shift solar power into the
evening, when it is more valuable.
12Clear Path to a Clean Energy Future 2021
Source: Wood Mackenzie Energy Storage Monitor
Recent Federal Policy Updates
2020 was the most significant year for clean energy and climate policy in well over a decade. The
Consolidated Appropriations Act of 2021, enacted at the end of 2020, included four crucial pieces
of climate and clean energy legislation: the Energy Act of 2020, the phaseout of hydrofluorocarbon
pollutants, an extension of clean energy tax credits, and record appropriations for energy R&D programs
at DOE. Taken together, these policy initiatives provide a bipartisan blueprint to guide administrative
action on clean energy and climate, particularly with regards to energy innovation.
Energy Act of 2020
The Energy Act of 2020, included as Division Z of the Consolidated Appropriations Act,16 is the first
comprehensive energy authorization law to be enacted in 13 years. It represents dozens of individual bills
from many members of both parties in both the House and Senate, such as the Nuclear Energy Leadership
Act, the Better Energy Storage Technology Act, and the Advanced Geothermal Innovation Leadership Act.
The Energy Act includes 11 titles, with subjects ranging from energy efficiency to renewables and storage,
critical minerals, and beyond. It is heavily focused on reauthorizing energy research, development, and,
13Clear Path to a Clean Energy Future 2021
perhaps most significantly, demonstration programs that are crucial for decarbonization. In total the law
authorizes over 20 large clean energy demonstrations over seven years. The graphic below highlights some
of the most important provisions of the Energy Act:
Key Energy Technology Programs in the Energy Act of 2020
Tech Description
Title II: Nuclear • Formally authorizes Advanced Reactor Demonstration Program
• Creates High Assay Low Enriched Uranium fuel availability program
for advanced reactors
• Facilitates collaboration between the private sector and national labs
to work on fusion technologies
• Establishes a milestone-based development program for fusion
energy concepts
Title III: Renewables and • Significant reauthorizations of R&D for all renewable power and
Storage energy storage technologies
• Improves the development of renewable energy on public lands
• Overhauls programs for solar, wind, water, and geothermal energy to
focus on the most pressing challenges
• Reorients the federal gridscale storage research, development, and
demonstration program around ambitious technology goals necessary
to facilitate breakthroughs necessary for grids of the future
Title IV: Carbon • Reorients the Office of Fossil Energy to focus on carbon capture,
Management utilization, and storage technologies
• Authorizes a comprehensive carbon capture R&D program focusing
on first of a kind and follow-on carbon capture demonstrations for
natural gas, coal, and industrial facilities
• Authorizes research for carbon utilization and storage to ensure captured
carbon can be efficiently prevented from entering the atmosphere
Title V: Carbon Removal • Authorizes the very first comprehensive, crosscutting carbon dioxide
removal research and development program at the DOE
• Authorizes DAC testing centers and a prize competition for both pre-
commercial and commercial DAC technologies
Title VI: Industrial • Establishes crosscutting research and development, and a
Emissions demonstration program for low-emission industrial energy technologies
Title X: ARPA-E • Reauthorizes the Advanced Research Projects Agency Energy, a DOE
agency that uses out-of-the-box program management to support
emerging technologies through 2025, with authorization escalating up
to $750 million per year
Elsewhere in the law, the Energy Act establishes additional programs and reforms in areas including
energy efficiency, technology transfer, critical minerals policy, and the Loan Programs Office.17
14Clear Path to a Clean Energy Future 2021
Clean Energy Tax Extensions
45Q: The 2021 Appropriations Act included a two-year extension for the 45Q carbon capture tax credit,
one of the largest climate actions included in the end-of-year bill. The 45Q tax credit was enacted
in its current form in 2018 and provides $35 per metric ton of carbon dioxide utilized in products or
enhanced oil recovery, or $50 per ton of CO2 sequestered. When initially passed in 2018, the 45Q credit
required projects to commence construction before the end of 2023 to qualify. However, the Treasury
Department took over two years to finalize regulations governing the use of the credit, which delayed
many companies’ efforts to develop projects before the 2023 deadline. The two-year extension in the
Appropriations Act allows any project that commences construction by the end of 2025 to qualify, giving
developers enough time to utilize the credit.
This two-year extension of 45Q is expected to single-handedly result in an additional 53 to 113 million
tons of capture capacity, which corresponds to an additional 342 million to 585 million tons of avoided
carbon emissions over the next 15 years.18
Renewable Tax Credits: The Appropriations Act also includes an extension for the Investment Tax
Credit (ITC) and the Production Tax Credit (PTC), which support renewable energy development. Most
importantly, for offshore wind technologies, the ITC was extended for five years, guaranteeing a 30
percent tax credit on capital costs for facilities that begin construction between now and the start of
2026. In addition to the offshore wind credit, the ITC was extended by an additional two years, and the
PTC was extended by an additional year. Solar energy, fuel cell, small wind, geothermal, and offshore
wind qualify for the ITC at various levels, while onshore wind, geothermal, closed-loop biomass, and
hydropower qualify for the PTC at various levels.19
Utility, State, and Corporate Clean Electricity Commitments
Numerous states, utilities, and corporations have set ambitious clean energy goals for the electric sector
over the last two years, heralding a new wave of local and private sector action. These sub-federal actions
can be major drivers to advance technologies and reduce emissions.
Utility Decarbonization Commitments
Some of the biggest advances in climate over the last year have been from electric utility commitments.
At the time of writing, 51 electric utilities in the United States have made carbon-free or net-zero emissions
targets, and over 70 percent of customer accounts in the country are supplied by an electric utility with a
significant emissions reduction goal.20 The map on the next page combines targets sourced from the Smart
Electric Power Alliance with retail utility service areas to demonstrate which portions of the country have the
most ambitious climate targets.
These decarbonization commitments have been primarily driven by the low cost of renewable energy,
but most of the utilities making these pledges have also stated that reaching such ambitious goals will
require significant technology and policy advances.
15Clear Path to a Clean Energy Future 2021
Utility Decarbonization Targets
Source: Commitments from SEPA Utility Carbon Reduction Tracker, service territories from HIFLD shapefiles.
Over 70 percent of utilities that have decarbonization goals of 80 percent or more explicitly state in their
planning documents that new technologies are necessary to meet their goals. Within larger investor-
owned utilities that have decarbonization goals, that percentage climbs to 84 percent.21 The most
commonly cited technologies necessary to achieve ambitious climate goals were demand-response
capability to offset low generation availability, longer duration energy storage options, and dispatchable
low-emission resources such as carbon capture or advanced nuclear.
16Clear Path to a Clean Energy Future 2021
Xcel Energy has among the most ambitious climate goals in the industry: 80 percent clean by 2030 and
100 percent clean by 2050. They have said that, even with their first-rate access to wind and sun, existing
technology is sufficient to reach only 80 percent—not 100 percent—clean:
“We need a suite of new, carbon-free resources that can be dispatched to complement our
continued adoption of renewable energy, energy efficiency and demand response. Our research
shows that these new resources will be the key to achieving a carbon-free generation fleet
without a costly overbuilding of the energy grid…These technologies may include carbon
capture and storage, power to gas, seasonal energy storage, advanced nuclear or small modular
reactors, deep rock geothermal and others not yet imagined.” 22
Without at least one of these new technologies reaching wide availability, or a significant buildout of
interstate transmission capacity to move solar and wind energy across long distances from high-resource
areas to high-load areas, the cost of reaching a zero-emissions electricity system would be extremely
expensive, as solar and wind resources would need to be overbuilt to account for periods with low resource
availability.23 Many utilities also noted in their plans that if new technologies are developed relatively quickly,
they could accelerate their decarbonization timelines further. One additional trend to note is that while
many of these utility decarbonization targets have been made in response to state-level climate and clean
energy laws, many of the net-zero targets have been set by utilities with a footprint entirely in states with
no significant climate policy (these utilities include Duke Energy and Southern Company). Edison Electric
Institute (EEI), the trade association representing investor-owned utilities, has also indicated its support for
a national 100 percent clean electricity standard for 2050.24
EEI has created the Carbon-Free Technology Initiative (CFTI) to support federal policies that will ensure
dispatchable clean energy technology by the 2030s.25 CFTI is operated in conjunction with a number of
nonprofit organizations to advance critical clean energy technologies, including advanced wind and solar
energy; long-duration storage and advanced demand efficiency; super hot rock deep geothermal energy;
zero-carbon fuels; advanced nuclear energy; and carbon capture, utilization, and storage.
State Clean Energy and Climate Targets
Numerous states have begun enacting ambitious clean energy goals, either through the legislature or
state regulatory bodies. As of June 2021, nine states, Washington, D.C., and Puerto Rico have mandatory
targets of 100 percent clean electricity, most of which come into effect in 2040 or 2050. In addition to
these binding commitments, another nine states have non-binding goals set by governors or legislatures.
The vast majority of these commitments are based on low-emission electricity technologies including
renewables, nuclear, or carbon capture, except for Hawaii, Maine, Puerto Rico, and D.C., which have 100
percent renewable electricity requirements.
17Clear Path to a Clean Energy Future 2021
States with 100 Percent Clean Energy Targets in Place
States with 100 percent clean energy goals represent 33.5 percent of total electricity consumption in the
U.S., while over 22.3 percent of electricity consumption falls under a binding goal.
In addition to the states listed above, other states have carbon emissions reduction goals and
requirements. Eleven states and Puerto Rico have enacted binding economy-wide emissions reduction
targets. Emissions reduction targets are listed in Appendix B.
Corporate Clean Energy and Climate Trends
In addition to individual utilities pledging to reduce their emissions, many other large corporations have
enacted their own pledges to significantly reduce emissions, both by reducing their own direct emissions
and by reducing indirect emissions through the purchase of heat, power, and fuels. These companies
demonstrate the role individual businesses can play in reducing emissions.
While it can be difficult to keep track and quantify the relative rate of emissions reduction activities by
businesses, the number of businesses working with the Science-Based Targets Initiative (SBTI) can be a
useful proxy for the rate of acceleration in this field. SBTI is a collaboration between the United Nations
and several global nonprofits to support companies in setting carbon emissions reduction targets and
associated implementation plans to minimize the impacts of climate change. The number of companies
committed to reducing their emissions has grown significantly over the last three years, with nearly 250
committed companies in the United States alone.26
18Clear Path to a Clean Energy Future 2021
Source: Science Based Targets
When U.S. based SBTI participants are combined with utilities’ decarbonization commitments, over 20
percent of U.S. companies with significant carbon emissions have now committed to a science-based
reduction target.27 These emissions targets are not meaningless. Over the last five years, emissions
from companies working with SBTI decreased over 25 percent, while overall energy-related emissions
increased by over three percent.28
In addition to establishing targets, large corporate energy users have also greatly expanded their
procurement of renewable energy capacity. 2020 represented a new record for corporate power purchase
agreements with a total of 10.6 gigawatts of new contracted capacity for renewable energy.29 This
new capacity, which will not come online for several years, is equivalent to 40 percent of the renewable
capacity that came online in 2020, demonstrating that corporate procurement is a major driver of clean
energy development. This level is also 13 percent higher than deals contracted in 2019, demonstrating the
resilience of corporate procurement despite the impact of Covid-19. The graph on the next page, adapted
from the Renewable Energy Buyers Alliance, shows this growth in procurement over time.
19Clear Path to a Clean Energy Future 2021
Source: REBA Deal Tracker
One company to highlight is Google, which has made a point of ensuring that all of its electricity—24 hours
a day, seven days a week—will be supplied by clean energy by 2030.30 There is a sizable difference between
Google and other companies that have made commitments to procure 100 percent renewable energy.
Most traditional renewable energy procurement is conducted by developing renewable energy projects to
generate electricity equivalent to the company’s consumption. However, in most cases companies that have
procured renewable energy are still actually using electricity from the grid for their operations; their facilities
are not solely running on renewable energy. In many cases the renewable facilities are located nowhere near
the company’s facilities and are sometimes as far away as other countries.
Switching to 24/7 clean energy means ensuring the electricity consumed at every single hour is matched
by clean energy demand. Doing so requires a balance of clean energy resources, including standard solar
and wind, as well as long-duration energy storage, geothermal, and potentially other carbon-free sources.31
This approach recognizes that moving toward a net-zero electric grid will require resources to be available
all year long at every hour.
Other companies are working to offset their carbon emissions by procuring carbon removal services.
Carbon dioxide removal (CDR) is any process that captures carbon dioxide from the air or ocean and
then sequesters it in such a way that it is not re-emitted to the atmosphere. The most common example
of this is tree-planting or afforestation; however, many other techniques are being developed that are
more technological, and therefore easier to measure and verify than purely natural means.32 Utilities with
limited renewable energy resources or carbon sequestration potential may need to procure carbon dioxide
removal, such as direct air carbon, to offset a small portion of emissions and reach net-zero emissions.33
The availability of affordable CDR technologies will make net-zero targets more achievable.
20Clear Path to a Clean Energy Future 2021
As affordable clean energy options continue to grow, it is likely that additional companies will develop
science-based carbon targets and demonstrate private sector leadership.
What Does the Future Hold for the Power Sector?
As utilities make emissions reductions pledges and the cost of clean energy technologies continues to
decline, clean energy will likely become an increasingly large share of the United States electricity mix. To
benchmark clean energy progress, we engaged Rhodium Group to model two future scenarios of the U.S.
power sector using RHG-NEMS, a version of the National Energy Modeling System (NEMS), developed
by the Energy Information Administration (EIA) and commonly used to analyze the impact of various
policies in the U.S. energy sector, that is modified and maintained by Rhodium Group. ClearPath designed
two scenarios for the U.S. electric power sector through 2050, one of which is a new utility commitments
scenario demonstrating the value of recent net-zero commitments if they are fully realized. For
comparison purposes, we also designed a standard reference scenario similar to that used by the EIA’s
Annual Energy Outlook. Future versions of this report will track new utility commitments along with
federal and state policies and their impact on the U.S. power sector.
Modeling Assumptions and Caveats
Rhodium Group modeled these scenarios with ClearPath’s specifications using RHG-NEMS, a version of
the National Energy Modeling System developed by the Energy Information Administration and maintained
and modified by Rhodium Group. NEMS is a complex energy-economy modeling system for the United
States. NEMS projects the production, imports, exports, conversion, consumption, and prices of energy,
subject to assumptions on macroeconomic and financial factors, world energy markets, resource availability
and costs, behavioral and technological choice criteria, cost and performance characteristics of energy
technologies, and demographics.
Two scenarios were modeled, one approximating the long-term operation and capacity expansion of the
United States power sector through 2050 under current conditions (the “reference” scenario), and one
treating recent decarbonization commitments by U.S. electric utilities as limits on emissions (the “utility
commitments” or “UC” scenario).
Assumptions, unless otherwise noted below, were aligned with the V-shaped macroeconomic recovery
estimates in Rhodium’s Taking Stock 2020 Technical Appendix.34
Both scenarios include representations of most significant federal and state policies in place as of June
2020, such as federal and state renewable energy and nuclear tax incentives; state and regional cap-and-
trade programs, Renewable Portfolio Standards (RPS), Clean Energy Standards (CES), fuel standards, and
zero-emission credit programs. State storage and offshore wind mandates are also included, as well as
clean energy tax credit extensions enacted in December of 2020.
Solar, wind, and energy storage cost assumptions are in line with Rhodium’s Taking Stock 2020, based on
the National Renewable Energy Laboratory’s (NREL) Annual Technology Baseline. Henry Hub natural gas
21Clear Path to a Clean Energy Future 2021
prices were assumed to start at $2.31/mmBTU in 2020 and rise to $2.51/mmBTU in 2050. For carbon
capture, both scenarios included estimates of low cost direct-fired supercritical CO2 gas plant technology
beginning in 2026 and low-cost staged, pressurized oxy-combustion (SPOC) coal plants beginning in 2031.
Scenarios also included low-cost small modular reactors as a technology.
As with any large scale energy and economic model’s projections, there are a number of important caveats
to keep in mind when discussing modeling results. These results represent a projection of current market
trends over time in line with federal and state policies on the books today. If policies, energy prices,
technology costs, or consumption patterns change, reality will deviate from these projections.
While the NEMS model solves for basic reliability and policy constraints such as utility carbon caps, in many
ways it does so coarsely. it does not fully represent dispatch of the electric grid for a large port of hours in a
year.35 This lack of granularity could potentially both overstate the level of firm capacity deployed, while also
inaccurately representing variable renewable energy operation throughout the year.
The way this particular analysis was conducted was at the national level, meaning that subnational or state
trends are difficult to disaggregate. Subnational changes in energy technology deployment, emissions, and
prices are estimated by the model, but all results were prepared only at the national level. For the utility
commitments scenario in particular, it’s important to note that utilities are able to source electricity from
outside their service territories if it is economical to meet their respective carbon caps.
Additionally, the model deploys energy technologies in a techno-economically efficient manner, and cannot
account for future social or political factors. It is not possible to fully represent the future ability to deploy
energy capacity at the scale projected by the model, or in the locations in which capacity is built. Other
factors, such as supply chain limitations, permitting challenges, or legal challenges could limit future
deployment. For example, it may be economically efficient in the model to build transmission lines between
the Southeast and the Midwest to import renewable energy, but efforts to build such infrastructure in reality
have historically failed.
Current Electricity Trends Through 2050
Power sector capacity is projected to undergo significant change over the coming decades, with natural
gas combined cycle, solar, and wind growing to simultaneously meet increasing demand and displace
coal and nuclear energy capacity. In the reference case, total power sector capacity is projected to
increase by 71 percent through 2050, to meet a 34 percent increase in electricity demand (capacity rises
at a higher rate since many resources, such as renewables and combustion turbines, operate less than
half the time).
Under the reference scenario, coal and nuclear power plants are both increasingly uncompetitive compared
to natural gas and renewable energy and exhibit marked declines of 63 and 81 percent, respectively. The
biggest gains in capacity come from solar, natural gas combined cycle (NGCC), natural gas combustion
turbines (labeled as “other fossil''), and wind. Solar and wind capacity together rise 268 percent by 2050, with
most of that increase coming from solar.
22Clear Path to a Clean Energy Future 2021
Under the reference scenario, coal and nuclear power plants are both increasingly uncompetitive compared
to natural gas and renewable energy and exhibit marked declines of 63 and 81 percent, respectively. The
biggest gains in capacity come from solar, natural gas combined cycle (NGCC), natural gas combustion
turbines (labeled as “other fossil''), and wind. Solar and wind capacity together rise 268 percent by 2050, with
most of that increase coming from solar.
Nuclear capacity particularly suffers, with a decline of nearly 80 percent between now and 2050. Because
the NEMS model does not take into account the expiration of a nuclear power plant’s NRC license, all
nuclear retirements not already announced are made on a purely economical basis and most of the existing
nuclear capacity is considered uneconomical in the reference case.
NGCC, natural gas combustion turbines, and energy storage capacity all sharply increase as well, with
combustion turbines and energy storage serving as balancing measures for increased renewables on the
grid. In general, single-cycle combustion turbines are cheap to build and can ramp quickly, but they consume
23Clear Path to a Clean Energy Future 2021
as much as 50 percent more fuel than natural gas combined cycle to generate the same amount of
electricity. As a result, they are primarily used for balancing the grid when electricity prices are high, and on
average operate for less than 10 percent of the year. Standalone battery energy storage plays a similar role
in the system. Battery storage grows to 69 gigawatts of capacity in 2050, but this may be an understatement
as solar and wind deployments may be paired with batteries in hybrid systems if there are improvements to
economics from doing so.36
24Clear Path to a Clean Energy Future 2021
Total demand for electricity is projected to increase by 31 percent between now and 2050. Electricity from
natural gas combined cycle is projected to surge through 2030, then slowly rise through 2050. Post-2030
natural gas prices increase somewhat, and renewable cost declines, which makes solar and wind much
more competitive, with electricity from those two technologies ultimately more than tripling through
2050. Meanwhile coal and nuclear exhibit a significant contraction over that period. Electricity generation
from “other fossil” generators (mostly gas combustion turbines) remains flat over this period despite a
40 percent increase in capacity. The average capacity factor for natural gas combustion turbines in the
reference scenario is less than three percent, meaning that they are only being used for very short periods
of time.
25Clear Path to a Clean Energy Future 2021
Emissions and Price Projections
One of the most interesting findings from our modeling work is the fact that power sector emissions are
expected to begin slightly increasing after 2025, effectively reaching the extent of what’s economically
efficient with current technologies and policies. After a sharp decline over the next five years as coal
plants continue to retire and are replaced with gas and renewables, carbon emissions slowly increase
between 2025 and 2050, as natural gas combined cycle generation increases to displace coal and
nuclear, as well as to meet increases in load. Emissions never reach current levels, ultimately leveling out
at 44 percent lower than 2005.
There are several dynamics at play here, the largest of which are related to load growth, NGCC,
and nuclear trends. Through 2025 the combination of switching from coal to gas and building out
renewables continues to drive emissions reductions, as an average of 16 gigawatts of coal capacity
comes offline each year and is backfilled by 20 GW of NGCC and 23 GW of renewables each year.
Following 2025, however, economical coal-to-gas switching opportunities have been largely exhausted,
and new combined cycle plants begin replacing nuclear reactors instead—with an average annual
retirement of 6 GW of nuclear capacity coupled with 15 GW of NGCC additions. Aside from the
replacement of nuclear capacity, much more natural gas electricity is used to meet the increased
demand through 2050. The fact that emissions remain flat while electricity consumption increases
by 30 percent and the economy grows is an encouraging sign, but that same load growth makes
additional significant reductions more difficult.
26Clear Path to a Clean Energy Future 2021
This “cul-de-sac” of shallow decarbonization demonstrates the limits of state-level clean energy in the
most climate-ambitious states. The reference scenario contains representations of all binding state-level
climate and energy policies in place at the end of 2020. That means it includes the combined goals of
17 states.37 In fact, as of 2019, the total electricity consumption in states with 100 percent clean energy
requirements comprised less than 30 percent of the U.S. total, meaning that decreases in those states
are easily outweighed by increased fossil generation elsewhere, such as in Florida, Georgia, Indiana, Ohio,
and Texas. To date, the best that existing state-level power sector policies can do is keep emissions
flat.38 These findings demonstrate the importance of keeping existing nuclear reactors online wherever
feasible. The reference scenario projects 80 percent of nuclear capacity will close by 2050. As discussed
in the following section, this is unlikely to happen—but maintaining existing nuclear power makes a
significant impact on future emissions reductions.
Impact of Utility Decarbonization Commitments
As discussed on page 16, 51 utilities have made significant decarbonization commitments over the last
several years. Working with Rhodium Group, ClearPath developed a scenario to estimate the impact of
the electric utility commitments in place as of October 2020. This scenario quantifies for the first time
the potential benefit of these commitments if they are realized.
In sum, the impact of utility commitments beyond that of the reference case is significant. Many of the
utility decarbonization commitments are in areas of the country without any corresponding state-level
policy—meaning that in those regions utility commitments will drive clean energy progress. In total
the utility commitments (UC) scenario resulted in an estimated cumulative four gigatons of additional
avoided carbon emissions beyond the reference scenario, corresponding to annual emissions in 2050 of
56 percent below 2005 levels (compared to only 44 percent below 2005 levels in the reference scenario).
This change is driven by significantly lower coal and natural gas capacity, coupled with preservation of existing
nuclear capacity and major increases in renewables and battery storage capacity. Compared to reference, the
UC scenario projects 29 GW less coal capacity and 71 GW less NGCC capacity. Replacing that avoided fossil
capacity is the preservation of 23 GW of nuclear power and an additional 187 GW of solar and wind capacity.
This modeling effort also demonstrated that at current projected costs, dispatchable clean energy
technologies such as carbon capture, advanced nuclear, geothermal, and long-duration energy storage
do not play a significant role in meeting the shallow levels of decarbonization achieved through existing
utility commitments. The need for these technologies does exist, but it is largely needed for future energy
mixes with extremely high levels of clean electricity.39 For the purposes of this analysis, utilities with
decarbonization commitments are able to purchase additional renewable energy from regions without
decarbonization commitments. If each utility were required to produce all its electricity from clean
sources within its service territory, it is likely that more clean dispatchable resources would be procured.
These commitments, particularly the utilities with net-zero goals, can be a big part of driving emissions
reductions, so long as utilities translate those commitments into their integrated resource planning and
power contracting going forward. This work also demonstrates that the combination of existing state
policies and utility goals are insufficient to decarbonize the national power sector.
27Clear Path to a Clean Energy Future 2021
Structure of Utility Commitments Scenario
A carbon cap was placed on each utility with a decarbonization goal according to that utility’s stated
level of carbon reduction and a timeline as included in the Smart Electric Power Alliance’s Utility Carbon
Reduction Tracker.40 To meet the carbon caps set for each utility, the model selects the lowest-cost-
available resource. For traditional vertically integrated utilities, the combined emissions of all its owned
assets need to be below the emissions cap, while for utilities operating in a restructured power market
such as PJM, a corresponding carbon cap was placed on the percentage of sales represented by that
utility in its respective region. Compliance with these carbon caps can be reached either by building
new capacity or by purchasing low-emissions power in-state or regionally. These utility commitments
are layered on top of existing federal and state-level clean energy and climate policies to estimate their
combined effect.41 Other underlying assumptions are identical to the reference scenario.
Results
Our analysis shows that if realized, the utility commitments made so far will have a significant impact on
the electric sector. The UC scenario deploys 30 percent more solar and wind by 2050 than the reference
scenario (most of this new renewable capacity is solar) and maintains twice as many nuclear reactors on
the grid, demonstrating that a combination of new renewables and existing nuclear power is one of the
cheapest carbon reduction options available. The total additional solar and wind capacity deployed by 2050
is greater than all the capacity currently installed in the U.S. Coal power capacity further declines to 48 GW,
and while gas combined cycle capacity still grows significantly, it ultimately begins to plateau in 2040.
28Clear Path to a Clean Energy Future 2021
The UC scenario tells a similar story, with solar and nuclear power generation up significantly compared
to the reference scenario, offsetting coal and combined cycle generation. Generation from natural gas
combustion turbines more than doubles to balance increased renewable generation. By far, the biggest
beneficiaries of the utility commitments made to date would be solar and nuclear energy.
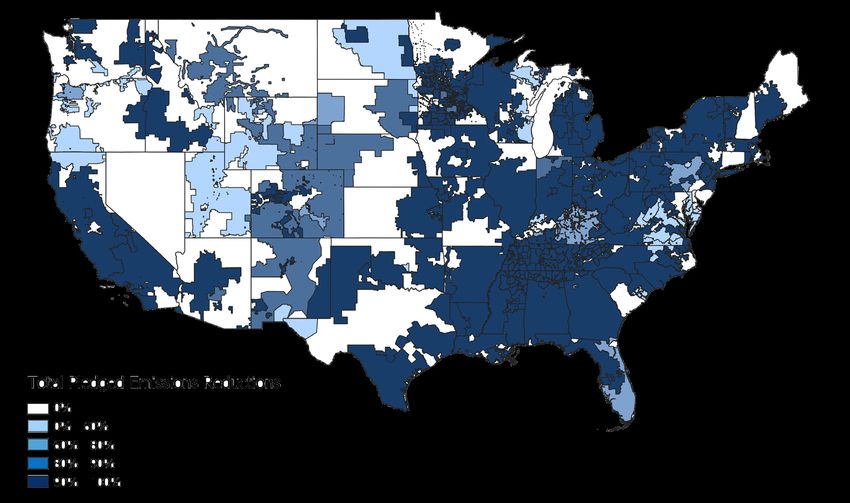
Role of Nuclear Energy
Nuclear energy is the largest source of zero-emissions electricity in the United States today, but it
has faced increased economic struggles, particularly in restructured electricity markets such as PJM,
NYISO, and MISO. Twelve reactors have closed in the last decade, leaving a total of 93.42 An additional
eight GW of nuclear capacity has been officially announced for retirement, but as mentioned
previously, much more capacity could retire due to economic pressures in the coming years.
The UC scenario leads to 228 percent more electricity generated from nuclear reactors in 2050 than
the reference. Maintaining existing nuclear power plants is one of the cheapest ways to meet clean
energy goals, as demonstrated by the model, which maintained significant nuclear to keep the utilities
under their carbon caps.43 The increased generation in the UC scenario comes from 22 additional
gigawatts capacity on the grid. Even more would likely be preserved if more utilities established net-
zero commitments.
29Clear Path to a Clean Energy Future 2021
Battery storage also emerges as a clear beneficiary in the UC scenario, with nearly twice as much
capacity deployed in 2050. Battery storage provides a similar balancing capability as combustion
turbines, but does not contribute to the carbon cap associated with each utility’s commitment.
30Clear Path to a Clean Energy Future 2021
The chart below presents the average annual amount of capacity added or retired in each five
year period of the UC scenario. For example, the nine GW of solar and four GW of wind added
between 2020 and 2025 is an annual amount, and the total for the five-year period would be 135
GW of capacity. Solar is consistently added at a high rate throughout the study period, with more
combustion turbines being added beginning in 2035 and wind additions tapering off after 2035.
Most of the coal and nuclear retirement happens before 2030 and is displaced by both renewables
and natural gas generation. Finally, spurred on by the 45Q carbon capture tax credit (which requires
construction to commence prior to 2026) an annual average of one GW of gas with CCS is added
each year between 2025 and 2030.
The analysis shows that electricity prices under the UC scenario are projected to remain at or below
current prices through 2050, compared to a six percent decrease in the reference scenario. Despite 27
percent higher clean electricity generation relative to the reference scenario, the average retail price is only
six percent higher, which is primarily driven by anticipated declines in the cost of electricity generation as
both renewables and natural gas electricity get cheaper due to technological improvements.44
31Clear Path to a Clean Energy Future 2021
Carbon dioxide emissions in the power sector drop significantly below business-as-usual in the
UC scenario, continuing to fall after 2025 until they hit 1,073 million metric tons in 2050. This is in
contrast to the reference scenario, in which emissions are projected to increase after 2025. In total,
approximately four gigatons of carbon emissions are avoided in the UC scenario compared to the
reference case on a cumulative basis. Carbon emissions reduction in 2050 would represent a 56
percent decrease from 2005 levels, 21 percent lower than the reference scenario.
32You can also read