Computers, Environment and Urban Systems
←
→
Page content transcription
If your browser does not render page correctly, please read the page content below
Computers, Environment and Urban Systems 89 (2021) 101677
Contents lists available at ScienceDirect
Computers, Environment and Urban Systems
journal homepage: www.elsevier.com/locate/ceus
Simulating the urban spatial structure with spatial interaction: A case study
of urban polycentricity under different scenarios
Cai Wu a, b, Duncan Smith b, Mingshu Wang c, a, *
a
Faculty of Geo-Information Science and Earth Observation (ITC), University of Twente, Hengelosestraat 99, 7514AE Enschede, the Netherlands
b
Center for Advanced Spatial Analysis, University College London, 90 Tottenham Court Road, London WC1E 6BT, United Kingdom
c
School of Geographical & Earth Sciences, University of Glasgow. Glasgow, G12 8QQ, United Kingdom
A R T I C L E I N F O A B S T R A C T
Keywords: Polycentric urban development is gaining momentum in both scholarly research and real-life practice. This
Urban polycentricity brings new demand for planning support systems to simulate and analyse the urban spatial structure in terms of
Dynamic urban spatial structure polycentricity under various urban policy scenarios. With the help of emerging urban data, urban simulation
Spatial interaction
techniques, and network science, this study proposes a workflow to simulate the urban spatial structure with
Community detection
Urban simulation
spatial interaction as a part of the planning support system. Using Singapore as a case study, this study has
explored the resulting urban spatial structure with four employment distribution strategies. The results suggest
that planning practices impact urban spatial structure and its spatial interaction by redistributing urban
morphological elements, such as employment in this study. Also, our results show that the physical urban spatial
structure and spatial interaction are closely related. These results reinforce the role of urban planning practice to
achieve a more sustainable and coherent urban built environment. Through this empirical evidence, our
workflow exemplifies the potential of the planning support system to help urban planners and governments
understand their urban policy regarding urban polycentricity.
1. Introduction Urban polycentricity, one specific type of urban spatial structure, has
been highlighted by academia and urban practitioners, especially during
With the rapid urbanisation process and the emergence of megacities the past decade. Polycentricity refers to the plurality of centres (Meijers,
worldwide, the cities’ management and planning authorities face 2008), and the degree of polycentricity is often used to reflect non-trivial
increasing challenges from a wide variety of urban issues. The provision urban spatial patterns. Numerous academic researchers have focused on
of necessary urban infrastructure and functions such as housing and measuring polycentricity and relating it to various urban performances
transportation network to the new urban dwellers is only one part of the (Adolphson, 2009; Liu & Wang, 2016; Wang et al., 2019; Wang &
question. Experience showed that the distribution of various urban Debbage, 2021). With the focus of urban studies shifting towards the
infrastructure and functions could impact people’s behaviour, contrib network of interactions between the different parts of cities, urban flow
uting to the city’s overall economic performance, social coherence, and data are used to describe these interactions (Batty & Cheshire, 2011). In
environmental sustainability (Arribas-Bel & Sanz-Gracia, 2014; Liu, many cases, scholars use spatial interaction, such as the flow of cash or
Wang, Qiang, Wu, & Wang, 2020; Masip-Tresserra, 2016; Meijers, 2008; human capital, to represent the spatial interactions between the
Wang, Derudder, & Liu, 2019). As such, the scientific approach to urban different part of the city as the dynamics of urban spatial structure
management and planning has been increasingly emphasised. As a (Chen, Arribas-Bel, & Singleton, 2019; Gao, 2015; Rey et al., 2011).
result, the urban spatial structure study has become an essential part of Following this research strand, we propose a new workflow to simulate
the scientific process to understand and plan the urban built environ urban spatial structure with spatial interaction data. Furthermore, using
ment, gaining popularity in academic research (Bertaud, 2004; Meijers, polycentricity as the indicator for urban spatial structure, we demon
2008; Münter & Volgmann, 2020; van Meeteren, Poorthuis, Derudder, & strate this workflow by simulating spatial interaction and the resulting
Witlox, 2015). urban spatial structure under different urban scenarios.
* Corresponding author at: School of Geographical and Earth Sciences, East Quadrangle, University of Glasgow, Glasgow, G12 8QQ, United Kingdom; University of
Twente, Faculty of Geo-Information Science and Earth Observation (ITC), P.O. Box 217, 7500 AE Enschede, the Netherlands
E-mail addresses: c.wu@utwente.nl (C. Wu), duncan.a.smith@ucl.ac.uk (D. Smith), mingshu.wang@glasgow.ac.uk, mingshu.wang@utwente.nl (M. Wang).
https://doi.org/10.1016/j.compenvurbsys.2021.101677
Received 3 November 2020; Received in revised form 21 April 2021; Accepted 11 June 2021
Available online 24 June 2021
0198-9715/© 2021 The Authors. Published by Elsevier Ltd. This is an open access article under the CC BY license (http://creativecommons.org/licenses/by/4.0/).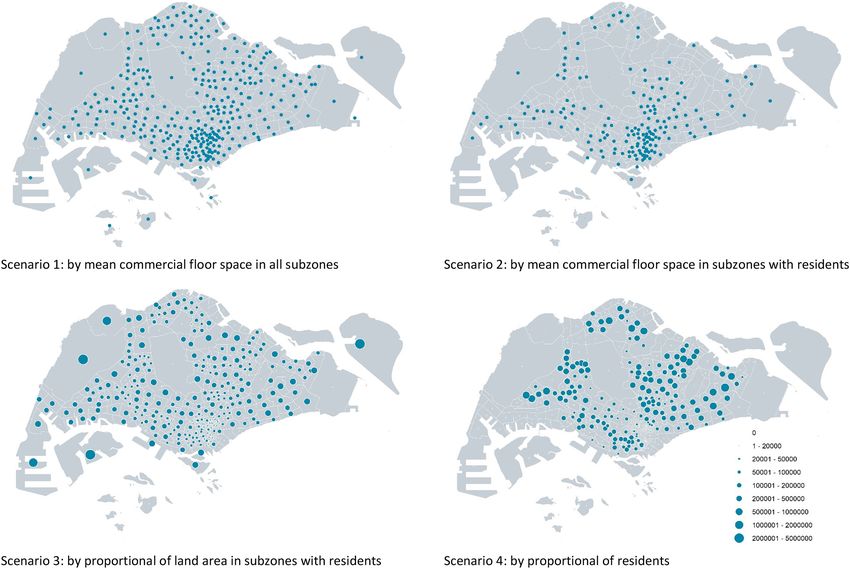
C. Wu et al. Computers, Environment and Urban Systems 89 (2021) 101677
As cities increasingly face emerging challenges, urban simulation activity in urban settings (Anas, Arnott, & Small, 1998; Krehl, 2015;
and other information technology were adopted as part of the planning Wang, Zhou, Long, & Chen, 2016; Zhong, Arisona, Huang, Batty, &
support system (PSS) (Harris & Batty, 1993) for the city manager and Schmitt, 2014). The urban spatial structures are often described using
urban planner to tackle these urban challenges. Simulation methods morphological properties such as the concentration and density of
such as agent-based modelling and system dynamic model are applied to population, employment, and built-up area (Bertaud, 2004), which is
predict the possible outcomes for different urban policies (Hasegawa, relatively static. In this study, we refer to it as the static urban spatial
Sekimoto, Seto, Fukushima, & Maeda, 2019; Mueller, Klein, & Hof, structure. On the dynamic aspect, the urban spatial structure also in
2018). This study will experiment with the proposed workflow with a cludes human activities and interactions, which are more temporal and
current urban planning policy: “Bring jobs closer to home” (Yuen, 1998). dynamic. We refer to it as the dynamic urban spatial structure.
While industries benefit from economies of scale and concentration in With a city’s expansion, the urban spatial structure can be increas
traditional urban monocentric models, the city also suffers from ingly decentralised and complex (Zhong et al., 2014). Urban functions,
increasing communing time and deteriorating living environment as it population, employment, and the built-up area have overflowed from
expands. One particular example is the spatial mismatch of jobs and the urban centre. Other than traditional central business districts (CBD),
housing, where employment is concentrated in specific regions and urban hubs have formed around the traditional urban core with urban
working households reside in locations that lack job opportunities. This economic and technology as the driving force. Thus, the description of
creates greater demand for travelling and presents challenges for social urban spatial structure is associated with the notion of decentralisation
justice and job accessibility (Horner & Mefford, 2007; Wang, Zeng, & and polycentricity from the beginning of its scholarly research (Anas
Cao, 2021; Zhou, Chen, & Zhang, 2016). et al., 1998) with works analysed these morphological properties’ allo
Thus, it is believed that with a proper land use policy (Tomasiello, cation to reveal the urban spatial structure. For example, some examined
Giannotti, & Feitosa, 2020), a polycentric urban spatial structure could how the urban spatial structure changes with the decentralisation of
bring better city performance and a more sustainable model of urban employment in the USA (Arribas-Bel & Sanz-Gracia, 2014). These
development (Walsh, 2012). The concept of “Bring jobs closer to home” studies greatly aided the government and urban planners in monitoring
is in line with the polycentricity urban model with the formation of the physical development of the city. However, they are only one spe
employment outside the traditional central building district (CBD) (De cific dimension of the cities’ urban spatial structure.
Souza et al., 2016). It is widely adopted as a part of urban policy in The urban spatial structure is the distribution of the city’s morpho
compact megacities like Singapore (Urban Redevelopment Authority, logical element and the underlying relations and interactions between
1991) and Hong Kong (Development Department (HKSAR), 2016). This the different urban hubs. Among which spatial interactions represented
study tests the urban spatial structure via the proposed workflow under by different kinds of urban flows such as travel flows and commuting
different approaches to employment distribution. We believe this will patterns within the city are being used to describe the dynamics of the
provide new insights for the city manager and urban planner to better urban spatial structure (Bertaud, 2004; Burger, van der Knaap, & Wall,
understand and plan the urban built environment. 2014; Hu, Yang, Yang, Tu, & Zhu, 2020; Sohn, 2005; Zhong et al., 2014).
This paper’s reminder begins with a literature review that introduces In his paper, Sohn (2005) examined the inherent relationship between
the essential concept and related work. Using Singapore’s spatial an urban spatial structure with the commuting pattern. He suggests that
mismatch as a case study, a spatial interaction model is applied to commuting patterns represent the physical allocations of urban spatial
generate the jobs-housing flow using public transport data and four interaction in general. Hu et al. (2020) suggested that other than using
scenarios with different commercial space allocation strategies. Network centralised-decentralised and monocentric-polycentric concepts to
Community detection is then applied to the jobs-housing flow to describe the urban spatial structure, spatial interactions such as the jobs-
determine the urban centres and their community boundary. At the final housing flow could add crucial information to complete the whole pic
stage of the workflow, we measure and contrast the different morpho ture. This study will refer to the urban spatial structure measure from the
logical and functional polycentricity under the different urban sce spatial interaction as the dynamic one, in contrast to the static one
narios. The more detailed procedure and the case study are introduced measured from the concentration of the morphological element. This
in the methodology section. Next, we present the results with discus study has established the essential concept of static and dynamic spatial
sions on how the different commercial space allocation changes urban structure; we now move on to the simulation and analysis of spatial
centres and the city’s overall urban spatial structure. Lastly, we conclude interactions in the existing literature.
with an evaluation of the new workflow and provided possible appli
cations and future improvements. 2.2. Spatial interaction model and network community detection
2. Literature review Spatial interaction is the network of flow between different spatial
locations (Guo, 2009). Travel flow is adopted widely as the proxy for
This study involves concepts and methodologies from multiple dis spatial interaction in many studies as people are the “physical carriers,
ciplines to simulate the urban spatial structure under different urban motivate the transfer of materials, money, people, and information be
policies. The three most crucial aspects are the concepts of urban spatial tween areas in urban space” (Zhong et al., 2014, pp.2179). Today,
structure and its dynamic, spatial interactions to detect urban commu different forms of flow data are becoming increasingly available and
nities and their boundary, and the measurement of polycentricity. These comprehensive to describe the urban spatial interaction thanks to ad
three concepts and methodologies and interconnected and were applied vancements in information technology and open data initiatives: mobile
individually or collectively in many past pieces of research. We will also phone records, smart card public transport data, records for taxi and
look into how different urban development models have been proposed private hail, etc. (Liu, Derudder, & Wu, 2016). Scholars have used these
to build the foundation for this study’s scenario analysis. This section data for spatial analysis, like identifying the urban spatial structure
will explore relevant past research that built the theoretical and meth (Zhong et al., 2014) and functional zones (Yuan, 2014), discovering
odological foundations for the newly proposed workflow. hidden patterns (Yin, 2002), or verifying theories and concepts. While
access to these data is still limited and can only describe the past and
2.1. Urban spatial structure and its dynamics current situations, the spatial interaction model, also known as the
gravity model, could help researchers simulate and predict spatial
As cities continue to grow and expand, people start to look at how the interactions.
urban space is arranged and the underlying driven force. The study of
urban spatial structure is the study of the distribution of urban space and
2
C. Wu et al. Computers, Environment and Urban Systems 89 (2021) 101677
Oi Dj Liu, & Zhao, 2015), etc. The morphological size could also be extended
Tij ∝
Cijβ to broader concepts such as the buildings’ floor space and density. This
is because the buildings are regarded as a good proxy for urban density
Inspired by the traditional gravity model in newton’s physics (Batty and activities (Adolphson, 2009). Green (2007), Burger and Meijers
& Mackie, 1972), the spatial interaction model can be described where (2012) have taken a step further and summarised two types of poly
the flow is a function of three variables: the origin repulsiveness, centricity. One has been the morphological polycentricity mentioned
destination attractiveness, and travel cost between the origin and above, which focuses on the scale and size balance of the urban centres;
destination. The flow (T) is believed to be proportional to the mass of the The other one is the functional polycentricity, which extends the idea to
origin (O) and destination (D) and inverse proportional to the distance the pattern of spatial interaction between the urban centres. The func
(C) between them. It is further developed to the non-constrained model, tional polycentricity focuses on the balance of the interaction distribution
production/origin constrained model, attraction/destination con rather than the scale of it. To put in simple words, the more evenly the
strained model, and double constrained model(Fotheringham, 1983). urban centre’s size is distributed, the more morphologically polycentric
Each model has a unique use case. The production/origin constrained the urban structure; similarly, the more even the interaction between
model, in particular, is also known as the retail model; it is adopted to these centres, the more functionally polycentric the urban structure.
predict the change in the system flow with variation in the attractiveness Generally speaking, studies find that there is a positive correlation be
of the destination. The attractiveness is usually represented in the form tween the morphological polycentricity and functional polycentricity
of morphological terms like retail floor space. Its application includes (Burger & Meijers, 2012; Wei et al., 2020): Higher concentration of
but is not limited to optimise location selection for facilities (Guy, 1991). urban morphological elements such as population and buildings will
In recent decades, as the scientific approach to study urban built envi attract more urban flow; the more balance the distribution, the more
ronment is increasingly valued, the application of the spatial interaction balance the flow. Again, these spatial interactions between the urban
model has also been extended to urban spatial analysis, including the centre are represented by urban flow data mentioned earlier. Thus, the
simulating urban spatial structure with predict spatial interactions spatial interactions could be potentially applied to measure the func
(Chen, Hui, Wu, Lang, & Li, 2019; Gao, Liu, Wang, & Ma, 2013; Sarkar, tional polycentricity through a network approach.
Wu, & Levinson, 2020; Sohn, 2005). The identification of urban centres depends on the purpose, research
With the spatial interactions between different parts of the city field, and scale of the polycentric study. Urban polycentricity can largely
forming a complex network, network science application as a form of be considered at two scales: inter-city polycentricity and intra-city pol
spatial analysis to study the urban spatial structure is also observed. ycentricity (Wang et al., 2019). The different scales provide very
Other than using physical transport network for urban topology studies, different contexts regarding what constitutes centres in polycentric
the spatial interaction or urban flowas a weighted directional network urban studies (Wei et al., 2020). Besides the scales, this study also ac
and was used to detect the urban spatial structure (Liu, Gong, Gong, & knowledges the different approaches that scholars deployed to identify
Liu, 2015; Zhong et al., 2014). The network approach uses the com the urban centres by the attribute value involved in the study. Common
munity detection method to identify urban centres and its boundary to approaches include setting a threshold value (Liu & Wang, 2016),
reveal the dynamic urban spatial structure via spatial interaction. Zhong selecting a fixed number of urban centres (Burger & Meijers, 2012), or
and her colleagues (Zhong et al., 2014, p p. 2181) have attempted to specifying the centre according to the study needs (Krehl, 2015). We
develop a “quantitative method for detecting urban hubs, centre, and could conclude that the method to identify centres is often discussed
borders well as changes in the overall spatial structure of urban move case by case, and these diverse techniques enriched the scholar’s arsenal
ment using daily transportation data” and, more importantly, “identi for future urban polycentric studies.
fying communities based on mobility.” Here they use the Infomap Scholars have also proposed different ways to measure poly
equation approach developed by Rosvall and Bergstrom (2008) for centricity. A rank-size distribution is commonly deployed to measure
community detection due to its good performance (Lancichinetti & polycentricity: top-ranked urban centres are plotted with their rank and
Fortunato, 2009) and the very nature that the network constructed by size. The closer the value of the gradient of the best fit line is to zero, the
urban flow data been weighed and directed. It also showed the poten more polycentric the urban structure, vice versa (Meijers, 2008; Wang
tials of the dynamic urban structure to complete the full urban structure et al., 2019). These studies also acknowledge other means of measure
image in addition to the traditional morphological structure. Hence, it ment of morphological polycentricity, such as calculating the standard
could be concluded that the dynamic urban spatial structure detected deviation of the size of the urban centres (Green, 2007; Liu et al., 2016)
from spatial interaction could be an asset to evaluating urban develop and using the different index of various aspects (Pereira, Nadalin,
ment progress. Monasterio, & Albuquerque, 2013). While the measurement poly
centricity is relatively comprehensive in scholarly research, identifying
2.3. Measurement of urban polycentricity urban centres and their boundary of the urban spatial structure is still
based mainly on the “static structure” of the physical distribution of
Urban polycentricity is a crucial facet of urban spatial structure. As urban morphological elements mentioned in the previous section.
polycentric urban development becomes increasingly emphasised in Hence, the study of polycentricity of the dynamic urban spatial structure
urban studies, the definition of polycentricity is also becoming stretched is left untouched and presents opportunities for further research.
among different studies (van Meeteren et al., 2015). However, its
empirical meaning in urban studies is simple and straightforward: the 3. Case study area and data
plurality of centres (Meijers, 2005). The study of polycentricity can thus
be summarised as identifying urban centres and studying the balance This study selects Singapore as a case study area to demonstrate the
between them. This breaks down the measurement of urban poly proposed framework for the following reasons. First, Singapore is a
centricity into three steps: First, identify the attribute or indicator cosmopolitan island city-state with approximately five million residents.
required by the study to study urban polycentricity; second, identify the It is well-known for its economic success and sophisticated urban
urban centres; and lastly, select the suitable technique for measurement. planning and management. After decades of systematic planning and
The early study of polycentricity is regarded as an urban morpho development, Singapore has become a model of efficient urban plan
logical study. Hence, the size balance between these centres has become ning, development, and management. Second, Singapore has gone
essential to measure the polycentricity of the urban structure. Common through suburbanisation and polycentric urban development processes,
indicators for urban polycentricity include population size (Liu & Wang, where settlements and satellite towns have formed outside the tradi
2016), road network density (Liu et al., 2016) and employment (Huang, tional urban core. The urban spatial structure of Singapore has become a
3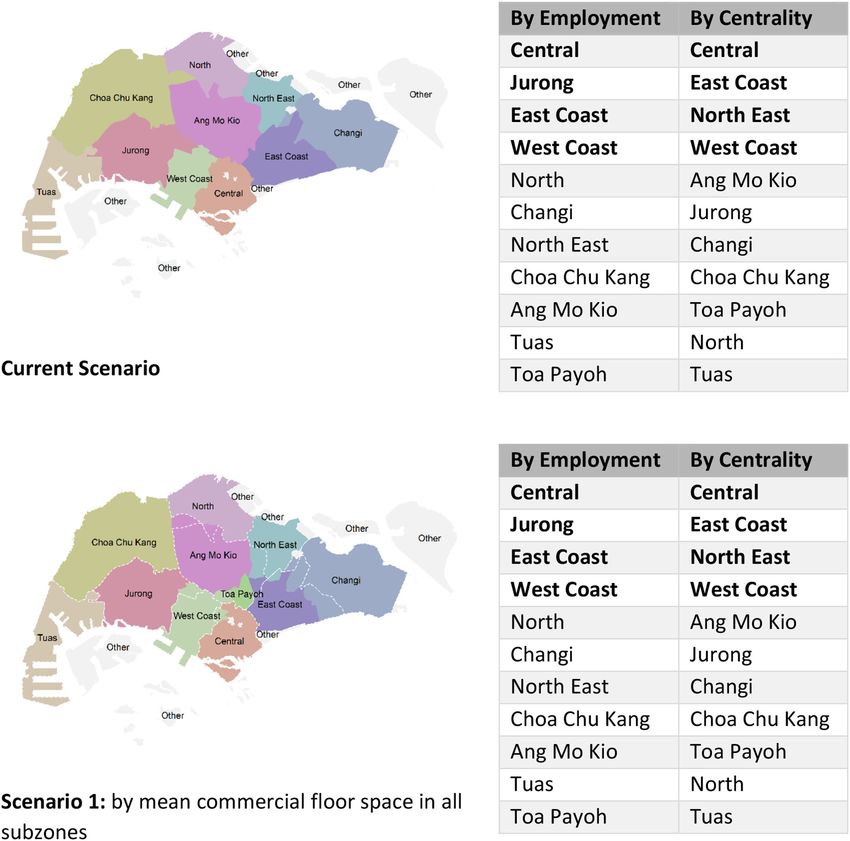
C. Wu et al. Computers, Environment and Urban Systems 89 (2021) 101677
polycentric model (Zhong et al., 2014). Third, with its smart nation widely across Singapore, employment opportunities are clustered in
initiative (Chang & Das, 2020), Singapore provides various open data certain areas. This has resulted from the specific geography and history
and encourages their application in research. of Singapore (Yuen, 1998). The change in job-housing balance is
The subzone is used as the unit of analysis in this study. Singapore believed to lead to a change in commuting trips (Cervero & Duncan,
has deployed a hierarchical planning division system: The Singapore 2006); hence spatial interaction is the focus of this paper.
city was divided into five planning regions and was further divided into
subzones. A subzone is a basic sub-division of Singapore’s planning unit. 3.2. Public transport commuting data
There are a total number of 323 subzones of various sizes. Fig. 1A and B
show the subzone with its population and commercial floor space, The public transport commuting data are also obtained from the
respectively. A significant number of smaller area subzones are open data portal provided by the Land Transport Authority (LTA) of
concentrated on the traditional urban centre. The subzone is the smallest Singapore. The LTA is a public agency responsible for planning, devel
planning unit where census data is available for public access, making it oping, and maintaining the land transport infrastructure and systems.
ideal for analysis. There are two types of data involved in this study: the Two sets of data are used: bus and rail transit data between different
census data, including the number of residents, and the aggregated stations on an hourly basis for weekends and weekdays in May 2019.
commercial floor space. The second type of data is spatial interaction Based on the research scope, only weekdays data is kept. The public
data. This study uses the morning public transport commuting data to transport volume over time is presented in Fig. 2 below:
calibrate the spatial interaction model for jobs-housing spatial interac There are 6,634,544 bus trip records and 803,592 train trip records.
tion. The data processing method and a description of data are intro It can be observed that the morning peak lasts four hours, from 6 am to 9
duced below. am. Following Zhong et al. (2016), this study selected the morning peak
data on weekdays to simulate the jobs-housing spatial interaction as it is
3.1. Census data a better representation and shows more regularity (Zhong et al., 2016).
This study aggregates the flow between the bus stops and train stations
As shown in Fig. 1, two census variables at the subzone level are based on their subzone located. The bus flow and train flow can thus be
utilised in this study: Population, which accounts for the number of merged into one public transport commuting network. Note that the bus
residents in the subzone, and commercial floor space, which accounts stop and train station are absent in some subzones. Hence there is no
for employment size. The census data are open data published by the flow connection, and they are absent from the network. The result is a
Singapore government and accessed through the open data platform (da matrix that contains the travel between all the subzones in Singapore.
ta.gov.sg). It is a data portal launched in 2011 as an initiative by the
Singapore government to provide a one-stop portal for open data from 4. Proposed workflow and methods
public agencies.
The population census data provides the number of residents in June 4.1. Proposed workflow
2017 in different subzones of Singapore. There are a total of 3,966,030
residents recorded, excluding foreign workers and travellers. The dis This paper aims to study the dynamic urban spatial structure in terms
tribution of the residents in Singapore varies between different sub of polycentricity for four different employment distribution scenarios
zones. Subzones in the traditional building districts and satellite towns and proposed a workflow (Fig. 3) using network community detection
have a high concentration of residents; subzones with a lower number or and spatial interaction models. Spatial interaction network, particularly
no residents mostly undeveloped reserve land or dedicated to a specific the jobs-housing spatial interaction, is used to detect the urban centres
use such as nature reserve, port, and industrial zones. The population and the resulting functional polycentricity. This study calibrated a
census data in this study will be used as the housing choice for Singa production-constrained spatial interaction model (Clarke, Langley, &
pore’s residents. Cardwell, 1998) via the morning peak traffic flow to simulate the jobs-
Commercial floor space (by square metre) is estimated for the housing spatial interaction network under the four different urban
different subzones in Singapore. The Singapore master plan 2014 pro employment distribution scenarios. The detailed workflow is illustrated
vides information about land use, Gross Plot Ratio (GPR), and land area below, and this section will go through details about the different
for the land parcels dedicated to urban use. The GPR is the index methodologies applied in this study. The unit of analysis is the subzone
deployed by the Singapore urban planning authority to control the which is the smallest planning unit of Singapore and also where the
development intensity and GPR = Gross Floor Area/Land Area. The floor census data is available at the most refined scale.
area can thus be calculated using the GPR times land area. This study
considers urban floor space that could be used for employment and work 4.2. Employment distribution scenarios
to be commercial and could be used as a proxy for employment. To
determine the commercial floor space, we consider retail, office, busi Employment is represented by the commercial floor space in this
ness park, and some civic land listed in the master plan to be commer study, and we proposed four different employment distribution sce
cial. Since the master plan does not represent the current urban narios. We are interested in how people’s jobs-housing interaction and
development state with many land parcels undeveloped, we overlayed the resulting dynamic urban spatial structure will change with the
the land parcels with the existing buildings to identify and remove the relocation of employment opportunities. Many modern urban planning
undeveloped land parcels from the calculation of the current commer theories and practices promote bringing jobs closer to home and mixed
cial floor space. The existing buildings were extracted from the open land use for smart urban growth to address the increasing challenge of
street map in June 2019. With the commercial floor space for each land urban expansion and spatial mismatch, such as increasing commuting
parcel been estimated, it is aggregated according to their allocated time (Cervero & Duncan, 2006). Numerous studies have also explored
subzone. The resulting distribution of commercial floor space (Fig. 1B) the relationship between employment distribution and cities’ perfor
showed that the employment opportunities are prominent in the south mance (Arribas-Bel & Sanz-Gracia, 2014; Hu et al., 2020; Tomasiello
and the east coast region. et al., 2020). Under this circumstance, Singapore has already listed
The employment represented by the commercial floor space and the “Bringing jobs closer to home” as an essential agenda in its urban
population could be used to study the relationship between jobs and development policy. This means the government is planning to improve
housing, an established research topic in transportation studies (Cervero the jobs-housing balance by bringing more job opportunities to where
& Duncan, 2006; Hu et al., 2020; Zhou et al., 2016). A spatial mismatch the working population is located. This could potentially improve the
is apparent in Singapore. While the population is generally distributed spatial mismatch. The commercial floor space estimated in this research
4
C. Wu et al.                                    Computers, Environment and Urban Systems 89 (2021) 101677

               Fig. 1. Subzones in Singapore.

                             5
C. Wu et al. Computers, Environment and Urban Systems 89 (2021) 101677
120
Millions
Peak
100
80
Trip Count
60
40
20
0
0 1 2 3 4 5 6 7 8 9 10 11 12 13 14 15 16 17 18 19 20 21 22 23
Time
Fig. 2. Public transport trip count by hour.
Fig. 3. Proposed workflow.
includes office floor space and retail floor space, which associate with closer to home”. The commercial floor space is redistributed through our
service industries, which account for approximately 75% of Singapore unit of analysis: the subzones. Some focus more on balance between the
employment, according to the Singapore Ministry of Manpower. Using subzones like Scenario 1 and Scenario 2; some focus on balance in terms
Singapore as an example, we redistribute the employment via the of spatial distribution like Scenario 3; Last but not least, some focus on
redistribution of commercial floor space into the subzones. Each sce the balances between residents like Scenario 4, which the jobs-housing
nario is proposed to make the employment less centralised to reduce the balance is best achieved. Although they are purely theoretical, all four
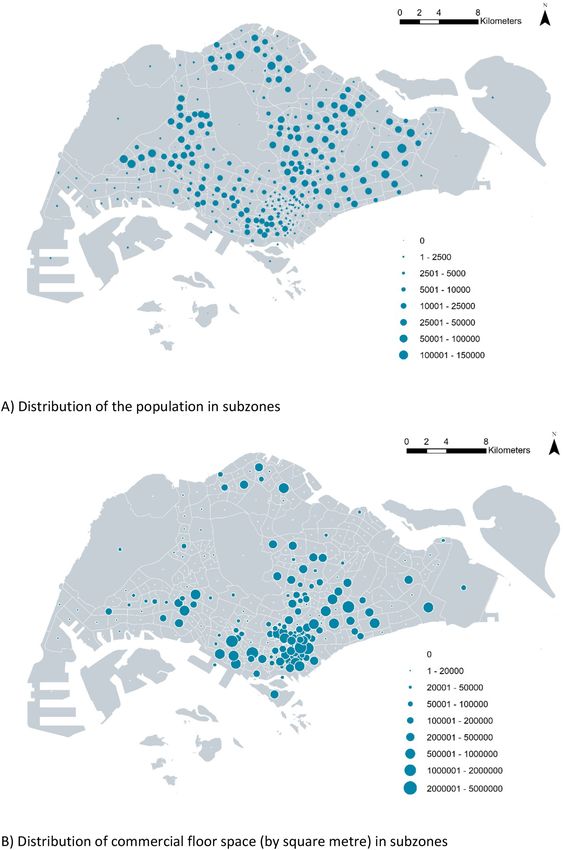
spatial mismatch. The details of the four different scenarios we proposed scenarios are a potential solution to the current spatial mismatch. Due to
in addition to the current situation are listed below with descriptive data the division of subzones and the population distribution, the commercial
(Table 1 and Fig. 4). distribution also shows different patterns.
The above scenarios showed four different urban policies to
distribute the commercial floor space in the principle of “Bringing jobs 4.3. Simulate urban spatial interaction: spatial interaction model
To simulate the spatial interaction between the commercial floor
Table 1 space and the residents, namely the jobs-housing interaction, we pro
Descriptive data for commercial floorspace (by m2).
posed a simple production constrained spatial interaction model
Scenario 1 Scenario 2 Scenario 3 Scenario 4 (Fotheringham, 1983). The subzone’s resident population is used as the
Mean 114,340 114,340 114,340 114,340 origin attribute, which generated the outflow of trips. The commercial
Median 114,340 214,720 57,809 39,576 floor space is used as the destination attribute that attracts the trips.
Standard Deviation 0 107,254 349,359 9241 Since this study is a preliminary attempt of the workflow to study the
Sum 36,932,007 36,932,007 36,932,007 36,932,007
different employment distribution scenarios, the changes in population
6C. Wu et al. Computers, Environment and Urban Systems 89 (2021) 101677
Fig. 4. Proposed distribution of commercial floor space in subzones (by m2).
and travel distance between subzones were not considered. Using the subzones, and the edges are the spatial interaction between them. This
existing traffic flow data, current population, and commercial floor paper uses the calibrated formula to recalculate spatial interaction
space distribution, we can calibrate the formula and simulate future under the current scenario. It will be used as the baseline for comparison
traffic flow with changes in the commercial floor space. The formula is of the change in urban spatial structure and polycentricity. The cali
given as follows: brated spatial interaction is preferred over the public transport data to
serve as the baseline, the current situation, as it can better reflect the
Tij = Ai Oi Dj α cij − β
changes between different scenarios and is a better representation of the
jobs-housing interaction. Hence, five spatial interaction networks are
where Tij denotes the number of jobs-housing interactions between
produced in this step, including the four proposed employment sce
origin subzone i and destination subzone j (i.e., the flow between origin i
narios and the current one that serve as the baseline. The baseline
and destination j). Oi is the number of residents that need to travel for
(current scenario) has a mean travel distance of 3718 meters. The pro
work. Ai is the total outflow of the origin. Dj is the commercial floor
posed scenarios 1,2,3, and 4 have a mean travel distance of 3502, 3700,
space, representing the employment opportunity that attracts flows into
3485 and 3459 meters, respectively. These networks could be used
j. cij is the friction or the cost of travelling between i and j, which is
further to determine urban clusters via network community detection
proxied by distance in this study. α and β are parameters for the
and measure the functional polycentricity.
respective attributes, which need to be estimated with known attributes:
Tij, Oi, Dj and cij.
4.4. Network community detection
To calibrate the model, this study used the morning peak public
transport travel as the number of residents and current estimation of
This study’s spatial interaction network is a directed network
commercial floor space in the subzones as Tij, Oi, Dj, respectively. The
weighted by the volume of the interaction. Thus, the Infomap method
calibrated best fit value for α and β is 0.06744 and 1.73152, respectively
ology (Rosvall, Axelsson, & Bergstrom, 2009) is applied here for its best
with coefficient of determination at 0.47. These parameters show that
performance, as stated in the literature review. The community detec
subzones with more commercial floor space will attract more urban
tion decomposes complex networks into different modules based on
flow; the longer the travel distance, the less attractive a subzone is.
their internal interactions for ease of analysis. The Infomap method uses
Assuming the population (Oi) in each subzone and the travel distance cij
the map equation instead of modularity as the parameter to determine
is unchanged, the calibrated model can simulate the jobs-housing
community detection results. The map equation “specifies the theoret
interaction for the four different scenarios with the new employment
ical limit of how concisely we can describe the trajectory of a random
(Dj) value.
walker on the network “(Rosvall et al., 2009, p. 1) and can better be used
The result of this step is the four spatial interaction networks under
for focuses on the flows of the network for partition. The lower the map
the four different scenarios we proposed. The nodes are the different
equation, the better the community detection results. A more detailed
7C. Wu et al. Computers, Environment and Urban Systems 89 (2021) 101677
description of the map equation and algorithm could be found in Ros 2019), a fixed number of urban centres/communities are selected to
vall, Axelsson, and Bergstrom’s paper(Rosvall et al., 2009). measure the polycentricity: the top 4 in terms of commercial floor space
The Infomap community detection method can be implemented in R and in-degree centrality, respectively. This paper selects four urban
using the igraph package (https://igraph.org/r/). The four spatial centres due to Singapore’s geographic character. With a natural reser
interaction networks simulated with the spatial interaction model and voir in the middle, four urban centres could be identified in the South,
the baseline scenario were analysed using the Infomap community North, East, and West of Singapore. The slope of the regression line of
detection method using igraph in R. The network was divided into the rank-size distribution is used to measure the degree of polycentricity,
different sub-networks with each subzone in the network assigned with commercial floor space assessing the morphological polycentricity
membership an urban community. Subzones belonging to the same and the Centrality assessing the functional polycentricity.
urban community are considered to have close relationships. The
changes in the urban community border and indicate changes in spatial 5. Results and discussion
interaction. These urban communities describe the urban spatial struc
ture and could be regarded as different urban centres to measure 5.1. Urban communities and urban centres
polycentricity.
The first result regarding the dynamic urban spatial structure is the
urban communities detected from the spatial interaction. The proposed
4.5. Measuring the polycentricity method also suggested that the urban centres could be identified from
these urban communities to act as the analysis unit to measure poly
There are two types of polycentricity involved in this study: centricity. The five sets of spatial interaction networks generated
morphological and functional polycentricity. The polycentricity is different results for urban communities. The detection results are dis
measured using urban centres as the unit of analysis. Instead of using played as follows, the dashed white line in the four proposed scenarios
traditional administrative boundaries, we use the community detected indicates the original border in the current scenario for easy contrasting.
as the unit of analysis to measure polycentricity. Commercial floor space The order of the urban community is ranked by employment and Cen
and Centrality are the indicators selected to measure the morphological trality (Fig. 5).
and functional polycentricity, respectively. The details of these in The overall structure and distribution of the urban communities are
dicators could be found in Table 2. largely consistent with the distribution of the employment changes.
The commercial floor space is a straightforward measurement. The Major urban communities could be identified with ease: the central
commercial floor space (C) in each urban community will be calculated community located at the traditional CBD in the southern tip of
by aggregating the commercial floor space of the commercial buildings Singapore island, the East Coast and Changi community along the east
(ci) in their constituted subzones. The commercial floor space is calcu coastline, the Jurong and West Coast community in the west coastline,
lated earlier, and details could be found in the data section. For Cen the North and Punggol community on the north of the island. The Tuas
trality, this study adopted the definition in Burger and Meijers’ (2012) community is an industrial cluster. The urban community detection’s
research with some simplification to suit the study’s urban scale. Here consistency may reflect the strong influence of current physical infra
this study uses the total number of flows directed to the urban com structure in the urban spatial structure dynamics. However, changes
munity as the measurement for functional polycentricity, which ex could still be observed, like the shifting boundary of the urban com
cludes the internal flow. As the indicator for functional polycentricity, munity and the emerging of smaller urban communities like Woodlands
which focuses on the balance between the interaction of the urban and Paya Lebar. Since urban communities’ distribution mostly follows
communities, the Centrality is the inter-community trips. The higher the the Singapore land’s geographic character, with urban development
numberer of trips from the external community, the higher the Cen around the central reservoir in four directions, this study deems four
trality. It could also be regarded as the In-degree centrality, which is the urban centres sufficient to measure the polycentricity.
total number of trips going into the urban community excluding the To measure the polycentricity, this study ranks the urban commu
loop. The spatial interaction network is simplified into the urban com nities according to their commercial floor space and Centrality. In terms
munities’ spatial interaction network to calculate the urban commu of ranking, the employment ranking and Centrality ranking display
nities’ Centrality. We apply this to all five scenarios, including the different trends across scenarios. In general, the urban communities’
current and proposed commercial floor space distribution situation. employment ranking varies tremendously, and the centrality ranking
A rank-size method is used to measure the polycentricity with a log appears to be very consistent with the different employment distribution
transformation to ensure better results (Gabaix & Ibragimov, 2011). In strategies. The top four urban communities by Centrality are consis
line with previous literature (Burger & Meijers, 2012; Wang et al., tently Central, East Coast, North East, and West Coast community, which
coincide with Singapore’s geographic character. These discrepancies
Table 2 between the ranking in employment distribution and centrality ranking
Indicators for urban polycentricity calculation. show that the sheer size of commercial floor space may not attract
Indicator Polycentricity Formula Description proportional urban flow. Other than the commercial floor space, other
Commercial Morphological C=
∑
ci The commercial floor space (C)
factors also impact the spatial interaction not included in the model.
Floor Space (by m2) is equal to all the sum of all the With the top four urban communities, this study proceeds to measure the
floor space of the buildings (ci) polycentricity of the overall urban spatial structure.
that is related to commercial
activities in the urban
community.
5.2. Polycentricity
Centrality Functional Centrality The Centrality is a
= Tj − tj measurement of the Building on the current situation, four commercial floor space allo
attractiveness of the urban cation scenarios are tested, as stated in the methods. Each of the
community. It is the number of
morphological and functional polycentricity was compared against
trips originate from the outside
of the community j which is those in the current scenario. The results are illustrated in Fig. 6 and
equal to the number of total indicated how spatial planning practices might impact the dynamic
trips destinates to community j urban spatial structure.
(Tj) minus the internal trips of In Scenario 1, we simply distributed the commercial place evenly
community j (tj).
across the subzones in Singapore. Regardless of their population, size,
8C. Wu et al. Computers, Environment and Urban Systems 89 (2021) 101677
Fig. 5. Community detection results.
and location, each subzone will have a fixed commercial floor space of residents of Singapore. Depending on the number of residents, each
approximately 114,040 square meters. The result is an increase in subzone will be assigned the commercial floor space that is proportional
morphological polycentricity and a slight increase in functional poly to the residents while the total commercial floor space area is conserved.
centricity. This is expected as the evenly distributed commercial floor By doing so, Singapore has become increasingly morphologically poly
space across the subzones contributed to the increasing polycentricity of centric in a significant way. Since the commercial floor space is directly
commercial floor space. This also results in a more balanced spatial proportional to the resident population, Singapore’s increasing
interaction between the different urban communities as people have a morphological polycentricity indicated that the population is roughly
more balanced choice for work or shop. Thus, increased the functional even between the top four communities detected. In terms of functional
polycentricity of the urban system. polycentricity, the spatial interaction between the communities has also
In Scenario 2, commercial floor space is evenly distributed across become more balanced. This is expected as the more balance the dis
subzones with residents. Subzones with no residents are not assigned to tribution of commercial floor space, the more balanced the people’s
any commercial floor space. The decreasing morphological poly motivation to travel to different communities.
centricity may have resulted from the smaller division subzones clus In Scenario 4, the distribution of commercial floor space focuses on
tered at the traditional central business district resulting in a strong geographic balance. Each subzone with the residence was assigned the
urban centre. While other communities typically consisted of fewer commercial floor space proportional to the land area. The resulting
subzones, the larger area was further split into smaller communities polycentricity is similar to Scenario 1, with the degree of morphological
according to the dynamic urban structure’s detection results. As com and functional polycentricity both increased.
mercial floor space distribution becomes monocentric, people’s desire to
travel for work and entertainment also increased, leading to a more 6. Discussion
polarised travel pattern and decreasing functional polycentricity.
In Scenario 3, the commercial floor space is equally assigned to the First, concerning the “Bring jobs closer to home” urban planning
9C. Wu et al. Computers, Environment and Urban Systems 89 (2021) 101677
Fig. 5. (continued).
10C. Wu et al. Computers, Environment and Urban Systems 89 (2021) 101677
Polycentricity
0.0
-0.9 -0.8 -0.7 -0.6 -0.5 -0.4 -0.3 -0.2 -0.1 0
-0.1
-0.2
FUNCTIONAL
-0.3
Scenario 4
Scenario 1 -0.4
Scenario 3
-0.5
Current Scenario
Scenario 2
-0.6
MORPHOLOGICAL
Fig. 6. Morphological and functional polycentricity.
policy, the proposed workflow has simulated dynamic urban spatial the effect of planning on the dynamic urban spatial structure is also
structure and measured respective polycentricity using a different dis profound. Hence, the alteration of spatial interaction also needs to be
tribution of commercial floor space. This workflow provides opportu included in the decision-support mechanism for a better and holistic
nities to evaluate the specific urban policy’s impact from both spatial urban policymaking and planning process.
and dynamic perspectives. With different scenarios as a different degree Third, such a result brings us to the notion that simulation is part of a
of policy implementation, i.e., jobs-housing balance, the urban policy’s planning support system. As stated earlier in this paper, with informa
effect also varies. In general, the “Bring jobs closer to home” policy has tion technology and data, simulation has deeply embedded in the cur
resulted in a more decentralised urban spatial structure by the number rent planning support system (Dong, Ma, Cheng, & Xin, 2017). This
of urban communities detected. Although the centrality ranking for the study’s proposed workflow has combined the popular spatial interaction
top four urban communities largely remains unchanged, it still results in model with the emerging polycentricity measurement to simulate the
a more balanced urban spatial structure in terms of morphological and urban spatial structure. This added new perspectives and dimensions to
functional polycentricity. In the extreme case scenario three, the “Bring the planning support system with existing tools and technology. As
jobs closer to home” concept is most thoroughly implemented and polycentric development is increasingly emphasised in literature and
achieved the optimum polycentricity. This coincides with the policy’s practices (Taubenböck, Standfuß, Wurm, Krehl, & Siedentop, 2017;
intention, which is to achieve a more balanced jobs-housing interaction. Wang, 2021), this workflow will help urban planners and policymakers
It could be further concluded that the different distribution of the predict the effect of specific urban policies on the urban spatial structure
commercial floor space, or the employment opportunities it represents, in terms of both morphological and functional polycentricity.
will impact both the dynamic urban spatial structure and the poly
centricity. Although assessing a specific urban policy or planning strat 7. Conclusion
egy requires an evaluation from multiple perspectives, our proposed
workflow provides potential justification from an urban spatial structure This research has proposed a new workflow using urban spatial in
aspect. teractions to simulate and measure the dynamic urban spatial structure
Second, in terms of polycentricity, this study could generalise that with polycentricity. Using Singapore as a case study, this study detected
redistribution of employment closer to the residents could lead to a more and measured Singapore’s dynamic urban spatial structure using the
polycentric dynamic urban spatial structure, both morphologically and urban centres identified through spatial interaction networks. We have
functionally, from the simulation result. It could also be observed that also explored how these spatial interactions could change with different
the increasing morphological polycentricity was always accompanied by commercial floor space allocation scenarios across Singapore; thus, it
increasing functional polycentricity. This indicates the correlation be predicted how commercial floor space allocation would affect the dy
tween the two polycentricity, as stated in the existing literature (Burger namic urban structure. Two types of polycentricity are involved in this
& Meijers, 2012). From this evidence, we could suggest that the degree research to describe the urban spatial structure. Our simulation results
of polycentricity could be altered through urban policies and planning. suggest that urban planning practice could alter the static and dynamic
Neverthless, one caveat is that the urban polycentricity measure adopted urban spatial structure; the increasing morphological polycentricity is
in this study is only one specific attempt of measurement. As (Derudder, always accompanied by functional polycentricity, suggesting its positive
Liu, Wang, Zhang, Wu & Caset, 2021) point out, various conceptual and correlation.
empirical concerns may lead to different polycentric urban development This study concluded that the proposed work could add value to the
measures. While the modification of static urban spatial structure with existing PSS by providing a new perspective on assessing urban policies
urban planning policy is obvious and has been practised for a long time, that focus on the urban spatial structure and polycentric development.
our finding suggests the underlying interactions between the static and Although the preliminary case study has shown the workflow’s potential
dynamic urban spatial structure also gone through changes. The means to help urban planners and policymakers, some inherent limitations still
11C. Wu et al. Computers, Environment and Urban Systems 89 (2021) 101677
need to be considered. First, this study only experiments with the Burger, M. J., van der Knaap, B., & Wall, R. S. (2014). Polycentricity and the Multiplexity
of urban networks. European Planning Studies, 22(4), 816–840. https://doi.org/
workflow and model at a theoretical level; its practical use is still un
10.1080/09654313.2013.771619.
certain. The scenarios proposed in the case study are hypothetical Cervero, R., & Duncan, M. (2006). Which reduces vehicle travel more: Jobs-housing
compared to policy implementation in reality; the redistribution of balance of retail-housing mixing? Journal of the American Planning Association, 72(4),
commercial floor space is unlikely to happen at such a dramatic scale 475–490. https://doi.org/10.1080/01944360608976767.
Chang, F., & Das, D. (2020). Smart nation Singapore: Developing policies for a citizen-
due to various social-economic constraints. Hence, the scenario we oriented Smart City initiative. In Developing National Urban Policies (pp. 425–440).
explored is limited at the theoretical level and may not be directly Singapore: Springer. https://doi.org/10.1007/978-981-15-3738-7_18.
transferrable to aid decision-making in practice. Second, the imple Chen, M., Arribas-Bel, D., & Singleton, A. (2019). Understanding the dynamics of urban
areas of interest through volunteered geographic information. Journal of
mentation of urban policy is much more complicated than the simplified Geographical Systems, 21(1), 89–109. https://doi.org/10.1007/s10109-018-0284-3.
model in this study. It is essential to acknowledge that there are many Chen, T., Hui, E. C. M., Wu, J., Lang, W., & Li, X. (2019). Identifying urban spatial
more factors in play when considering the jobs-housing interaction other structure and urban vibrancy in highly dense cities using georeferenced social media
data. Habitat International, 89, 102005. https://doi.org/10.1016/j.
than commercial floor space distribution. To name a few, factors such as habitatint.2019.102005.
the transport infrastructure (Erlander & Stewart, 1990; Tsekeris & Sta Clarke, G., Langley, R., & Cardwell, W. (1998). Empirical applications of dynamic spatial
thopoulos, 2006), people’s choice for housing and labour markets interaction models. Computers, Environment and Urban Systems, 22(2), 157–184.
https://doi.org/10.1016/S0198-9715(98)00021-0.
(Hincks & Wong, 2010), and provision of municipal service (Lundberg, De Souza, R., Lau, H. C., Goh, M., Lindawati, N., W. S, & Tan, P. S. (2016). Retail precinct
2006). They all have a profound impact on the resulting spatial inter management: A case of commercial decentralization in Singapore. In , 12.
action and dynamic spatial structure. A holistic urban policy is likely to Transportation research procedia (pp. 765–776). BV: Elsevier. https://doi.org/
10.1016/j.trpro.2016.02.030.
also look into these factors. Thirdly, the jobs-housing imbalance and
Derudder, B., Liu, X., Wang, M., Zhang, W., Wu, K., & Caset, F. (2021). Measuring
spatial mismatch mentioned in this paper are examples of potential polycentric urban development: the importance of accurately determining the
topics studied through the urban spatial structure using the proposed “balance” between “urban centers”. Cities, 111, Article 103009. j.
workflow. The discussion and exploration of these topics remain at an cities.2020.103009.
Development Department (HKSAR). (2016). Hong Kong 2030+: Towards a Planning Vision
early stage. For example, more potential issues like social segregation, and Strategy Transcending 2030.
inequality, and unemployment are associated with a spatial mismatch, Dong, J., Ma, C., Cheng, W., & Xin, L. (2017). Data augmented design: Urban planning
which requires more sophisticated research and discussion. Hence, the and design in the new data environment. In 2017 IEEE 2nd International Conference
on Big Data Analysis, ICBDA 2017 (pp. 508–512). Institute of Electrical and
research scope and effort constraints reframe us from drawing a further Electronics Engineers Inc.. https://doi.org/10.1109/ICBDA.2017.8078685
conclusion on the topics. Lastly, this workflow only simulated the dy Erlander, S., & Stewart, N. F. (1990). The Gravity Model in Transportation Analysis: Theory
namic urban spatial structure in terms of polycentricity; it still requires and Extensions (p. 226) (p. 226). Zeist VSP Publishers 1990 [publisher not
identified]. Retrieved from http://books.google.com/books?hl=en&lr=&id=t
other models to simulate the urban policy’s overall performance from Id3PU1leR8C&pgis=1.
other aspects. After all, the urban spatial structure and polycentricity are Fotheringham, A. S. (1983). A new set of spatial-interaction models: The theory of
only part of the story for a better and more sustainable built competing destinations. Environment and Planning A: Economy and Space, 15(1),
15–36. https://doi.org/10.1177/0308518x8301500103.
environment. Gabaix, X., & Ibragimov, R. (2011). Rank- 1/2: A simple way to improve the ols
Nevertheless, these limitations suggest future works that could help estimation of tail exponents. Journal of Business and Economic Statistics, 29(1), 24–39.
the workflow achieve its full potential as part of a PSS. This workflow https://doi.org/10.1198/jbes.2009.06157.
Gao, S. (2015). Spatio-temporal analytics for exploring human mobility patterns and
could be applied to actual planning practices where the implementation
urban dynamics in the Mobile age. Spatial Cognition and Computation, 15(2), 86–114.
of urban planning policy is way more realistic. By doing so, we could https://doi.org/10.1080/13875868.2014.984300.
evaluate the sensibility of this workflow and determine its usefulness to Gao, S., Liu, Y., Wang, Y., & Ma, X. (2013). Discovering spatial interaction communities
actual planning practice. Another potential direction of future work is to from mobile phone data. Transactions in GIS, 17(3), 463–481. https://doi.org/
10.1111/tgis.12042.
refine further the spatial interaction model applied in the workflow with Green, N. (2007). Functional polycentricity: A formal definition in terms of social
actual planning practice. For example, the allocations of residence, network analysis. Urban Studies, 44(11), 2077–2103. https://doi.org/10.1080/
commercial floor space, and transportation infrastructure improvements 00420980701518941.
Guo, D. (2009). Flow mapping and multivariate visualization of large spatial interaction
can be accounted for concurrently for more nuanced simulations. data. IEEE Transactions on Visualization and Computer Graphics, 15(6), 1041–1048.
https://doi.org/10.1109/TVCG.2009.143.
Acknowledgements Guy, C. M. (1991). Spatial interaction modelling in retail planning practice: The need for
robust statistical methods. Environment and Planning. B, Planning & Design, 18(2),
191–203. https://doi.org/10.1068/b180191.
The authors are very grateful for the valuable comments and sug Harris, B., & Batty, M. (1993). Locational models, geographic information and planning
gestions made by the editor and anonymous reviewers. All remaining support systems. Journal of Planning Education and Research, 12(3), 184–198. https://
doi.org/10.1177/0739456X9301200302.
errors are our own. The usual disclaimers apply. Hasegawa, Y., Sekimoto, Y., Seto, T., Fukushima, Y., & Maeda, M. (2019). My City
forecast: Urban planning communication tool for citizen with national open data.
References Computers, Environment and Urban Systems, 77, 101255. https://doi.org/10.1016/j.
compenvurbsys.2018.06.001.
Hincks, S., & Wong, C. (2010). The spatial interaction of housing and labour markets:
Adolphson, M. (2009). Estimating a polycentric urban structure. Case study: Urban
Commuting flow analysis of north West England. Urban Studies, 47(3), 620–649.
changes in the Stockholm region 1991–2004. Journal of Urban Planning and
https://doi.org/10.1177/0042098009349777.
Development, 135(1), 19–30. https://doi.org/10.1061/(ASCE)0733-9488(2009)135:
Horner, M. W., & Mefford, J. N. (2007). Investigating urban spatial mismatch using
1(19).
job–housing indicators to model home–work separation. Environment and Planning A:
Anas, A., Arnott, R., & Small, K. A. (1998). Urban spatial structure. Journal of Economic
Economy and Space, 39(6), 1420–1440. https://doi.org/10.1068/a37443.
Literature, 36(3), 1426–1464. https://doi.org/10.1007/978-1-349-04537-2_6.
Hu, L., Yang, J., Yang, T., Tu, Y., & Zhu, J. (2020). Urban spatial structure and travel in
Arribas-Bel, D., & Sanz-Gracia, F. (2014). The validity of the monocentric city model in a
China. Journal of Planning Literature, 35(1), 6–24. https://doi.org/10.1177/
polycentric age: US metropolitan areas in 1990, 2000 and 2010. Urban Geography, 35
0885412219853259.
(7), 980–997. https://doi.org/10.1080/02723638.2014.940693.
Huang, D., Liu, Z., & Zhao, X. (2015). Monocentric or polycentric? The urban spatial
Batty, M., & Mackie, S. (1972). The calibration of gravity, entropy, and related models of
structure of employment in Beijing. Sustainability, 7(9), 11632–11656. https://doi.
spatial interaction. Environment and Planning A: Economy and Space, 4(2), 205–233.
org/10.3390/su70911632.
https://doi.org/10.1068/a040205.
Krehl, A. (2015). Urban spatial structure: An interaction between employment and built-
Batty, M., & Cheshire, J. (2011). Cities as flows, cities of flows. Environment and Planning.
up volumes. Regional Studies, Regional Science, 2(1), 290–308. https://doi.org/
B, Planning & Design, 38(2), 195–196. https://doi.org/10.1068/b3802ed.
10.1080/21681376.2015.1034293.
Bertaud, A. (2004). The spatial organization of cities: deliberate outcome or unforeseen
Lancichinetti, A., & Fortunato, S. (2009). Community detection algorithms: A
consequence?.
comparative analysis. Physical Review E - Statistical, Nonlinear, and Soft Matter
Burger, M., & Meijers, E. (2012). Form follows function? Linking morphological and
Physics, 80(5). https://doi.org/10.1103/PhysRevE.80.056117.
functional Polycentricity. Urban Studies, 49(5), 1127–1149. https://doi.org/
Liu, X., Gong, L., Gong, Y., & Liu, Y. (2015). Revealing travel patterns and city structure
10.1177/0042098011407095.
with taxi trip data. Journal of Transport Geography, 43, 78–90. https://doi.org/
10.1016/j.jtrangeo.2015.01.016.
12You can also read