COVID-19 and Unemployment Risk: Lessons for the Vaccination Campaign
←
→
Page content transcription
If your browser does not render page correctly, please read the page content below
COVID-19 and Unemployment Risk:
                                                                    Lessons for the Vaccination Campaign
                                                                Valentina Pieroni1 , Angelo Facchini1∗ , Massimo Riccaboni1
                                                                              1
                                                                                IMT School for Advanced Studies, Lucca
                                                                        ∗
arXiv:2102.03619v2 [physics.soc-ph] 25 Mar 2021

                                                                            corresponding author: angelo.facchini@imtlucca.it

                                                                                          March 26, 2021

                                                                                              Abstract

                                                       Assessing the economic impact of COVID-19 pandemic and public health policies is
                                                       essential for a rapid recovery. In this paper, we analyze the impact of mobility contrac-
                                                       tion on furloughed workers and excess deaths in Italy. We provide a link between the
                                                       reduction of mobility and excess deaths, confirming that the first countrywide lockdown
                                                       has been effective in curtailing the COVID-19 epidemics. Our analysis points out that
                                                       a mobility contraction of 10% leads to a mortality reduction of 5% whereas it leads to
                                                       an increase of 50% in full time equivalent furloughed workers. Based on our results, we
                                                       propose a prioritizing policy for the most advanced stage of the COVID-19 vaccination
                                                       campaign, considering the unemployment risk of the healthy active population.

                                                       keywords: COVID-19 mortality; Furlough schemes; Economic impact of lockdowns;
                                                       Vaccination rollout: Unemployment risk

                                                  1    Introduction
                                                  The spread of the novel coronavirus (SARS-CoV-2) worldwide and the subsequent enforce-
                                                  ment of strict containment measures by several national governments have severely impacted
                                                  the world economy, which shrank by 4.3% in 2020 (Chetty et al., 2020, World Bank, 2021).
                                                  On the supply side, social distancing measures placed workers under stay-at-home orders,
                                                  shut down ‘non-essential’ activities and challenged supply chains. On the demand side, the
                                                  pandemic has reduced consumer spending, virtually wiping out demand in entire economic
                                                  sectors. A whole bunch of literature analyzes the actual effectiveness of the most restrictive
                                                  policies, such as countrywide lockdown, in preventing the contagion by reducing mobility
                                                  flows and discouraging social interactions (Acemoglu et al., 2020, Favero et al., 2020, Yoo
                                                  and Managi, 2020), pointing out the theoretical principles and frameworks behind con-
                                                  tainment policies (Besley and Stern, 2020). In particular, recent work has shown mobility
                                                  reductions to be followed by a significant drop in the number of new COVID cases and the
                                                  death toll (Farboodi et al., 2020, Glaeser et al., 2020, Warren and Skillman, 2020).

                                                                                                  1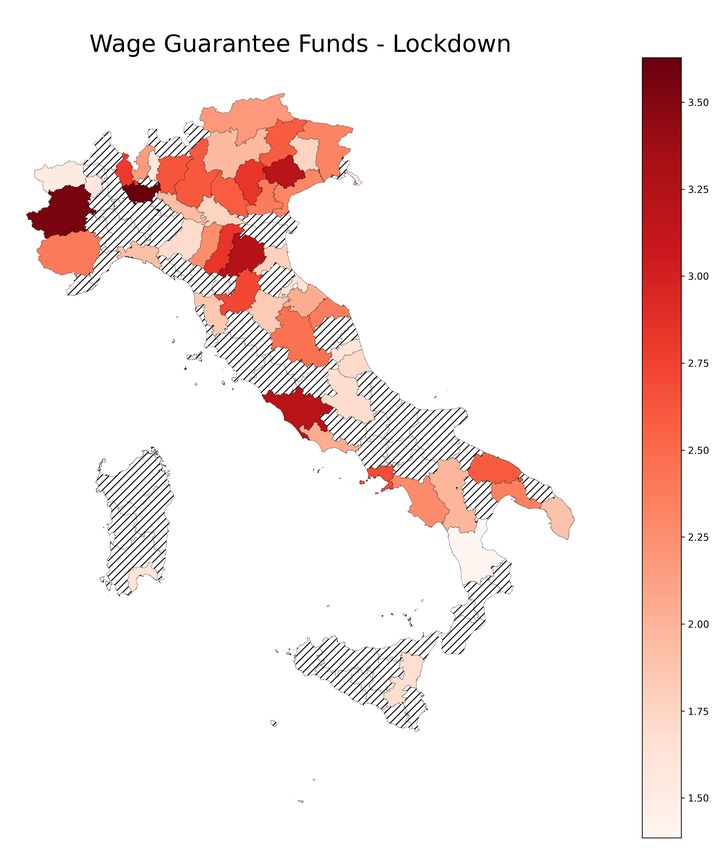
Although a stream of literature has largely investigated the epidemiological and socio-
economic consequences of lockdown measures, there is still a paucity of evidence about the
effect of reducing mobility on employment (Fana et al., 2020). To fill this gap, in this paper,
we investigate the implications of the containment policies by considering the number of
working hours allowed by the Italian government to be covered by the Wage Guarantee
Fund in the aftermath of the first countrywide lockdown in 2020.
    This aspect is relevant for two main reasons. On the one hand, the impact of the
Covid-19 crisis on Italian workers is dramatic, with 444 thousand jobs lost in 20201 . This
is on top of 3.6 million furloughed workers2 . On the other hand, the estimated expenditure
for Covid-related Wage Guarantee Funds allowed hours is almost 20 billion Euros in 2020
(Commission, 2021). This is by far the main Covid induced increase of public budget
expenditure in Italy. This calls for an analysis of the socio-economic consequences of the
vaccination roll-out strategy in Italy to speed up the recovery and to limit unemployment.
    Vaccination strategic distribution plans generally follow the WHO guidelines (WHO,
2004) and are also consistent with the scientific literature (Medlock and Galvani, 2009, Sah
et al., 2018). Regarding Europe, recently entered in force several criteria for prioritizing
population subgroups according to indicators like age, work, and health vulnerability. The
Italian strategic plan, released in December 2020 (della Sanità, 2020), provides a detailed
definition of priorities involving the first administration phases covering the first nine months
of 2021 3 and about 50% of the Italian population. Regarding the last phase, specific
criteria have not been provided yet. On the same page, we found other EU countries.
For instance, Germany4 identified six categories of prioritization: the first five categories
have different urgency according to age and health risk and cover about 30 million people,
whereas the sixth category includes the remaining population, covering about 45 million
people. Austria5 and Switzerland6 adopted similar rules, with a developing plan going
up to the second quarter of 2021. In France, two final phases, namely 4 and 5, involve
the younger population (over 18-year-old) without comorbidities, but details on allocation
criteria have not been disclosed yet7 . On the same page is the UK plan8 , which identifies a
phase aimed at achieving coverage for the entire population, and will start after vaccinating
priority groups targeting those who are at greater risk of exposure and those who provide
essential public services. Ireland introduces some specifications regarding the population
   1
     As from 2020 employment statistics issued by ISTAT (Italian National Institute of Statistics) in February
2021. See https://www.istat.it/it/files//2021/02/Employment-and-unemployment_202012.pdf
   2
     As from INPS data updated on October 10, 2020. For further information see https://www.inps.it/
nuovoportaleinps/default.aspx?itemdir=54304
   3
     The vaccination plan has been updated following the limitation imposed to AstraZeneca vaccine and its
gradual extension to people aged more than 55 years (della Sanità, 2021). See also https://www.trovanorme.
salute.gov.it/norme/renderNormsanPdf?anno=2021&codLeg=79076&parte=1%20&serie=null.
   4
     https://www.bundesgesundheitsministerium.de
   5
     https://www.sozialministerium.at
   6
     https://www.bag.admin.ch/
   7
     https://solidarites-sante.gouv.fr/
   8
     https://assets.publishing.service.gov.uk/

                                                      2
at lower risk9 , assuming that priority is given to the 18-34 age group because it includes
people who have more social contacts. Among the priority groups, Ireland also identifies
workers employed in essential sectors at high risk of exposure, going beyond the criterion
of essentiality and looking at the riskiness in terms of exposure and contagion spread.
The Spanish plan10 identifies some categories of the population and provides criteria for
assessing their higher or lower priority. Among the categories of medium-high priority are
still workers in essential sectors (to ensure the normal functioning of society) and people
who are vulnerable because of their socio-economic conditions (e.g., those with precarious
work, people in the lower income bracket, etc). Indeed, drivers of socio-economic nature
are found in the Irish and Spanish cases, that consider among the priority classes those who
live in crowded neighborhoods or housing (therefore at high risk of an outbreak). There is,
therefore, the need to define further criteria for the prioritization of vaccination for people
not working in essential or strategic services that are substantially equivalent and generally
represent a consistent share of the population.
     To this end, here we introduce a criterion for the vaccine distribution to the share
of non-prioritized population, meaning the healthy and active people. We start providing
additional evidence on the effectiveness of restriction to mobility for the Italian case. Results
show that, from the public health point of view, a ten-percent drop in mobility explains a 5
percent drop in excess deaths in the following month. Furthermore, we analyze the impact
of mobility reduction on the Wage Guarantee Fund (number of allowed working hours) as
a proxy for the suspension of the economic activity due to Covid-19 and a proxy for the
induced public expenses. Results show that a 10% drop in human mobility corresponds to
a 50% increase of the Wage Guarantee Fund (WGF) expressed in full-time equivalent units
during the following month. Looking at the interpretation of a full-time equivalent unit, we
can rephrase saying that a contraction in mobility explains an increase in the number of
furloughed workers in the following month. Available data refer to a time window spanning
from March to August 2020. We run a fixed-effects model on a monthly longitudinal
dataset comprising 107 Italian provinces (NUTS 3 regions). For the best performance of
the methods implemented, we also addressed potential endogeneity issues concerning our
main variable of interest, mobility range, following an instrumental approach as in Glaeser
et al. (2020).
     As a further result, we observe higher mobility associated with a larger share of essen-
tial working residents. Hence we provide evidence supporting the inclusion of workers in
essential sectors among the priority categories. The intervention is even more critical with
respect to those essential jobs which imply a high risk of exposure11 . Here the main aim of
   9
     https://www.gov.ie/en/publication/39038-provisional-vaccine-allocation-groups/
  10
     https://mscbs.gob.es
  11
     As previously mentioned, the Irish provisional allocation plan identifies people working in essential jobs
at a high risk of exposure among the priority categories, with the rationale of minimizing harm while reducing
economic disruption. A lower degree of priority is associated with workers in occupations that are essential to
the functioning of society (e.g., goods-producing industries) but where preventive measures can be adopted
without much difficulty. Also in Spain essential workers’ priority levels are evaluated by taking into account
economic criteria and by assessing the risk of exposure and of developing severe morbidity.

                                                      3
reducing morbidity and mortality comes together with a socio-economic rationale, as the
one of reducing unemployment risk.
    Concerning the advanced stage of the campaign addressing the share of the non-prioritized
population, we propose to drive the allocation so that return-to-work is facilitated for fur-
loughed workers, with the expected benefit of a more efficient allocation of public funds and
a reduction of potential job losses. The criterion of prioritizing the fraction of workers with
a high unemployment risk is then compared to an alternative one based on each NUTS 3
region’s resident working population. Such comparison shows that the two alternatives lead
in some cases to significantly different distribution priorities.
    This paper is organized as follows: Section 2 provides an essential literature review
about the impact of mobility restriction on socio-economic outcomes, Section 3 describes
the data collection, whereas Section 4 provides a description of the econometric model. We
present our results in Section 5 and discuss them in Section 6, where we also state our
conclusions and future research directions.

2         Literature review
The analysis of restrictive mobility policies’ actual effectiveness to prevent COVID-19 in-
fections has been addressed in a body of scientific research spanning multiple disciplines.
The consequences of such policies have been examined on an international scale, and are
nowadays covered by a significant and rapidly expanding literature. Regarding mobility re-
striction policies in the U.S., Glaeser et al. (2020) employ data on five U.S. cities to estimate
the effectiveness of lockdowns and other restrictions in limiting the spread of coronavirus
disease. The authors perform panel and cross-sectional regressions of the logarithm of
COVID-19 cases per capita on the percentage drop in mobility, employing the two-periods
lagged value of the explanatory variable in the panel setting. To address potential endo-
geneity issues concerning the main regressor of interest, mobility has been instrumented
by the employment-weighted average share of essential workers12 and by the employment-
weighted average telecommuting share across industries at the zip code level. According
to their main instrumental variable panel specification, when controlling for ZIP code and
week fixed effects, the authors find that a drop in mobility by 10 percent points leads to a
30 percent decline in COVID-19 cases per capita. In an additional specification of the cross-
sectional model, they find a positive and significant relationship between the logarithm of
per-capita deaths and mobility changes, which is robust to the inclusion of controls when
instrumenting for mobility.
    Regarding Germany, Krenz and Strulik (2020) implement an instrumental variable strat-
egy to investigate the association between COVID-19 diffusion and mobility containment
at a regional level (NUTS 3 regions). As an instrument for mobility, they employ a metric
assessing the quality of the road infrastructure in German regions, namely the average travel
time on roads towards the next major urban center, as a proxy for remoteness. The authors
    12
         Data on essential industries from Minnesota and Delaware are used to this end.

                                                        4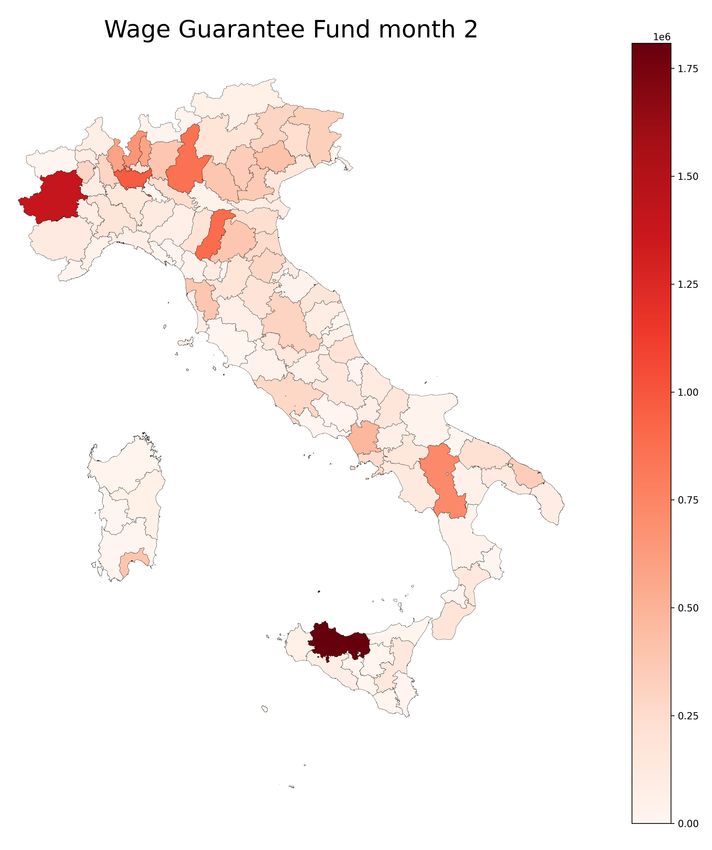
argue that the impact of ’road infrastructure’ on the spread of the disease goes through the
effect it has on mobility flows. By regressing the logarithm of COVID-19 per-capita cases
on the variation of mobility13 in an IV cross-sectional setting, this study finds a negative
and significant relationship between a change in mobility and COVID-19 disease cases. Ac-
cording to the authors’ interpretation, German regions with a higher decline in mobility on
Easter Sunday have accumulated more COVID-19 cases. The IV model’s first stage shows
a positive relationship between mobility drops and accessibility, defined as ”travel time to
the next urban center”, suggesting that mobility flows declined most in those areas that are
less remote (i.e., metropolitan areas).
     In the Italian case, Borsati et al. (2020) provide evidence on the association between
public transport usage and the number of excess deaths, as transport modes have been
addressed as a potential driver of the contagion in the ongoing debate. Using data at
the local labor markets level, the authors detect a non statistically significant correlation
between the propensity to use public transports and excess deaths as recorded during the
first six months of 2020. They find instead a positive and significant association between
the dependent variable and synthetic indices for internal and external commuting flows14
computed on 2011 national census data, and this result is still consistent when controlling
for economic and demographic variables as well as for individual and time fixed effects.
     Focusing on excess mortality, the work by Borri et al. (2020) explores the causal effect
of lockdown policies in Italy on mortality by COVID-19 (again proxied by excess deaths)
and mobility. Implementing a difference in differences model on a daily panel dataset, the
authors show that a higher intensity of the lockdown15 is associated to a significant decrease
in the number of excess deaths with respect to the whole population, and this holds true
in particular for older people (in the range 40-64 and beyond). A second finding is that
municipalities with a higher drop in the share of active people due to the lockdown16 are
those showing a stronger contraction in mobility.
     The analysis by Bonaccorsi et al. (2020) examines the socio-economic consequences of the
Italian lockdown instead. By employing a network quantity, the node efficiency, to track
changes in connectivity between municipalities 14 days after the lockdown as compared
to 14 days before the lockdown, the authors argue that wealthier municipalities in terms
of social indicators (index of the material and social well-being) and fiscal capacity are
those showing a more pronounced contraction in mobility. At the same time, however,
they observe that among those municipalities experiencing a higher drop in mobility, the
contraction is much higher for municipalities with a lower average income and higher levels
  13
      Changes in mobility have been measured comparing mobility flows on Easter Sunday 2020 to an average
Sunday in April 2019.
   14
      Internal commuting for the local labor market (LLM) i is computed as the ratio between the number of
people moving between municipalities within i and the population of i, whereas external commuting flows
accounts for the number of people moving from i to other LLMs and the number of people moving to i from
other LLMs, again normalized on LLM i population.
   15
      According to the definition given bu the authors, a municipality experiences a more intense lockdown
if the reduction in the share of the active population following the lockdown is above the median reduction
across all municipalities located in the same province.
   16
      Temporary shutdown of non essential economic activities as from DPCM March 22, 2020.

                                                    5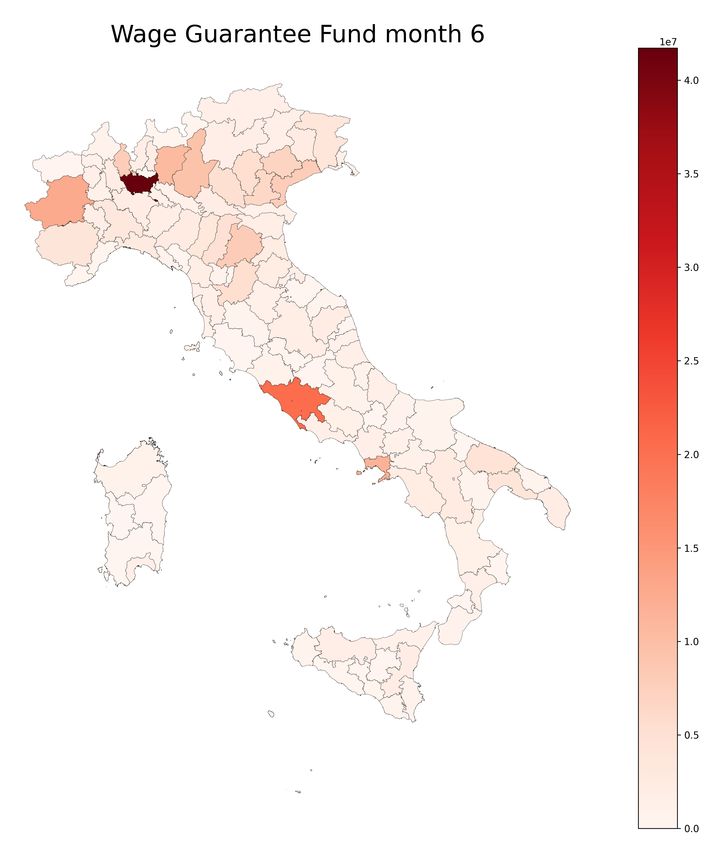
of inequality (measured as the ratio between mean and median income).
    In this expanding stream of literature, lockdown policies have been shown to explain
changes in epidemiological data often through their effects on mobility, but according Gools-
bee and Syverson (2021), human mobility flows (especially those accounting for consumers’
visits to business locations and stores) are just partially driven by the enforcement of stay-at-
home/shelter-in-place orders, as they may also arise from voluntary behavioral adjustments
due to the fear of the pandemic.
    Based on this literature review, we notice that although the ongoing scientific research is
largely dealing with the epidemiological and socio-economic impact of the lockdown, even in
terms of market labour flows (Casarico and Lattanzio, 2020), there is still a lack of evidence
about the effects of lockdown policies on measures which could be taken as proxies for the
contraction of economic activity.

3         Data collection and treatment
Data used in this paper cover the three dimensions involved in the analysis: furlough
schemes, mobility, and mortality. Furlough schemes are measured as Wage Guarantee Funds
hours that have been authorized by the Italian government. Data are released by INPS (the
Italian National Social Welfare Institution) and cover the period January-September 2020
(INPS, 2020). Besides, we considered the working population’s share and the number of
workers according to the six digits ATECO (numerical classification of economic activities,
the Italian version of European NACE). Data have been collected from ORBIS database17 .
We computed for each province (NUTS 3 region) the share of workers employed18 in those
ATECO codes not suspended by the Italian government.
    Mobility data are provided by Facebook’s ”Data for Good” program (Maas et al., 2019).
We compared Facebook data with the census commuting data collected by the Italian
statistical institute in 2011, finding that they are strongly correlated (refer to appendix A
for details). Finally, as representative of the epidemic spreading, we considered the excess
mortality data at the municipal level collected by ISTAT (2020) expressed as the difference
between the number of deaths recorded in 2020 and the average number of deaths that
occurred between 2015 and 2019 in the same period. As discussed in Buonanno et al. (2020),
the excess death toll is a reliable proxy of mortality by COVID-19. Such an assumption
is needed to overcome the potential issues related to the endogeneity of testing policies
(especially during the first wave of the epidemics), hospital capacity, and the difference
in death classification at the local level. Table 1 shows that data span different time and
spatial resolutions, ranging from monthly data of Wage Guarantee funds to 8-hourly data
of Movement Range. Regarding the spatial aggregation variability of data, we observe a
variability ranging from NUTS 3 regions of Wage Guarantee Fund to municipality level of
excess mortality.
    17
         https://www.bvdinfo.com/en-gb/our-products/data/national/aida
    18
         We used firm-level employment data as from 2019 fiscal year reporting.

                                                        6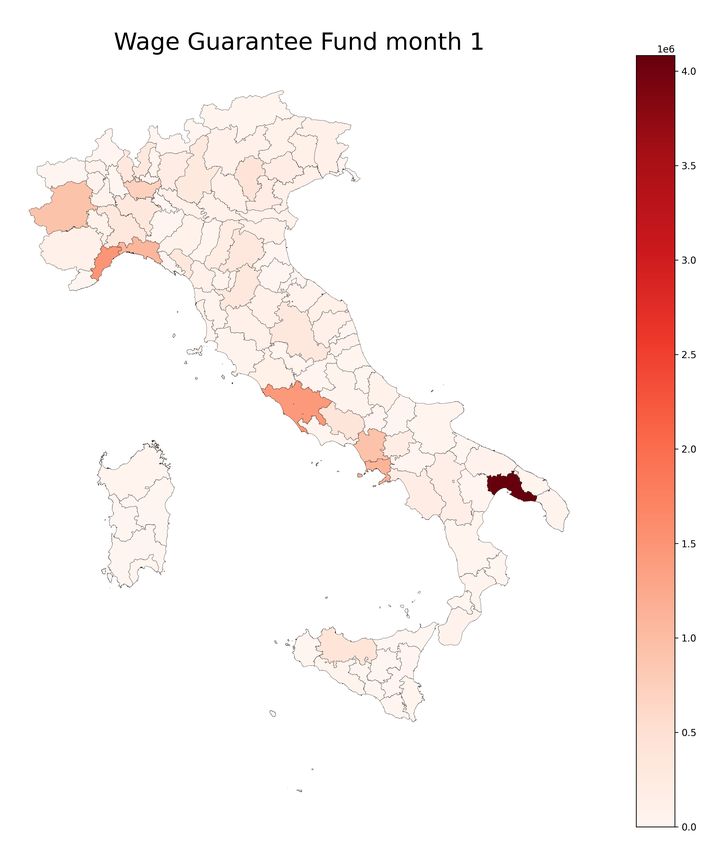
Table 1: General view of the data collected

      Data                                            Temporal scale   Spatial aggregation
      Wage Guarantee Fund hrs.                               month          NUTS3 region
      Excess mortality                                          Day           Municipality
      Mobility range                                            Day         NUTS3 region
      Movement between administrative regions               8 hours         NUTS3 region
      Workers by ATECO sector                                  Year         NUTS3 region
      Share of working population                              Year         NUTS3 region

     Facebook’s Data for Good program makes available different sets of data (Maas et al.,
2019), covering both mobility flows between and within administrative regions. To better
represent the mobility contraction inside administrative regions, we used the mobility range,
an indicator that expresses the average contraction of people mobility inside an administra-
tive region. The mobility between NUTS 3 regions has been used to compute the network
centrality (or remoteness) index of Italian provinces.
     As already mentioned, we employed a measure for the number of working hours allowed
to be covered with the Wage Guarantee Fund to proxy the impact of national policies
and imposed shutdowns on private sector economic activities. Right after the pandemic
outbreak in Italy, the Italian government has extended by decree19 the use of already existing
wage guarantee schemes against the pandemic crisis to strengthen employment protection.
In a joint work from INPS and Bank of Italy (INPS and d’Italia, 2020), it is reported
that in March and April 2020, around 50% of employers in the private sector have been
allowed to use wage compensation schemes according to the new rules in force. This kind
of intervention turns into lower labor costs for the firm but translates into a loss for the
employee: estimates by INPS-Bank of Italy (INPS and d’Italia, 2020) show a mean monthly-
gross income loss of around 27%. Moreover, since the government grants wage subsidies,
this leads to an increase in public expenditures.
     Another labor market intervention in March, the firing freeze, which is a suspension of
firings for the whole period we consider in our analysis, also contributed to the growing
requests for wage integration schemes. Starting from around the 12th week of 2020 (which
coincides more or less with the introduction of the firing freeze and the extension of wage
integration schemes), firings sharply dropped as compared to their average level in 2017-
2019 (Casarico and Lattanzio, 2020). Since week nine, a sharp decrease has been detected
in the number of hirings as well.
     National public policies have had a remarkable impact on labor market flows. According
to recent estimates (Viviano, 2020), if measures like the extension of wage supplementation
schemes, the firings freeze, and financial supports for firms had not been issued, there would
have been 600 thousand more firings in 2020 because of the pandemic crisis.
     Figure 1 shows how intense the Wage Guarantee Fund’s use has been over the last year.
 19
      Decree Law n. 18/2020 issued on March 17.

                                                  7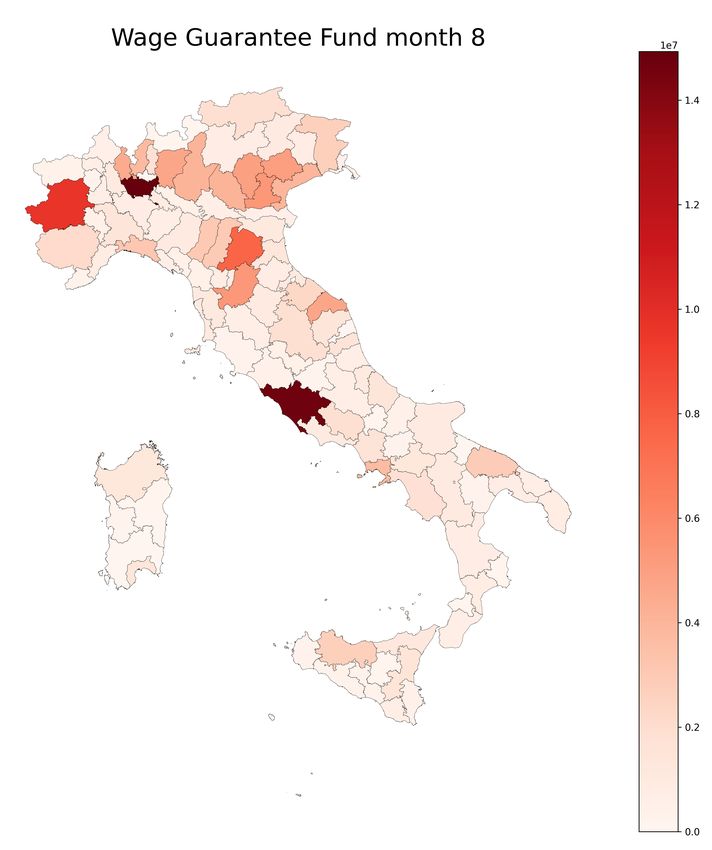
Table 2: Descriptive Statistics

                                       Mean         Std. Dev.    Min.       Max.    Obs.
               W.G.F. FTE           14676.54          30937.9        0   355018.5    856
               Excess deaths          48.884          264.510   -478.2     5181.4   1070
               Mobility Range         -0.185            0.199   -0.688      0.155   1177
               Betweenness             0.030            0.065        0      0.581    855
               Share Essentials       60.459           13.131   23.746       79.2   1284

The figure shows the monthly average Wage Guarantee Fund (in terms of accumulated
hours), the weekly average number of excess deaths, and the weekly average drop in mobility
evolution over a time window spanning from January to December 2020 (according to the
availability of the data). Each time series has been normalized to the maximum of the
period for scale uniformity and figure readability. The shaded area highlights the period
when the first national lockdown was in force. As one can see, around the end of February
mobility drops significantly (w.r.t. the baseline) while almost simultaneously the number of
excess deaths shows a sharp increase reaching its peak around the last ten days of March. At
the end of February, the first containment measures had been issued20 but just on a local
scale, addressing those areas where new COVID-19 cases had been recorded. However,
an initial contraction of mobility flows and a growth in deaths can be detected. We also
observe a peak in the average number of allowed working hours to be covered with the
Wage Guarantee Fund at the end of April, about one month after the introduction of the
national lockdown21 on March 12. This delay is the lag time between the working activity’s
temporary suspension and when the employer is allowed to use the wage guarantee schemes
(INPS and d’Italia, 2020).
    While excess deaths have been computed by comparing the number of deaths in 2020
with average pre-pandemic death levels in the same time window, the amount of the Wage
Guarantee Fund has not. However, the intensity in the use of the Fund in the early months
of 2020 before the contagion outbreak (January and February) can be taken as a reference
point. The graph shows how pre-Covid-19 levels of the number of WGF hours represent
just a tiny fraction of the post-crisis levels.
    Maps in figure 6, Appendix C, instead, plot the monthly distribution of the Wage
Guarantee Fund allowed hours across Italian NUTS 3 regions: darker shades point out
those areas where furlough schemes (WGF hours) have been used more intensively in each
month.
    Before composing the panel, data have been checked for consistency. They have been
averaged/rescaled whenever possible to fit the weekly variation and the spatial aggrega-
tion of a NUTS 3 administrative region. As a result, we obtained a longitudinal dataset
comprising monthly observations on a cross-section of 107 Italian NUTS 3 regions.
 20
      Prime Ministerial Decree February 23, 2020.
 21
      Prime Ministerial Decree March 11, 2020

                                                       8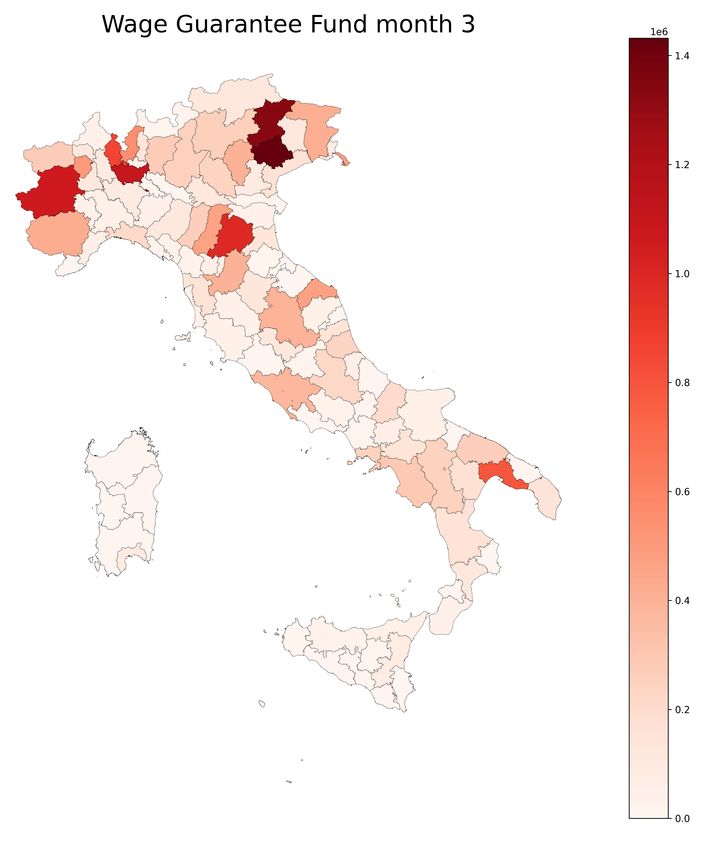
Figure 1: Wage Guarantee Fund, excess deaths and mobility range over time

Note: the plot displays the trend over time of the monthly average amount of the Wage Guarantee Fund
(average allowed working hours), the average number of excess deaths per week and in weekly average
mobility changes. All variables are expressed in normalized units: the Wage Guarantee Fund and excess
deaths have been normalized on their maximum while mobility range has been normalized on its minimum.
Two-weeks moving average are reported for excess deaths and mobility range.

4    The econometric model
To explore the relationship between the dependent variables and the main explanatory vari-
able, namely Mobility Range, we employed a linear model for longitudinal data, accounting
for Italian NUTS 3 regions’ unobserved heterogeneity. The linear model is expressed as
follows

                    ln(y)it = βM ob.Rangei(t−1) + δLockdownt + pvi + εit                         (1)
where pvi denotes the individual-specific fixed effects, controlling for NUTS 3 regions’ un-
observed time-invariant characteristics. Since pvi might be correlated with the observed
regressors, we implemented a fixed-effects model. The model also includes a dummy named
Lockdown which takes value 1 in those months when the national lockdown was in force -
March, April, and May - to control for potential time-varying effects due to the imposed
restrictions.

                                                 9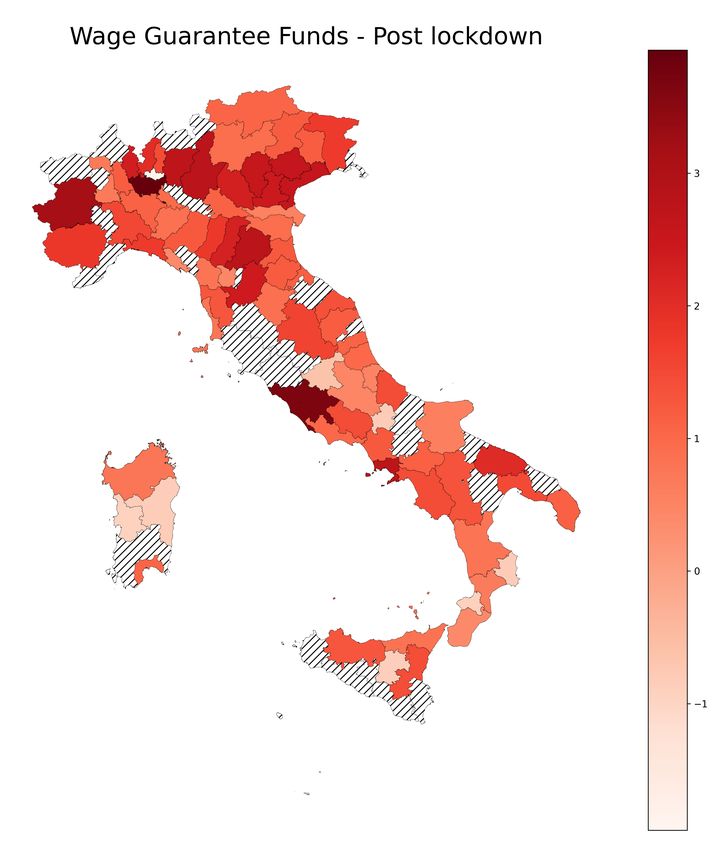
We test two versions of the model where yit of equation (1) stands for Excess Deaths or
Wage Guarantee Fund, respectively. In both cases the logarithm of the dependent variable
has been regressed on a month lagged value of the explanatory variable Mobility Range.
Usually, a delay of about a month occurs between the time in which a firm requires the
wage supplementation schemes and the time it is officially authorized and recorded (INPS
and d’Italia, 2020). Similarly, changes in the mobility induced by restriction measures are
followed with some delay by a decrease of COVID-19 deaths (Borri et al., 2020).
     We use instrumental variables (IVs) to overcome potential endogeneity issues concerning
our main explanatory variable Mobility Range.
     As already pointed out in previous scientific works, mobility is likely to be endogenous
with variables strictly related to the spread of the disease, such as the number of COVID-19
cases or excess deaths (Borri et al., 2020, Glaeser et al., 2020, Krenz and Strulik, 2020). A
potential reversed causality issue may affect the estimates since mobility flows are adjusted
when people observe an increase (or decrease) in the spread of COVID-19.
     A similar argument applies to the relationship between mobility and the amount of the
Wage Guarantee Fund. Reduced mobility can explain an increase in the Wage Guarantee
Fund since the enforcement of containment measures meant to discourage mobility and
limit social interactions could foster the use of wage guarantee schemes to reduce physical
proximity in the workplace. However, temporary suspension of working activities could
itself explain a further drop in commuting flows. This could be the most intuitive way to
interpret the relationship between mobility and furlough schemes but is not the only one, as
mobility could impact the Wage Guarantee Fund even through different channels. If fewer
people move because of containment rules or fear of contagion, we may observe a decline
in the demand for goods and services by final consumers. In turn, employers may opt for a
temporary reduction of working time and ask for wage compensation schemes to cope with
a contraction in the demand22 .
     To overcome potential endogeneity-issues, we employed and IV strategy for Mobility
Range, testing different specifications of our models.
     The choice of the first instrument is inspired 23 by Glaeser et al. (2020). Looking at
the provisions of Prime Ministerial Decrees issued between March and May24 we computed
the time-varying share of essential residents (Share Essentials) in each NUTS 3 region, that
is, the share of labor force which was allowed to move during the first national lockdown
since employed in economic sectors designated as essential by the Italian government. The
share of authorized employees has been multiplied by the 2019 employment rate of Italian
provinces 25 to proxy the share of essential workers of NUTS 3 regions.
     As a second instrumental variable (IV), we computed the time-varying centrality of
NUT3 regions in the national mobility flows. We compute the betweenness centrality
  22
     Even as a potential effect of consumer substitution patterns (Goolsbee and Syverson, 2021).
  23
     We refer to Glaeser et al. (2020) in the choice of the instrument for mobility, but we computed the
measure according to a different formula better suited for the Italian case.
  24
     Our references are Dpcm March 11, Dpcm March 22, Dpcm April 1, Dpcm April 10, Dpcm April 26
and Dpcm May 17, 2020.
  25
     Source of employment data is ISTAT (Italian National Institute of Statistics) Labour Force Survey.

                                                  10
(Newman, 2010) of Italian NUTS 3 regions in the mobility network built on Facebook
data movement between administrative regions26 . A low value of the betweenness central-
ity is a proxy of Italian NUTS 3 regions’ remoteness, in the same vein as in Krenz and
Strulik (2020).27 Mobility range measures the average reduction of mobility within an ad-
ministrative region. In contrast, the betweenness centrality looks at the whole network, in a
global perspective, providing a ranking of Italian NUTS 3 areas based on their importance
of bridging different regional mobility systems. Based on this, we assume this quantity to
be less or even not susceptible to changes in the number of fatalities or the number of Wage
Guarantee Fund allowed hours at a local scale (i.e. changes referring to the single NUTS 3
region).
Following the argument in Glaeser et al. (2020) and Krenz and Strulik (2020), we assume
that the centrality of a territorial unit in the mobility network and the share of people
employed in essential industries have an impact on excess deaths just through mobility
flows. A similar argument applies for Wage Guarantee Funds allowed hours.
The first stage and main equations for the IV model are given by
M ob.Rangei(t−1) = πIVi(t−1) + γLockdownt + pvi + ηit (2)
ln(y)it = βM ob.Rangei(t−1) + δLockdownt + pvi + εit (3)
both stages control for NUTS 3 region-specific fixed effects and include the Lockdown
dummy.
We perform a GMM estimation of the coefficients of the model. Specifically, we estimate
three specifications of the model: the first one employs only betweenness centrality as an
IV, the second one includes just Share Essentials, the third model uses both variables as
instruments. As a robustness check, in the case of Wage Guarantee Funds, we use local
rainfalls as an alternative IV for mobility. To be aligned with the instrumented variable, all
IVs have been lagged by one month.
5 Results
Our analysis estimates the impact of mobility range, which keeps track of the change in
mobility that occurred in Italy during and after the first national lockdown on the logarithm
of excess deaths (see table 3).28
26
As alternative measures of centrality we computed also the Pagerank, and the variation in nodal efficiency
as in Bonaccorsi et al. (2020). We performed several trials employing each quantity alone and combined as
IVs in the econometric model. We finally opted not to use more than one network quantity as an instrument
(e.g. when the page rank is used as an excluded instrument together with the betweenness it appears to
be redundant), and we chose the betweenness to be used alone and combined with the share of essential
residents.
27
The betweenness centrality provides different information with respect to the one conveyed by mobility
range. It describes a global property of the network connecting Italian provinces (NUTS 3 regions).
28
To cope with negative values, we first rescaled excess deaths by adding the absolute value of its minimum
(i.e., 478.2) plus one to each observation, then we took the logarithm.
11Model [A] considers a panel comprising all 107 Italian NUTS 3 regions and a time window
spanning from March 2020 to October 2020. Column (1) reports fixed-effects estimates from
model (1) while columns from (2) to (4) display the results stemming from the instrumental
variable approach. To overcome potential endogeneity issues concerning our main regressor,
in column (2), we instrument for mobility range with the betweenness centrality. The
specification in column (3) employs share essentials as the external instrument, and the
model in column (4) uses both time-varying IVs.
As previously mentioned, each specification includes the Lockdown dummy variable,
which takes value 1 in those months when the first national lockdown was in force in Italy:
March, April, and May.
All models report a positive and statistically significant impact of mobility of excess
deaths in the full-length period.
Model (1) shows that excess deaths increase by around 0.3 percent at time t if mobility
increases by one percent in the previous month.29 Point estimates from specification (1)
should be interpreted with care. Indeed, the magnitude of the effect grows as we instrument
our main regressor, as in specifications (2)-(4), suggesting a downward bias potentially due
to endogeneity issues.
Model estimates have been repeated by splitting the sample into two periods, one com-
prising months from March to May (model [B]) when the national lockdown was in force
(lockdown period), and the other including observations from June to October (model [C]).
As expected, mobility led to more deaths during the lockdown period (model [B]), when
the first wave of the pandemic reached its peak in Italy, and this effect weakened in the
following months (model [C]). All coefficients are significant except for model [C](2), the
one instrumenting for NUTS 3 regions’ centrality in the post-lockdown period.
Furthermore, results in section [B] display an increase in the coefficient once we instru-
ment the main explanatory variable. In contrast, IV estimates in section [C] tend to be
lower than in the baseline model [C](1) when statistically significant.
Model [A] in table 4 displays results from the first stage of the IV model. The share of
essential residents shows a positive and significant relationship with mobility, meaning that,
as expected, an increase in the fraction of working people employed in essential activities
implies a lower drop in mobility. Concerning the Betweenness centrality, we observe a
negative and significant coefficient instead, suggesting a higher contraction in mobility flows
for NUTS 3 regions with a higher centrality in the national network.
All in all, we find a strong and statistically significant effect of mobility on excess deaths
in Italy, with a much stronger impact during the nationwide lockdown phase.
In the second part of our analysis, we estimate the potential negative consequences of
reducing mobility flows on employment, as measured by the Wage Guarantee Fund.
As for excess mortality, the model has been estimated on the whole period between
29
About the interpretation of the coefficient: since we are dealing with semi-elasticities we say that a
unit increase in mobility implies a (β ∗ 100 )% variation in the dependent variable. ’Mobility range’ is not
expressed in percentage points, meaning that a unit change in mobility actually means a 100% change (in
order to be expressed in percentage point it should be multiplied by 100).
12March to August (model version [A]) and for two phases when the national lockdown was
in force (model [B] - March to May) and in the following months (model [C] - June to
August).
Results are reported in table 5. The full sample regression shows a negative and signifi-
cant effect of Mobility Range on furloughed workers. For every one percent drop in mobility
at time (t − 1), we observe a 3.25 percent increase in the use of Wage Guarantee Fund in
the following month, according to model (2) with the betweenness centrality as an IV.30
Our results highlight that the enforcement of national policies which have been effec-
tive in curtailing the contagion discouraged mobility flows and fostered the use of wage
compensation schemes provided by law31 to support workers.
Estimates of the effect of mobility on wage compensation schemes tend to decrease when
we instrument our main regressor by just one or both the selected IVs (column (2)-(4)).
However, results in column (4) should be taken carefully since we reject the null hypothesis
from the Sargan-Hansen test of over-identifying restrictions (Hansen J statistic=9.961).
Model [B] from table 5 confirms our expectations: the impact of movement range on
wage compensation schemes is stronger during the lockdown period when stricter restrictions
were in force. Point estimates in model [C] show a sharp drop in magnitude instead: after
a gradual easing of containment measures between June and August, we still see a negative
association between changes in mobility and the authorized Wage Guarantee Fund but
this relationship seems to be just slightly significant according to the IV specification in
column (3) (t-statistic= −1.67, p-value= 0.097) or no significant at all as from columns (2)
(t-statistic= −0.31, p-value= 0.760) and (4) (t-statistic= −1.64, p-value= 0.102).32
First stage regressions results (section [A], table 6) are in agreement with what already
displayed in table 4, that is, a higher drop in mobility is observed in more central NUTS 3
regions and in those showing a lower fraction of essential working residents.
To corroborate our results on the association between mobility and furlough schemes, we
performed a robustness check exploiting the exogenous variation in rainfall as an instrument
for mobility. The validity of this IV relies on the exogenous nature of weather shocks and
on the assumption that an induced change in mobility is the main channel through which
weather conditions (rainfall specifically) may affect the use of furlough schemes.33
Table 7 (appendix B) displays the full sample and split-sample estimates when instru-
menting for mobility by the share of rainy days recorded in a month, namely Rainfall share.
We still find a negative and statistically significant relationship between mobility and fur-
lough schemes, consolidating our previous results. Once again, we observe a more intense
impact of mobility shocks on furlough schemes during the lockdown period; in the post-
lockdown period, mobility explains a lower change in the Wage Guarantee Fund, but the
30
Again, recall that the explanatory variable Mobility Range is not expressed in percentage units and
should be multiplied by 100 to be so.
31
Decree Law No. 18/2020 of 17 March 2020
32
When focusing on the sub-periods (model [B] and [C]) and instrumenting by both the IVs (column (4))
we do not reject the null hypothesis from the Sargan-Hansen test.
33
Rainfall shocks have been widely used in the econometric literature as instruments (Bohlken and Sergenti,
2010, Miguel et al., 2004, Muscillo et al., 2021, Sandholt Jensen and Skrede Gleditsch, 2009, Sarsons, 2015).
13estimates do not lose statistical significance.
In the first stage regression, rainfall has an expected negative and statistically significant
effect on mobility.34
Maps in figure 2 provide a graphical representation of the NUTS 3 region-specific fixed
effects estimates obtained from the main equation of the instrumental variable model (equa-
tion 3) when instrumenting by centrality and share essentials (tables 3 and 5, section [A],
column (4)).
The intensity of the color filling each territorial unit on the map is proportional to the
associated individual fixed-effect coefficient: darker colors express higher coefficients. NUTS
3 regions whose coefficients are not statistically significant are in grey. The baseline in both
cases (panel ’a’ and ’b’) is the Province of Agrigento.
Concerning excess deaths, Figure 2(above) shows that the NUTS 3 regions which explain
a higher increase in the dependent variable in the whole period (once controlling by mobility
and lockdown-related time trends) are the most affected provinces located in the north of
Italy. This somehow reflects the uneven spread of the disease across Italian regions (Ascani
et al., 2020).
The map is less polarized in the case of the Wage Guarantee Fund (see Figure 2(below)).
However, we still find higher coefficients in the north-east of the country plus some darker
areas located in the north-west and central regions.
Following the same approach, estimates for the NUTS 3 region-specific fixed effects
in the lockdown and post-lockdown periods only (models [B] and [C] in tables 3 and 5,
specification (4)) are displayed in Figure 5, Appendix C. While fixed effects coefficients
seem to be heterogeneous and geographically clustered when the lockdown was in force, we
observe more homogeneous effects as the lockdown measures have been loosened.
34
More details about the rationale behind this exercise are provided in appendix B.
14Table 3: Excess deaths panel results
ln Excess Deathsit
[A] Full Sample Regression
(1) (2) (3) (4)
FE IV IV IV
Mobility rangei(t−1) 0.321∗∗∗ 0.733∗∗∗ 0.492∗∗∗ 0.491∗∗∗
(0.042) (0.201) (0.060) (0.061)
Lockdown 0.252∗∗∗ 0.374∗∗∗ 0.303∗∗∗ 0.300∗∗∗
(0.038) (0.067) (0.032) (0.032)
Constant 6.231∗∗∗
(0.007)
Observations 856 855 856 855
Number Ids 107 107 107 107
Individual FE Yes Yes Yes Yes
Overall R2 0.137
Root MSE 0.188 0.215 0.204 0.204
First Stage F-Stat. 53.64 565.13 292.32
Hansen J stat. 1.550
[B] Split sample regression (March to May)
(1) (2) (3) (4)
FE IV IV IV
Mobility rangei(t−1) 0.367∗∗∗ 1.095∗∗∗ 0.620∗∗∗ 0.594∗∗∗
(0.057) (0.355) (0.077) (0.074)
Constant 6.500∗∗∗
(0.021)
Observations 321 320 321 320
Number Ids 107 107 107 107
Individual FE Yes Yes Yes Yes
Overall R2 0.040
Root MSE 0.190 0.317 0.244 0.242
First Stage F-Stat. 23.25 769.74 379.77
Hansen J stat. 2.104
[C] Split sample regression (June to October)
(1) (2) (3) (4)
FE IV IV IV
Mobility rangei(t−1) 0.219∗∗∗ 0.309 0.197∗∗∗ 0.193∗∗∗
(0.033) (0.245) (0.037) (0.036)
Constant 6.224∗∗∗
(0.002)
Observations 535 535 535 535
Number Ids 107 107 107 107
Individual FE Yes Yes Yes Yes
Overall R2 0.053
Root MSE 0.085 0.096 0.095 0.095
First Stage F-Stat. 27.80 327.83 191.27
Hansen J stat. 0.220
Robust standard errors in parentheses
∗ ∗∗ ∗∗∗
p < 0.10, p < 0.05, p < 0.01
15Table 4: Excess deaths IV panel results
[A] Full Sample First Stage IV
(2) (3) (4)
Mobility Mobility Mobility
rangei(t−1) rangei(t−1) rangei(t−1)
Betweennessi(t−1) -1.376∗∗∗ -0.409∗∗∗
(0.188) (0.150)
Lockdown -0.286∗∗∗ -0.102∗∗∗ -0.102∗∗∗
(0.015) (0.012) (0.012)
Share essentialsi(t−1) 0.017∗∗∗ 0.017∗∗∗
(0.001) (0.001)
Observations 855 856 855
Number Ids 107 107 107
Root MSE 0.180 0.120 0.119
Individual FE Yes Yes Yes
[B] Full Sample Reduced form IV
(2) (3) (4)
ln Excess ln Excess ln Excess
Deathsit Deathsit Deathsit
Betweennessi(t−1) -1.008∗∗∗ -0.547∗∗
(0.283) (0.265)
Lockdown 0.164∗∗∗ 0.253∗∗∗ 0.252∗∗∗
(0.018) (0.025) (0.025)
Share essentialsi(t−1) 0.009∗∗∗ 0.008∗∗∗
(0.001) (0.001)
Observations 855 856 855
Number Ids 107 107 107
Root MSE 0.208 0.198 0.197
Individual FE Yes Yes Yes
Robust standard errors in parentheses
∗ ∗∗ ∗∗∗
p < 0.10, p < 0.05, p < 0.01
16Table 5: Wage Guarantee Fund panel results
ln Wage Guarantee Fund FTEit
[A] Full Sample Regression
(1) (2) (3) (4)
FE IV IV IV
Mobility rangei(t−1) -5.680∗∗∗ -3.254∗∗∗ -5.304∗∗∗ -5.218∗∗∗
(0.192) (0.748) (0.242) (0.242)
Lockdown -1.673∗∗∗ -1.051∗∗∗ -1.576∗∗∗ -1.564∗∗∗
(0.093) (0.234) (0.125) (0.126)
Constant 8.273∗∗∗
(0.019)
Observations 619 618 619 618
Number Ids 104 104 104 104
Individual FE Yes Yes Yes Yes
Overall R2 0.438
Root MSE 0.890 1.099 0.978 0.981
First Stage F-Stat. 49.29 599.79 305.92
Hansen J stat. 9.961
[B] Split sample regression (March to May)
(1) (2) (3) (4)
FE IV IV IV
Mobility rangei(t−1) -7.089∗∗∗ -4.831∗∗∗ -5.585∗∗∗ -5.573∗∗∗
(0.236) (1.079) (0.263) (0.264)
Constant 6.070∗∗∗
(0.089)
Observations 307 306 307 306
Number Ids 104 104 104 104
Individual FE Yes Yes Yes Yes
Overall R2 0.638
Root MSE 0.895 1.284 1.184 1.187
First Stage F-Stat. 23.09 727.33 358.98
Hansen J stat. 0.624
[C] Split sample regression (June to August)
(1) (2) (3) (4)
FE IV IV IV
Mobility rangei(t−1) -0.732∗∗∗ -0.192 -0.371∗ -0.360
(0.220) (0.626) (0.222) (0.219)
Constant 8.863∗∗∗
(0.026)
Observations 312 312 312 312
Number Ids 104 104 104 104
Individual FE Yes Yes Yes Yes
Overall R2 0.025
Root MSE 0.388 0.482 0.478 0.479
First Stage F-Stat. 24.65 340.96 196.74
Hansen J stat. 0.087
Robust standard errors in parentheses
∗ ∗∗ ∗∗∗
p < 0.10, p < 0.05, p < 0.01
17Table 6: Wage Guarantee Fund IV panel results
[A] Full Sample First Stage IV
(2) (3) (4)
Mobility Mobility Mobility
rangei(t−1) rangei(t−1) rangei(t−1)
Betweennessi(t−1) -1.426∗∗∗ -0.329∗∗
(0.203) (0.159)
Lockdown -0.249∗∗∗ -0.068∗∗∗ -0.069∗∗∗
(0.017) (0.013) (0.013)
Share essentialsi(t−1) 0.017∗∗∗ 0.017∗∗∗
(0.001) (0.001)
Observations 618 619 618
Number Ids 104 104 104
Root MSE 0.203 0.130 0.130
Individual FE Yes Yes Yes
[B] Full Sample Reduced form IV
(2) (3) (4)
ln WGF FTEit ln WGF FTEit ln WGF FTEit
Betweennessi(t−1) 4.641∗∗∗ -1.336
(1.395) (1.412)
Lockdown -0.239∗ -1.217∗∗∗ -1.223∗∗∗
(0.126) (0.149) (0.149)
Share essentialsi(t−1) -0.092∗∗∗ -0.093∗∗∗
(0.007) (0.007)
Observations 618 619 618
Number Ids 104 104 104
Root MSE 1.528 1.269 1.269
Individual FE Yes Yes Yes
Robust standard errors in parentheses
∗ ∗∗ ∗∗∗
p < 0.10, p < 0.05, p < 0.01
18Figure 2: NUTS 3 region-specific fixed effects estimates Notes: the map shows a graphical representation of the NUTS 3 region-specific PNfixed effects estimated through equation ln(WGF FTE)it = β0 + β1 M ob.Range 19 i(t−1) + δLockdown t + j=2 pvj dj,it + εit , when instrumenting Mobility Range by both NUTS 3 regions’ centrality and the share of essential residents (IV model, specification (4), section [A], tables 3 and 5). The color intensity of NUTS 3 regions is proportional to coefficients pvj . Each region in the plot is rescaled according to the average change in mobility occurred between March and April 2020.
Our results have two main implications for the vaccine roll-out strategy. When moving
to vaccinate the healthy share of the population, essential workers and workers not eligible
for remote working should be prioritized since they increase mobility, thus inducing higher
excess mortality. Second, based on the results of our analysis, we propose to prioritize the
active share of the population based on unemployment risk.
This strategy implies to assign more vaccines to areas identified according to the esti-
mates of the individual-specific fixed effects as from the full-sample IV model (specification
[A](4), table 5), considering the Wage Guarantee Fund as the dependent variable. Fixed
effects coefficients are graphically represented in figure 2, where the second panel shows
which territorial units experienced a higher increase in the Wage Guarantee Fund (FTE
units). Fixed effects estimates account for time-invariant NUTS 3 regions’ characteristics,
like demographic and socio-economic ones (which reasonably remain stable in the period
we consider).
The NUTS 3 regions that have been most in need for wages supplementation schemes
have been identified according to fixed effects estimates performed on the entire period,
spanning from March to August 2020 and on the lockdown time only (March to May).
We assume that stricter restrictions are likely to be enforced in the months when the last
steps of the campaign are about to start. Instead, we could refer to the estimates obtained
when focusing on the post-lockdown period (June to August) if we expect milder (or almost
absent) restrictions to be enforced.
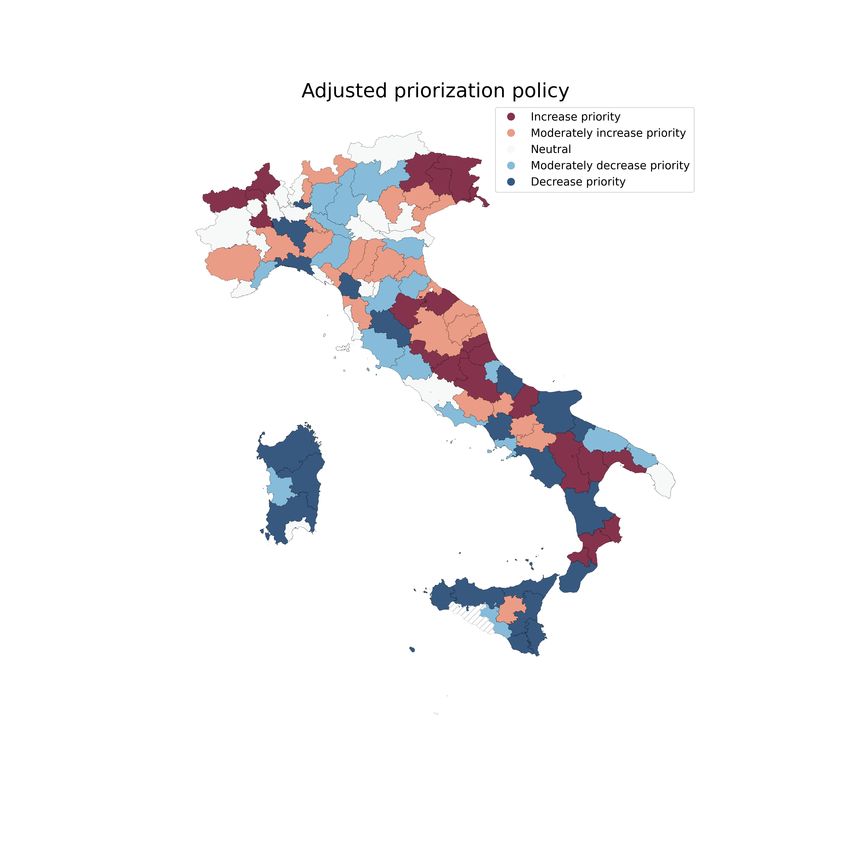
We compare our allocation criterion with a benchmark based on the share of the working
population35 .
Each NUTS 3 region is ranked according to the two criteria explained above, and we
indicate with RiW P and RiW GF the position of region i in the Working Population and Wage
Guarantee Fund rankings respectively. To highlight possible inequalities, we compare the
criteria by computing
∆W
i
GF
= RiW GF − RiW P (4)
where ∆i W GF is the difference in the ranking positions between {W GF, EM } and the
working force ranking. The distribution of ∆ is reported in figure 3. The intensity of the
color is proportional to ∆i W GF . Areas in light colors between blue and red tones are
similar in both criteria (∆ ∼ ±10). NUTS 3 regions in red and dark red shades are those
having ∆i W GF < 0; hence they should be put in higher priority. Conversely, NUTS 3
regions in blue and dark blue shades (∆ > 0), should be put in lower priority.
6 Final discussion
In this paper we analyze the impact of human mobility on excess mortality and furlough
schemes in Italy. We assume that safe return-to-work will be possible for vaccinated workers,
35
The number of people employed in region i has been obtained by multiplying the 2019 value of the
employment rate of people aged 20 to 64 as from ISTAT (Labour Force Survey), by the number of residents
aged between 20 and 64.
20Figure 3: Difference in ranking ∆W
i
GF
reactivating mobility and restoring full production capacity. This is because the negative
health consequences of human mobility will be neutralized. Therefore, we propose a vaccine
prioritization policy for the healthy and active share of the population in two stages. First,
access to vaccination should be guaranteed to essential workers and workers not eligible for
remote working. Then, return-to-work should be facilitated for the beneficiaries of wage
guarantee schemes. This will be beneficial both in terms of a reallocation and more effi-
cient use of public funds and to reduce potential job losses. It is worth stressing that our
recommendations refer to the last phase of the vaccination campaign when vulnerable cate-
gories according to the national strategic plan have already been vaccinated and immunized
against the virus (della Sanità, 2020, 2021).
The proposed strategy puts in advantage those workers employed in the administrative
areas in which wage integration measures have been used more intensively, allowing them to
21come back to a safe work36 , triggering a gradual economic recovery. This policy’s expected
benefit can be interpreted chiefly in terms of a gradual resumption of most economic activ-
ities, freeing up public funds for long-term oriented social-protection programs37 . We recall
that, according to the European Commission (Commission, 2021), the Italian government
has committed around 19 billion euros to cover wage supplementation schemes38 , accounting
for around 70% of the total amount committed to employment support measures.39
To support our proposal, we explored the link between the drop in mobility and the
amount of the Wage Guarantee Fund expressed in full-time equivalent units, also providing
evidence on the association between changes in mobility and the number of excess deaths.
Results highlight a negative and significant relationship between mobility changes and
the amount of the Wage Guarantee Fund (in full-time equivalent units) over March-August
2020. We find that a 1% contraction in mobility (w.r.t. the baseline) explains a 5% growth
in the amount of the Wage Guarantee Fund (FTE units) allowed in the following month.
Looking at the interpretation of a full-time equivalent unit, a drop in human mobility
explains an increase in the number of full-time working employees enrolled in wage guarantee
schemes in the following month. The association becomes stronger when national lockdown
was in force (March to May 2020), then gets milder and less significant after mobility
restrictions have been loosened (June to August 2021).
Under the public health point of view, results show the existence of a positive and
significant association between one month lagged mobility changes and the excess deaths
recorded: a one percent drop in mobility (w.r.t. the baseline) explains a 0.5 percent drop
in the number of excess deaths in the following month.
Our finding are in agreement with the literature, as a positive association between mo-
bility changes and deaths has already been observed by Glaeser et al. (2020), among others.
In addition, Borri et al. (2020) highlighted a significant reduction in excess deaths (es-
36
The prospected scenario does not take into account potential market labour flows (especially firings)
which could occur when public policies issued to increase employment protection, among which firing freeze,
are lifted. The Law Decree ”Sostegni”, issued on 20 March 2021, has extended the firing freeze and the
use of wage supplementation schemes for events related to the COVID-19 crisis. Employment terminations
due to justified business reasons are suspended until the end of June 2021, and then, from July to the end
of October, this measure will be enforced just as long as the employer (when eligible) is allowed to use
derogatory wage guarantee schemes.
37
About the ongoing debate see https://www.economist.com/leaders/2021/
03/06/how-to-make-a-social-safety-net-for-the-post-covid-world?giftId=
898c75eb-6951-47ce-93b1-499ff5852176.
38
As from the same document, since March 2020 the Italian government has committed about 100.3 billion
euros in accordance with three fiscal packages as from Law Decree no. 18 from 17 March, Law Decree no.
34 from 19 May, Law Decree no. 104 from 14 August, including, among the others, measures to support
firms and employment.
39
With the approval of the Law Decree ”Sostegni”, released on March 20th 2021, more funds have been
committed to cover furlough schemes for events related to Covid-19: the use of the Ordinary Wage Guarantee
Fund (Cassa integrazione guadagni ordinaria) has been extended until the end of June 2021, while eligible
employers can be allowed to derogatory wage guarantee schemes (Cassa integrazione guadagni in deroga)
until the end of December 2021. The suspension of employment agreements terminations for justified business
reasons is in force as long as the firm is allowed to benefit from furlough schemes.
22You can also read