Eight-year variations in atmospheric radiocesium in Fukushima city
←
→
Page content transcription
If your browser does not render page correctly, please read the page content below
Research article
Atmos. Chem. Phys., 22, 675–692, 2022
https://doi.org/10.5194/acp-22-675-2022
© Author(s) 2022. This work is distributed under
the Creative Commons Attribution 4.0 License.

                           Eight-year variations in atmospheric
                              radiocesium in Fukushima city
               Akira Watanabe1,2 , Mizuo Kajino3,4,5 , Kazuhiko Ninomiya6,7 , Yoshitaka Nagahashi1 , and
                                               Atsushi Shinohara6,8
          1 Faculty  of Symbiotic Systems Science, Fukushima University, Fukushima, Fukushima 960-1296, Japan
                              2 Institute for Climate Change, Fukushima, Fukushima 960-0231, Japan
                         3 Meteorological Research Institute (MRI), Japan Meteorological Agency (JMA),

                                                  Tsukuba, Ibaraki 305-0052, Japan
           4 Faculty of Life and Environmental Sciences, University of Tsukuba, Tsukuba, Ibaraki 305-8572, Japan
                   5 Institute of Radiation Emergency Medicine (IREM), Hirosaki, Aomori 036-8564, Japan
                        6 Graduate School of Science, Osaka University, Toyonaka, Osaka 560-0043, Japan
                     7 Institute for Radiation Sciences, Osaka University, Toyonaka, Osaka 560-0043, Japan
                    8 Faculty of Health Science, Osaka Aoyama University, Minoh, Osaka 562-8580, Japan

       Correspondence: Akira Watanabe (watamay1948@yahoo.co.jp), Mizuo Kajino (kajino@mri-jma.go.jp), and
                                      Kazuhiko Ninomiya (ninomiya@rirc.osaka-u.ac.jp)
                                     Received: 13 July 2021 – Discussion started: 30 July 2021
                      Revised: 12 December 2021 – Accepted: 13 December 2021 – Published: 17 January 2022

       Abstract. After the Fukushima nuclear accident, atmospheric 134 Cs and 137 Cs measurements were taken in
       Fukushima city for 8 years, from March 2011 to March 2019. The airborne surface concentrations and deposition
       of radiocesium (radio-Cs) were high in winter and low in summer; these trends are the opposite of those observed
       in a contaminated forest area. The effective half-lives of 137 Cs in the concentrations and deposition before 2015
       (0.754 and 1.30 years, respectively) were significantly shorter than those after 2015 (2.07 and 4.69 years, respec-
       tively), which was likely because the dissolved radio-Cs was discharged from the local terrestrial ecosystems
       more rapidly than the particulate radio-Cs. In fact, the dissolved fractions of precipitation were larger than the
       particulate fractions before 2015, but the particulate fractions were larger after 2016. X-ray fluorescence analysis
       suggested that biotite may have played a key role in the environmental behavior of particulate forms of radio-Cs
       after 2014. However, the causal relationship between the seasonal variations in particle size distributions and the
       possible sources of particles is not yet fully understood. The current study also proposes an evaluation method
       of the consistency of a numerical model for radio-Cs resuspension and suggests that improvements to the model
       are necessary.

1   Introduction                                                   terrestrial ecosystems (the impacts of other nuclides were
                                                                   negligibly small 100 d after the accident; Yoshimura et al.,
We conducted measurements of atmospheric 134 Cs and 137 Cs         2020), long half-life (2.06 years for 134 Cs and 30.17 years
in Fukushima city for 8 years following the Fukushima Dai-         for 137 Cs), and bioaccumulation (accumulation in muscle tis-
ichi Nuclear Power Plant (FDNPP) accident that occurred in         sues, with a biological half-life of 30–150 d; WHO, 2001).
March 2011 in order to understand the time variations in and       Radio-Cs forms aerosols in the air and is, therefore, effi-
emission sources of 134 Cs and 137 Cs and to propose effective     ciently deposited onto the ground surface by precipitation
ways to reduce atmospheric radioactivity. Among the vari-          (wet deposition) or under dry weather conditions (dry de-
ous radionuclides released to the environment, radiocesium         position). Approximately 30 % of the radio-Cs released in
(radio-Cs) is particularly important due to its abundance in

Published by Copernicus Publications on behalf of the European Geosciences Union.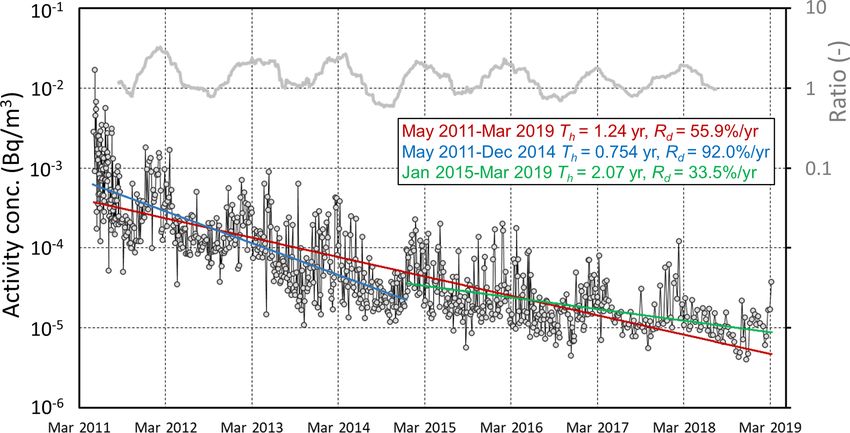
676                                    A. Watanabe et al.: Eight-year variations in atmospheric radiocesium in Fukushima city

March 2011 was deposited onto the ground surface in Japan;             so they concluded that the wind-blown soil particles car-
the aircraft-measured deposition on the ground was 2.7 PBq             ried radio-Cs in this season. In the summer and autumn,
for 137 Cs (NRA, 2012), and the most updated estimate of               the concentrations were positively correlated with tempera-
137 Cs emissions by the Japan Atomic Energy Agency is                  ture but negatively correlated with wind speed, so they con-
10 PBq (Terada et al., 2020). The activity of 134 Cs in the envi-      cluded that the resuspension mechanisms were different in
ronment was equivalent to that of 137 Cs in March 2011. Once           the winter and summer. The SEM analysis revealed that there
radio-Cs is deposited onto the ground surface, it circulates           were more abundant bioaerosols in summer than in winter.
within local terrestrial ecosystems, so the discharge from             Based on simulations, Kaijno et al. (2016) indicated that
the local environment to downstream or downwind regions                the summer peaks in concentrations in the Abukuma High-
is not expected to be significant: 0.02 % yr−1 –0.3 % yr−1 to          lands could be accounted for by bioaerosol emissions from
rivers (Iwagami et al., 2017) or approximately 1 % yr−1 to             forest ecosystems, even though the emission mechanism re-
the atmosphere1 . Thus, long-term monitoring of atmospheric            mains unknown. Igarashi et al. (2019a) further investigated
radio-Cs at even one station may allow us to understand the            the mechanisms of bioaerosol emissions in forests in summer
mechanisms of its circulation in the local terrestrial ecosys-         using fluorescent optical microscopic observation and high-
tems, to estimate the external and inhalation exposure risks to        throughput DNA sequencing techniques. They suggested that
the local residents, to propose efficient ways to reduce health        the fungal spores that accumulate radio-Cs may be signifi-
risks to the residents, and to assess the effectiveness of de-         cantly involved in resuspension in the forest in summer. Kita
contamination efforts.                                                 et al. (2020) suggested that rain induced the emission of
   To date, a great number of studies have focused on the cir-         radio-Cs associated with fungal spores in the forest in sum-
culation of radio-Cs in terrestrial ecosystems (Onda et al.,           mer. Minami et al. (2020) combined aerosol flux measure-
2020). In terms of the long-term monitoring of atmospheric             ments and a multilayer atmosphere–soil–vegetation model
radio-Cs with a focus on resuspension from the ground sur-             and estimated that the bioaerosol emission flux was on the
face to the atmosphere, several papers have been published             order of 10−2 µg m−2 s−1 , which could account for the con-
and are outlined in the following. Based on atmospheric                centrations of 137 Cs in the forests in summer (Kajino et al.,
measurements taken in the contaminated forest area of the              2016; Kinase et al., 2018; Igarashi et al., 2019a). Kinase et
Abukuma Highlands (30 km northwest of the FDNPP) from                  al. (2018) also showed that there was no enhancement in the
October 2012 to December 2014, Ochiai et al. (2016) re-                137 Cs concentration associated with forest fire events in the

ported that the airborne surface concentrations of 137 Cs were         region. The concentration of 137 Cs was not correlated with
higher in summer and lower in winter and that the time vari-           that of levoglucosan, which is often used as a marker of
ations in the fine mode (< 1.1 µm in diameter using an im-             biomass burning. Certainly, it is not indicated that the forest
pactor) and coarse mode (> 1.1 µm) behaved differently: the            fire did not reemit radio-Cs, as wildfire in fact played a key
coarse-mode fractions were larger in summer, and the fine-             role in the migration of radio-Cs in the Chernobyl case (Ager
mode fractions were larger in winter. Kinase et al. (2018)             et al., 2019; Igarashi et al., 2020). The contributions of addi-
conducted concentration measurements at four locations in              tional 137 Cs emissions from the nuclear reactor buildings of
the forest area of the Abukuma Highlands from July 2011                FDNPP to the concentrations in Japan were negligibly small
to March 2014 and found that the concentrations of 134 Cs              compared with resuspension from the ground surface (Ka-
and 137 Cs were lower in winter and early spring and higher            jino et al., 2016). On the other hand, unintentional emissions
from late spring to autumn. Their size-resolved measure-               on the premises of the FDNPP, such as debris removal oper-
ments with a six-stage cascade impactor showed that the                ations, contributed to some observed sporadic peaks (Stein-
backup filter (< 0.39 µm) concentrations were high in winter,          hauser et al., 2015; Kajino et al., 2016), although the impacts
consistent with Ochiai et al. (2016). However, using scan-             of such events might be small in terms of long-term averages
ning electron microscopy (SEM), Kinase et al. (2018) found             and trends.
that there were significant amounts of soil dust particles in             The current study is distinct from other studies, as
the backup filter; these particles were larger but bounced off         it includes long-term comprehensive measurements (time-
the upper impactor stages. Therefore, they concluded that the          resolved and size-resolved measurements of airborne surface
sizes of radioactive particles were not small but were actu-           concentrations as well as measurements of dissolved and par-
ally large (coarse-mode particles). In late spring, the con-           ticulate forms of activity in precipitation) at an urban/rural lo-
centrations were positively correlated with the wind speed,            cation in the Fukushima Basin in the vicinity of contaminated
                                                                       forests in the Abukuma Highlands. The field observation and
    1 The annual resuspension rate to the atmosphere was estimated     the simulation methods are described in Sect. 2. Section 3
as 0.047 % yr−1 by Kajino et al. (2016). However, the current study    presents the results for the concentrations (Sect. 3.1), deposi-
found that the resuspension rate was likely substantially underesti-   tion amounts (Sect. 3.2), size distribution (Sect. 3.3), chem-
mated (see Sect. 3.5 and Fig. 9). A value of approximately 1 % yr−1    ical compositions (Sect. 3.4), comparison with simulations
was obtained from improved simulations, but that paper is still in     (Sect. 3.5), and comparison with measurements taken outside
preparation.                                                           Fukushima Prefecture (Sect. 3.6). The seasonal variations

Atmos. Chem. Phys., 22, 675–692, 2022                                                     https://doi.org/10.5194/acp-22-675-2022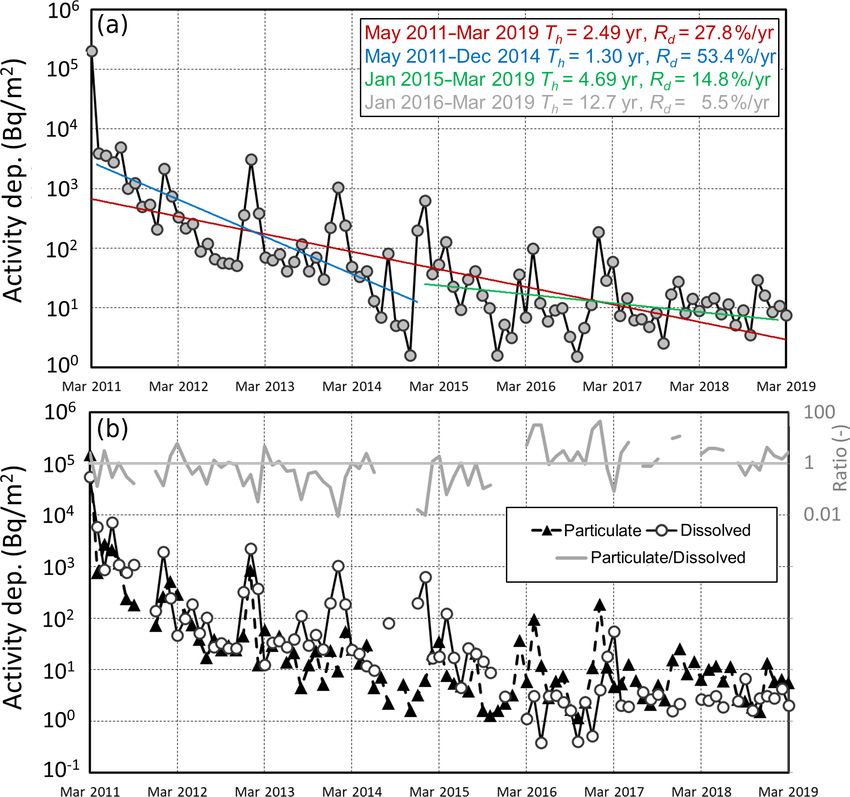
A. Watanabe et al.: Eight-year variations in atmospheric radiocesium in Fukushima city                                          677

                                                                      2.2     Airborne surface concentrations

                                                                      2.2.1    High-volume air sampler, cascade impactor, and
                                                                               radioactivity measurement

                                                                      The air samples were collected using high-volume air sam-
                                                                      plers (Model-120SL, Kimoto Electric Co., Ltd.) placed on
                                                                      the roof of the building at Fukushima University (37.68◦ N,
                                                                      140.45◦ E) at a height of 25 m above ground level. In this
                                                                      study, we carried out two types of air sampling: time-
                                                                      resolved observations and aerosol size-resolved observa-
                                                                      tions. In the former case, aerosol samples were collected on a
                                                                      quartz fiber filter (TE-QMA-100, Tisch Environmental, Inc.).
                                                                      The air suction rate of the sampler was 700 L min−1 . The typ-
                                                                      ical duration of each sample collection was 24 h, from 8 May
Figure 1. Map of Fukushima Prefecture and the surrounding pre-        to 2 September 2011. We then switched to 72 h of collection
fectures. The locations mentioned in this study and the terrestrial   until 27 December 2017; after that, 1 week of continuous col-
elevations are depicted on the map.                                   lection was performed until 28 March 2019. For the latter ob-
                                                                      servations, a cascade impactor system (HV-RW, Sibata Sci-
                                                                      entific Technology Ltd.) was placed into a high-volume air
and possible emission sources are discussed in Sect. 4.1, the         sampler. The air suction rate was 566 L min−1 . The aerosols
impacts of decontamination and natural variations on the dif-         were collected separately by diameter on six quartz filters
ferences in trends before and after approximately 2015 are            (TE-236, Kimoto Electric Co., Ltd.). The 50 % cut of parti-
discussed in Sect. 4.2, the reasons for the substantial depo-         cle size ranges in this system was 0.39–0.69, 0.69–1.3, 1.3–
sition amount in January in Fukushima city are discussed in           2.1, 2.1–4.2, 4.2–10.2, and > 10.2 µm. Fine particles with
Sect. 4.3, and major findings and future issues are summa-            a size of < 0.39 µm were captured on a backup filter (TE-
rized in Sect. 5. The observation data used in the study are          230-QZ, Kimoto Electric Co., Ltd.). The typical sample col-
provided as a Microsoft Excel file in the Supplement.                 lection time for the size-resolved observations was 3 weeks.
                                                                      In both types of observations, activated carbon fiber filters
                                                                      (KF-1700F 84 mmϕ, Toyobo Co., Ltd.) were also placed at
2     Methods
                                                                      the exit of the high-volume air samplers to collect volatile or
2.1    Sampling site
                                                                      semi-volatile compounds.
                                                                         The collected aerosol samples were sealed into polyethy-
The observation site, Fukushima University, is located in             lene bags at Fukushima University. After being shaped into
Fukushima city, in the northernmost basin (Fukushima                  definite shapes, the gamma rays from the samples were
Basin) in the Nakadori Valley, surrounded by the Ou Moun-             measured by high-purity germanium detectors (coaxial with
tains to the west and the Abukuma Highlands to the east               15 %, 35 %, and 40 % relative efficiencies, SEIKO EG&G
(Fig. 1). The distance of the observation site from the FDNPP         ORTEC, and coaxial with 40 % and 60 % relative efficien-
is approximately 60 km. The Nakadori Valley was formed                cies, CANBERRA) connected to a multichannel analyzer
by the Abukuma River, which starts in the mountains in                system (MCA7600, SEIKO EG&G) at the Radioisotope Re-
Fukushima Prefecture near the border of Tochigi Prefecture            search Center, Osaka University. The radioactivities of 134 Cs
and flows northeast through the central parts of Fukushima            and 137 Cs were identified at gamma-ray intensities of 605
city to the Pacific Ocean in Miyagi Prefecture. The major             and 662 keV, respectively. The detection efficiencies of the
radioactive plumes arrived twice in Fukushima city, on 15             respective detectors for each gamma ray were determined
and 20 March (plume no. 3 and no. 8, as identified by Naka-           from the same-shape filter samples from standard 134 Cs and
jima et al., 2017, respectively). These plumes were trans-            137 Cs solutions obtained from the Japan Radioisotope Asso-

ported over the Abukuma Highlands (where the summits are              ciation. The typical measurement time of each sample was
mostly lower than 1000 m) but were blocked by the higher              1–3 d. Under these conditions, the detection limits of 134 Cs
Ou Mountains (summits are 1000–2000 m) and, thus, trans-              and 137 Cs were approximately 5×10⁻³ Bq. The errors in the
ported along the Nakadori Valley (Nakajima et al., 2017).             measured values are derived from the systematic error of ge-
The land surface of Fukushima city was contaminated mainly            ometrical configuration and the standard sample itself in ad-
on the afternoon of 15 March by plume no. 3. The air dose             dition to statistical error. All radioactivities determined by
rate in Fukushima city started to increase at 17:00 LT (local         our measurements were corrected at mid-sampling times.
time), associated with the weak rain that started at 13:00 LT,           The radioactivities of both 134 Cs and 137 Cs were identi-
and peaked at 19:30 LT at a value of 24.0 µSv h−1 .                   fied for most filter samples. The deviation in concentration

https://doi.org/10.5194/acp-22-675-2022                                                  Atmos. Chem. Phys., 22, 675–692, 2022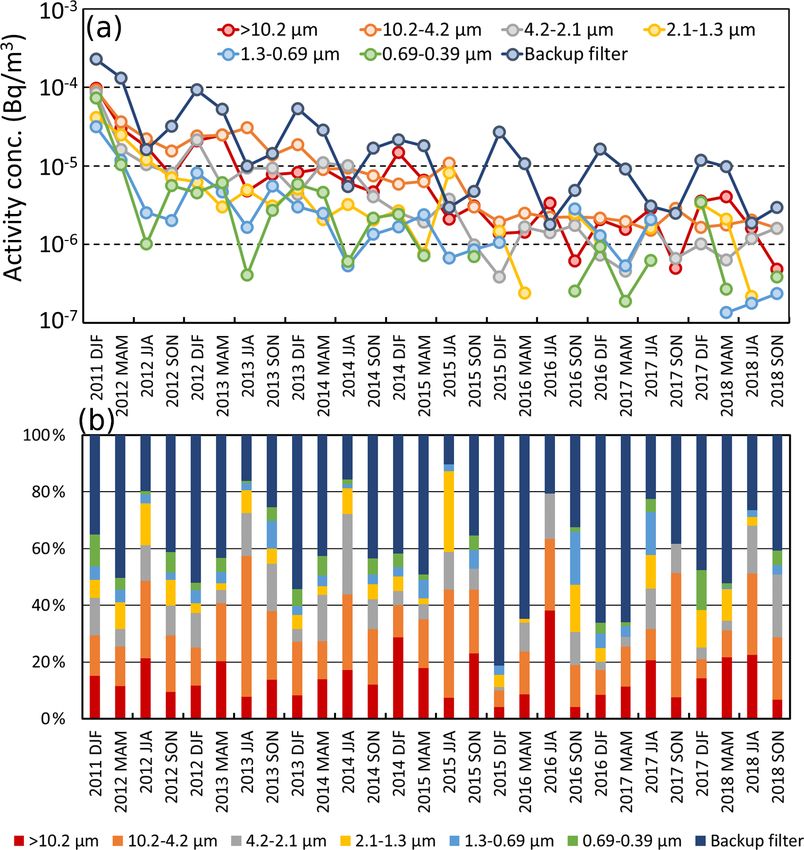
678                                 A. Watanabe et al.: Eight-year variations in atmospheric radiocesium in Fukushima city

between 134 Cs and 137 Cs became larger over time due to the      ter bath in winter. The accumulated snow in the funnel never
relatively short half-life of 134 Cs. According to the radioac-   reached the top of the funnel during the whole observation
tive decay correction performed in March 2011, the activ-         period. A filtration device was installed in the sampler using
ity ratios of 134 Cs/137 Cs were approximately 1. These ratios    membrane filters (4-880-03, Advantec) with a pore size of
are consistent with those in other reports related to the FD-     0.45 µm. The radioactivities of 134 Cs and 137 Cs in the filtered
NPP accident, so we concluded that the detected radio-Cs          water stored in the polyethylene bottle and those on the filters
originated from the abovementioned event. During the mea-         were both measured using high-purity germanium detectors
surement period, no radioactivity from 134 Cs and 137 Cs was      at Fukushima University and were defined as the dissolved
detected from the carbon filters.                                 and particulate fractions of the deposition, respectively. It
                                                                  should be noted here that this separation does not perfectly
2.2.2    Impactor–cyclone system
                                                                  differentiate between water-soluble and insoluble radio-Cs.
                                                                  The clogging of the pores of the membrane filter can occur
As the filters for the high-volume air samples were quartz        during filtration. The measured total (dissolved plus partic-
fiber filters, they could not be used for elemental analysis      ulate) deposition amounts were compared with those mea-
with X-ray fluorescence (XRF) spectrometry. For the XRF           sured using the official method of Japan (MEXT, 1976) at
analysis, we used an impactor–cyclone system (no number,          the Fukushima Prefecture Nuclear Power Center (Fig. 1),
special order, 1100 L min−1 , Tokyo Dylec Corp.) in which         which is located 6.5 km north-northwest of Fukushima Uni-
the aerosols were separated by size into < 2.5 and > 2.5 µm       versity. Our method was found to be consistent with their
using an impactor; those < 2.5 and > 0.1 µm aerosols were         official method: the correlation coefficient R was 0.81, with
sampled in glass bottles (2-4999-07, As One corp.) us-            a slope of 1.16 (the values from Fukushima University were
ing a 0.1 µm cyclone with sampling intervals of 1 month           16 % larger). Differences in locations and sampling intervals
from September 2014 to January 2018. Aerosols larger than         (daily at the Fukushima Prefecture Nuclear Power Center
2.5 µm were collected on quartz fiber filters in the system;      and monthly at Fukushima University) could also have con-
thus, only the fine-mode particles in the glass bottles were      tributed to the differences in the measured values at the two
measured by XRF. Aerosol samples in glass bottles (0.1–           sites.
2.5 µm) were defined as fine-mode PM (PMf ), and those on
quartz fiber filters (> 2.5 µm) were defined as coarse-mode       2.4   X-ray fluorescence analysis (aerosols, deposition,
PM (PMc ). The radioactivities of 134 Cs and 137 Cs in the sam-         and river sediments)
ples were also measured in the same manner.
                                                                  X-ray fluorescence (XRF) analysis was carried out using a
2.2.3    Possible artifacts of impactor measurements
                                                                  RIX1000 (Rigaku Corp.) at Fukushima University. The mea-
                                                                  surement setup recommended by the manufacturer was used
Size separation by an impactor is associated with artifacts       for the XRF. The major and trace element contents were an-
caused by bouncing effects. In fact, in cascade impactor mea-     alyzed by the fundamental parameter method and calibration
surements, Kinase et al. (2018) observed abundant coarse-         curve method, respectively (Takase and Nagahashi, 2007).
mode particles such as mineral dust and bioaerosol particles      Measurements were conducted for PMf (see Sect. 2.2.2), the
in the backup filters due to bouncing effects. In the impactor–   particulate fractions of precipitation (see Sect. 2.3), and the
cyclone system, the glass fiber filters used as an impaction      river sediments. River sediments that characterize the surface
surface were immersed in silicone oil to prevent particles        soils of the Nakadori Valley were also measured to assess
from bouncing (Okuda et al., 2015). In this study, silicone       the composition correlations with the airborne and deposi-
oil was not used for the cascade impactor but was used in the     tion samples. River sediments were collected at 15 sites up-
impactor–cyclone system. However, the long-duration mea-          stream and downstream of Fukushima city in the Abukuma
surements (such as the monthlong measurements) could be           River and its tributaries in 2010. Samples were taken from
associated with larger particles that rebounded at the im-        the gravel layer of the lower terrace at five sites, from allu-
pactor and were collected in glass bottles (Okuda et al.,         vial fan deposits at one site, and from current riverbed sedi-
2015).                                                            ments at nine sites. The dried sediment samples were sieved
                                                                  and divided into two grain size groups: particles smaller
2.3     Deposition (dry plus wet deposition, dissolved and
                                                                  than 180 µm (defined as fine sediment particles) and particles
        particulate fractions)
                                                                  180 µm–2 mm (coarse sediment particles).

The total deposition (dry plus wet deposition or fallout) sam-    2.5   Numerical simulation and validation data
ples were collected with a precipitation sampler (RS-20,
Miyamoto Riken Ind. Co., Ltd.) with a funnel diameter of          Kajino et al. (2016) used a Lagrangian model (LM) to sim-
20 cm. As a heating device was not installed on the sam-          ulate the atmospheric dispersion and deposition of 137 Cs re-
pler, any snow in the funnel was manually melted in a wa-         suspended from bare soil and forest ecosystems from Jan-

Atmos. Chem. Phys., 22, 675–692, 2022                                                https://doi.org/10.5194/acp-22-675-2022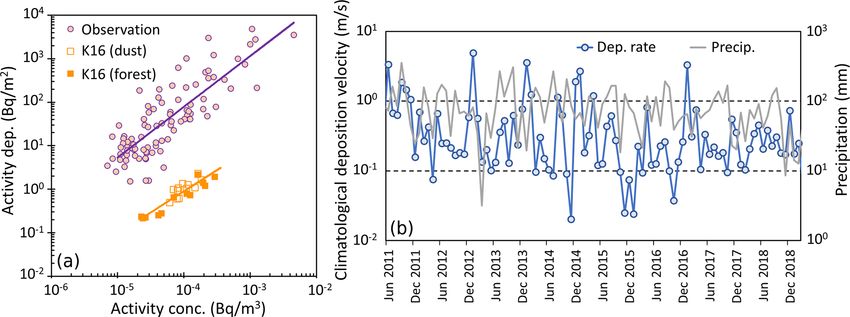
A. Watanabe et al.: Eight-year variations in atmospheric radiocesium in Fukushima city                                         679

uary to December 2013. As the resuspension fluxes and             the earlier stage is approximately 3 times faster than that of
size distributions were unknown, they adjusted the flux           the later stage (Th = 2.07 years, Rd = 33.5 % yr−1 ). This is
from bare soil (forest ecosystems) so that the simulated          shown later in Fig. 3 in Sect. 3.2 and discussed in Sect. 4.2,
airborne surface concentrations matched those measured in         but it could be related to the relative abundance of the partic-
Namie (Tsushima; Namie High School, Tsushima Cam-                 ulate and dissolved fractions of radio-Cs in the environment.
pus; 37.56◦ N, 140.77◦ E; 30 km northwest of the FDNPP)           The dissolved fractions of radio-Cs may discharge faster than
(Fig. 1) in the winter (summer) of 2013, and they adjusted        the particulate fractions from contaminated environments,
the dry and wet deposition parameters (reflecting the size        such as soils and plants. The relative abundance of the dis-
distributions and hygroscopicity) so that the simulated total     solved fractions was larger in the earlier stage than in the later
(dry plus wet) deposition over land in March 2011 matched         stage such that the decreasing tendency in the concentration
those measured by the aircraft measurements (NRA, 2012).          was faster than that in the later stage. In addition to the natu-
Thus, note that the size distribution of the simulation was       ral variability, decontamination work, which was completed
assumed to have submicron size ranges that were consistent        by March 2018 in Fukushima city and the surrounding mu-
with those of the primary emissions (the direct emissions as-     nicipalities, may also have contributed to the difference in the
sociated with the FDNPP accident in March 2011) but that          decrease rates; this possibility is also discussed in Sect. 4.2.
may not be applicable for resuspension events; the carrier           The regression analysis is also performed over different
aerosols are presumed to be soil dust or bioaerosols, which       time periods, but the results are not substantially different.
are usually in the supermicron size range. Kajino et al. (2016)   The Th and Rd before December 2013, 2014, and 2015 are
concluded that their simulations are likely reliable because      0.670, 0.753, and 0.900 years, and 103 % yr−1 , 92.0 % yr−1 ,
the simulated differences between the concentrations in the       and 77.0 % yr−1 , respectively. The Th and Rd after Jan-
contaminated area (or emission source area) (i.e., Tsushima)      uary 2014, 2015, and 2016 are 2.05, 20.7, and 2.56 years,
and those in the downwind area (Meteorological Research           and 33.8 % yr−1 , 33.5 % yr−1 , and 27.1 % yr−1 , respectively.
Institute, MRI; Tsukuba city; 36.06◦ N, 140.13◦ E; 170 km            It is also interesting that our data show different seasonal
southwest of the FDNPP) (Fig. 1) were consistent with the         variations from those measured in Tsushima by Ochiai et
observed differences at the two locations.                        al. (2016) and Kinase et al. (2018). The levels in their studies
   However, Kajino et al. (2016) used only concentration          were high in summer and low in winter; however, as depicted
measurements to validate the simulations. The current study       by the gray line in Fig. 2, the concentration in this work rose
also used concentration and deposition measurements from          starting in October, with maxima in the spring season around
Fukushima University for model validation. The previous           March and minima in the summer. The maxima in the spring
study compared only the two locations in the contaminated         are approximately 1 order of magnitude larger than the min-
forest areas and in the downwind urban/rural regions; the cur-    ima in the summer. The measurements of their studies were
rent study includes an additional location in the urban/rural     conducted in high-dose areas in the mountain forest (approx-
region near the contaminated forest of the Abukuma High-          imately 400 m a.s.l., above sea level), and the high-volume
lands (60 km northwest of the FDNPP).                             samplers were set near the ground surface. In contrast, the
                                                                  current air sampling was conducted in a relatively low-dose
                                                                  area (10 times lower than that in Tsushima) located in an
3     Results
                                                                  urban/rural region on a hill (approximately 200 m a.s.l.) at
3.1    Airborne surface concentrations
                                                                  the southern end of the Fukushima Basin. The heights of the
                                                                  samples were 25 m from the ground surface. Such geograph-
Figure 2 shows the time variations in the airborne surface        ical and altitude differences could have caused these differ-
concentrations of 137 Cs from May 2011 to March 2019.             ences.
Just after the accident, the 137 Cs concentrations were
higher than 0.01 Bq m−3 , and the maximum concentration of        3.2   Deposition amounts
0.0169 Bq m−3 was detected on 23 May 2011. The concen-
tration quickly decreased to a level of 10−4 Bq m−3 , and the     Figure 3 shows the monthly cumulative deposition of 137 Cs
minimum concentration of 4.05×10⁻⁶ Bq m−3 was obtained            from March 2011 to March 2019. The monthly deposition
on 5 December 2018.                                               amount peaked in March 2011 at 202.2 × 10³ Bq m−2 , de-
   It is remarkable that the decreasing tendencies in the ear-    creased to 1 % of the initial amount after 1 year, and de-
lier stage and the later stage were different. The regression     creased to an order of 1 Bq m−2 after 8 years. It also showed
lines of the raw data time intervals for the whole period (red;   seasonal variation and was high from winter to spring. Nev-
May 2011–March 2019), the earlier stage (blue; May 2011–          ertheless, the current level is 2–3 orders of magnitude larger
December 2014), and the later stage (lime; January 2015–          than that before the Fukushima nuclear accident.
March 2019) are shown in Fig. 2, with the half-life (Th ) in         It should be noted here that the initial-stage data (i.e.,
days and the decrease rate (Rd ) in percent per year. The de-     March and April 2011) are excluded to obtain the decreas-
creasing tendency (Th = 0.753 years, Rd = 92.0 % yr−1 ) of        ing rates to extract only the resuspension period and to ex-

https://doi.org/10.5194/acp-22-675-2022                                              Atmos. Chem. Phys., 22, 675–692, 2022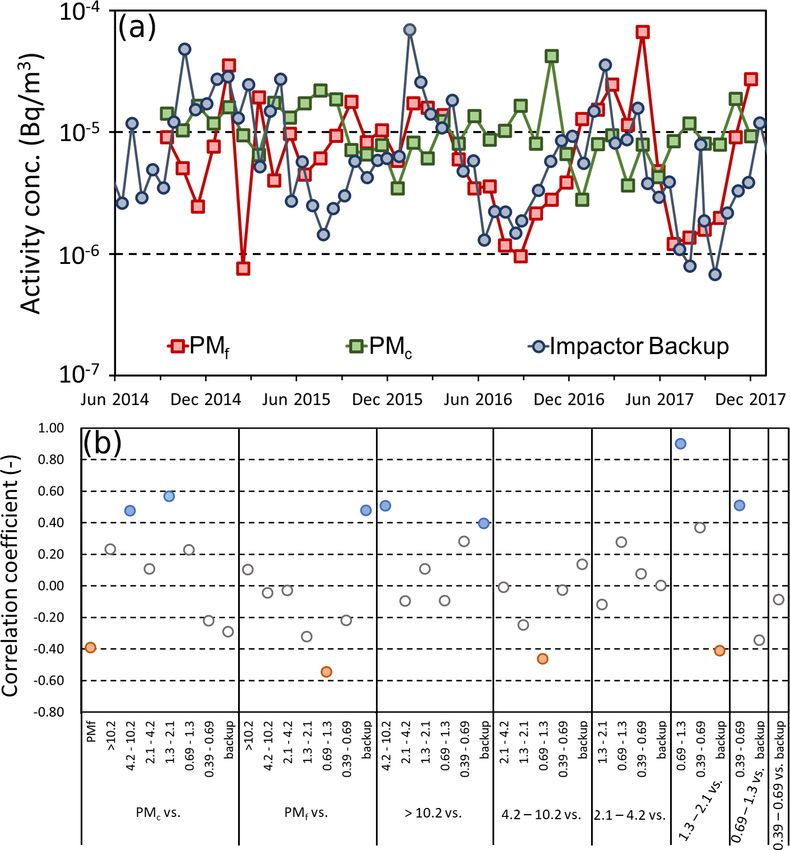
680                                   A. Watanabe et al.: Eight-year variations in atmospheric radiocesium in Fukushima city

Figure 2. Time series of airborne surface concentrations of 137 Cs on the left axis. The red, blue, and lime lines indicate the regression
lines of the whole period, before 2015, and after 2015, respectively. The half-lives (Th ) and decay rates (Rd ) are also depicted. The gray
line indicates the ratio of the running mean of 20 data points (an approximate monthly cycle) to the running mean of 160 data points (an
approximate annual cycle) on the right axis to show its seasonal variation.

clude the influences of primary emissions. The decrease rates           tation in March 2011 (although some of the water-soluble Cs
of deposition (Th = 1.30–4.69 years) were generally slower              could have been converted to a water-insoluble form through
than those of the concentrations (Th = 0.753–2.07 years). It            adsorption to soil particles accumulated on the membrane fil-
is tricky to identify the reason for this phenomenon. A perfect         ter during filtration). After April 2011, as the contributions
simulation could answer this question, but high uncertainties           of resuspension were thought to be dominant, the dissolved
in atmospheric deposition modeling and land surface model-              fractions became larger. The ratio varied, but the dissolved
ing inhibit a perfect understanding of these long-term circu-           fractions were generally higher before 2016, and the partic-
lations of radio-Cs in the environment. It is safe to presume           ulate fractions became dominant after 2016. There seemed
here that the decreasing tendencies in deposition and con-              to be a regime change in the physicochemical properties of
centrations are different because the contributions of major            radio-Cs circulating in the environment in the area around
emission sources to deposition and concentrations are dif-              2015, which could have changed the decreasing tendencies
ferent. If the dominant source of the concentration is near             of both the concentrations and deposition before and after
(far from) the observation site and that for of deposition is           2015. This result is consistent with the finding of Manaka et
far from (near) the site, the faster decrease rate in concentra-        al. (2019), who reported that the exchangeable proportions of
tion is due to the faster (slower) reduction rate in the nearby         radio-Cs rapidly decreased in forest soils from 2 to 4 years
sources of emissions than in the distant sources.                       after the accident (i.e., from 2013 to 2015).
   There is also a distinct difference in the decreasing ten-              The regression analysis is also applied over different time
dencies before and after 2015. In addition to the effect of             periods, and we found a remarkable change in 2015. The Th
decontamination work, as previously discussed in Sect. 3.1,             before December 2013, 2014, and 2015 is similar with val-
the relative abundances of the dissolved and particulate frac-          ues of 1.09, 1.30, and 1.56 years, respectively, but Th after
tions of 137 Cs could be a part of the reason. The particulate          January 2014, 2015, and 2016 is 3.98, 4.69, and 12.67 years,
fraction made up 72.6 % of the deposition in March 2011                 respectively. The ratios of half-lives (after to before) of the
(Fig. 3), which is presumed to have been largely influenced             three periods are 3.64, 3.61, and 8.12, respectively, indi-
by primary emissions. Here, it is interesting to note that most         cating that there could be a remarkable change in the ten-
primary radio-Cs emissions are thought to be composed of                dency between January 2015 and January 2016. Time series
water-soluble submicron aerosol particles (e.g., Kaneyasu et            of changes in the ratio before and after a particular date from
al., 2012, and almost all numerical simulations afterwards,             2014 to 2016 are illustrated in Fig. S1. Due to the lack of
such as Sato et al., 2020), while water-insoluble Cs-bearing            data, the half-lives after 2015 varied substantially depend-
microparticles (CsMP; Adachi et al., 2013; Igarashi et al.,             ing on the start month (exceeding 100 years in some cases).
2019b) may contribute somewhat to primary emissions (Ike-               However, it is obvious that the ratio is stable before Jan-
hara et al., 2020; Kajino et al., 2021). If the primary radio-Cs        uary 2015 at a value of around 4.0, and it starts to increase
species in aerosols were 100 % in water-soluble forms, the              from the spring to summer of 2015. We may be able to con-
particulate fraction should have made up 0 % of the precipi-

Atmos. Chem. Phys., 22, 675–692, 2022                                                       https://doi.org/10.5194/acp-22-675-2022
A. Watanabe et al.: Eight-year variations in atmospheric radiocesium in Fukushima city 681
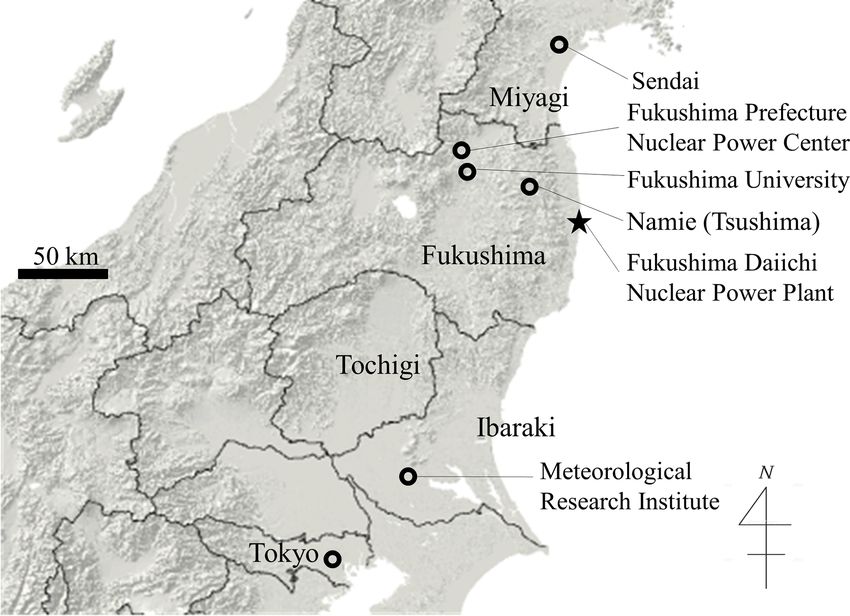
Figure 3. (a) Time series of 137 Cs activity deposition. The red,
blue, and lime lines indicate the regression lines of the whole pe-
riod, before 2015, and after 2015, respectively. The half-lives (Th )
Figure 4. (a) Time series of seasonal mean size-resolved airborne
and decay rates (Rd ) are also depicted. As Th and Rd values after
surface concentrations of 137 Cs and (b) their relative fractions.
2016 are substantially different from those after 2015, the values are
additionally depicted in gray. (b) Time series of the particulate and
dissolved forms of 137 Cs deposition on the left axis and the ratio of
particulate to dissolved 137 Cs on the right axis. ages of both DJF (December–January–February, i.e., winter)
and MAM (March–April–May, i.e., spring). The seasonal
mean total (all sizes) concentrations of cascade impactor
clude that the regime change in the physicochemical proper- measurements during the sampling period agreed well with
ties of radio-Cs occurred during the year 2015. those of the “all size” observations as presented in Fig. 2,
The seasonal variations in particulate and dissolved 137 Cs with R 2 = 0.93. The same seasonal variation discussed for
were slightly different from each other and different from the all size observations (Sect. 3.1) was also observed; the
those of the concentration. The concentration peaked in atmospheric 137 Cs concentration was relatively high in DJF
March in almost all years, and the total deposition peaked and MAM compared with that in JJA (June–July–August,
in January. The peaks of the total deposition in January co- i.e., summer) and SON (September–October–November, i.e.,
incided with those of the dissolved 137 Cs before 2016, but autumn).
the peaks of the dissolved 137 Cs became unclear afterwards. The most dominant size range in activity was the backup
The peaks of particulate 137 Cs occurred in March before filter (< 0.39 µm, or rebounded particles such as soil dust
2016, which coincided with those of the concentrations. Af- and bioaerosols; Kinase et al., 2018), and its seasonal vari-
ter 2016, there were no clear seasonal variations in particu- ation agreed well with that of the total particle concentra-
late 137 Cs. There are clear and different seasonal variations tion (high in DJF and MAM). On the other hand, the sec-
in the concentration and deposition. However, at the current ond largest contribution was made by the size range of 4.2–
stage, we have no knowledge of or numerical tools to reveal 10.2 µm, which showed the opposite seasonal variation and
the hidden mechanisms underlying these variations. was relatively high in JJA and SON. The seasonal variations
in the largest particle fraction, larger than 10.2 µm, are inter-
3.3 Size distributions esting: high in DJF and May (same as the backup filter) but
high in JJA in 2016 and 2017. The reason for the variations
Figure 4 shows the time series of the seasonal mean concen- and differences is not yet clear, but the current measurement
trations of 137 Cs obtained from the cascade impactor mea- indicates that the dominant particles and their sizes may be
surements. The sampling interval for the cascade impactor distinct depending on the season. The decrease rates of each
measurements was 3 weeks. The seasonal means included size were different before and after approximately 2015, as
a sampling period if any part of the sampling period was in- discussed in Sect. 3.1 and 3.2, but the size distribution of the
cluded in the season; for example, the raw data from the sam- concentration did not change substantially before and after
pling period from February to March contributed to the aver- approximately 2015.
https://doi.org/10.5194/acp-22-675-2022 Atmos. Chem. Phys., 22, 675–692, 2022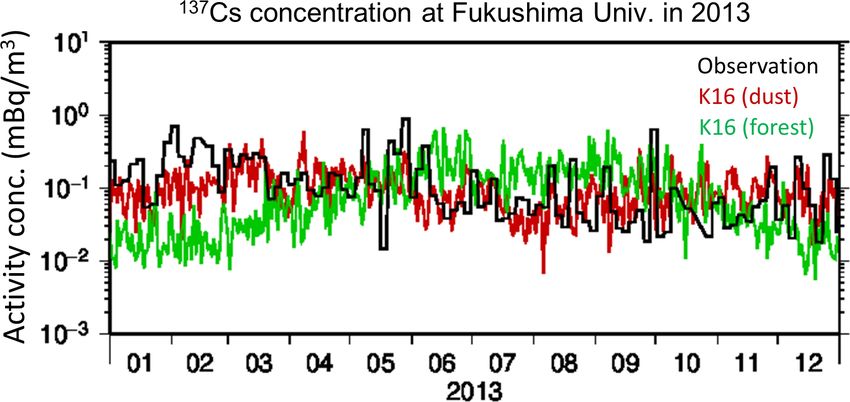
682                                   A. Watanabe et al.: Eight-year variations in atmospheric radiocesium in Fukushima city

Figure 5. (a) Time series of airborne surface concentrations of 137 Cs in PMf (0.1–2.5 µm) and PMc (> 2.5 µm) collected by the impactor–
cyclone system and those of the backup filter of the cascade impactor. (b) Correlation coefficients of temporal variations among seasonal
mean 137 Cs concentrations of different sizes measured by the impactor–cyclone system and the cascade impactor. Correlation coefficients
higher than approximately 0.4 and lower than approximately −0.4 are colored blue and orange, respectively.

   Cascade impactor sampling is associated with the bounc-             lation between PMf and the backup filter data. There were
ing effect, whereas filters for the impactor–cyclone system            also positive correlations between PMc and the 1.3–2.1 and
were immersed in silicone oil to prevent the bouncing ef-              4.2–10.2 µm data. There was a negative correlation between
fect. Thus, the cascade impactor and the impactor–cyclone              PMc and PMf , which strongly indicates that fine-mode parti-
measurement data are compared in Fig. 5. Figure 5a shows               cles are the dominant carriers of 137 Cs in winter and spring
the data with the same measurement time intervals (3 weeks             and that coarse-mode particles are the dominant carriers of
for the cascade impactor data and 1 month for the impactor–            137 Cs in summer and autumn. However, there was also a

cyclone data). The concentrations of 137 Cs in the backup fil-         contradiction in the data. There were low or negative corre-
ters were well correlated with those of PMf . No remarkable            lation coefficients between the backup filter data and the cas-
seasonality was observed in PMc , but some enhancements                cade impactor data at smaller size ranges, such as 0.39–0.69,
were observed in JJA in 2015 and SON in 2016.                          0.69–1.3, and 1.3–2.1 µm, but the backup filter data were
   Figure 5b shows the correlation coefficients among the              positively correlated with the impactor data for > 10.2 µm.
seasonal mean size-resolved data from the cascade impactor             It appears that bouncing effect might have occurred: par-
and impactor–cyclone measurements. If we assume that the               ticles larger than 10.2 µm bounced in the latter stages and
bouncing effect on the impactor–cyclone measurements was               were captured in the backup filter. However, as previously
negligible, the cascade impactor data and the impactor–                discussed, the behavior of the > 10.2 µm particle data was
cyclone data were consistent. There was a positive corre-              not consistent in time, i.e., they were generally high in DJF

Atmos. Chem. Phys., 22, 675–692, 2022                                                     https://doi.org/10.5194/acp-22-675-2022
A. Watanabe et al.: Eight-year variations in atmospheric radiocesium in Fukushima city 683
and MAM and were high in JJA in 2016 and 2017 (Fig. 4). tation. The PMf and precipitation data over the same period,
Kinase et al. (2018) and Igarashi et al. (2019a) considered from October 2014 and December 2012, were averaged. The
that the dominant carriers of resuspended 137 Cs were coarse- sediment samples were collected in 2010. The 10 species that
mode particles such as soil dust and bioaerosols. Ochiai et were common to all samples are shown in Fig. 7. The com-
al. (2016) conducted two-stage impactor sampling and mea- position differences are not very remarkable, and correlation
sured the airborne surface concentrations of 134 Cs and 137 Cs coefficients for the compositions among samples are above
above and below 1.1 µm from 2012 to 2014. They showed 0.9 s. The features of the PMf composition were distinct
that the contributions of coarse-mode particles (> 1.1 µm) from the others. PMf included SO3 (17.8 %) and Cl (2.65 %),
were dominant, with maxima in summer. The contributions whereas the others did not.
of the fine-mode particles (< 1.1 µm) were much smaller, and Weathered biotite is abundant in the soil in Fukushima,
no significant seasonal variations were found. All of their and it absorbs radio-Cs efficiently (Kogure et al., 2019). The
measurement sites were surrounded by contaminated forests compositional correlation coefficients between the weath-
in the Abukuma Highlands (Tsushima and the nearby sites), ered biotite (Takase, 2020) and the four samples were high:
so the sampling sites were different from those in our study. 0.73–0.87. However, when the two major components SiO2
Such larger particles may have contributed to the backup and Al2 O3 were excluded, the compositional correlation co-
filter data in the current measurements; however, based on efficients changed significantly. The eight (the common 10
the fact that the backup filter data were positively correlated species shown in Fig. 7 minus SiO2 and Al2 O3 ) composi-
with PMf and not with PMc , fine-mode particles (< 2.5 µm) tional correlation coefficients between the fine and coarse
should also play a key role in determining the concentrations sediment particles were 0.98, but those between the sedi-
in Fukushima city. ments and PMf were 0.01 and 0.19 for the fine and coarse
On the other hand, if we assume that the bouncing effect sediment particles, respectively. The eight compositional cor-
is also significant in the impactor–cyclone system due to the relation coefficients for the particulate fractions of precipita-
long sampling duration, as suggested by Okuda et al. (2015), tion were moderate: 0.36, 0.44, and 0.45 for fine sediment
the positive correlation between the backup filter particles particles, coarse sediment particles, and PMf , respectively.
and PMf was simply due to the bouncing effects of the larger The eight compositional correlation coefficients for weath-
particles in both systems. ered biotite were 0.76, 0.71, 0.50, and −0.14 for fine sed-
Even though the emission sources of the dominant parti- iment particles, coarse sediment particles, particulate frac-
cles collected by the size-resolved measurements could not tions of precipitation, and PMf , respectively.
be identified in this study, the possible aerosol sources that The findings from the current section are summarized as
would explain the differences in size and seasonality of the follows. The mean compositions of both fine and coarse sed-
two locations are discussed later, in Sect. 4.1. iment particles are similar to those of biotite, which absorbs
radio-Cs efficiently. A similar composition feature was ob-
3.4 Chemical characterizations of particles in the air,
served for the particulate fractions of precipitation. The com-
rainfall, and river sediments
position of PMf was slightly different from those of the other
samples, but the 137 Cs concentrations in PMf became larger
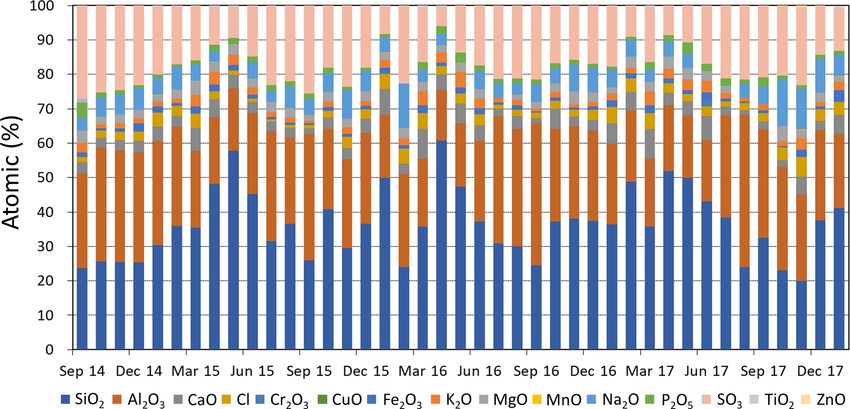
Figure 6 shows the relative abundance of the XRF-measured when the relative fractions of SiO2 , the major component of
atomic number concentrations of elements in the PMf biotite, increased. Thus, biotite may have played a key role
monthly sample from September 2014 to January 2018. in the environmental behavior of radio-Cs in Fukushima city
Among the 15 detected species, PMf was mainly composed since September 2014. However, the major carriers of radio-
of SiO2 , Al2 O3 , and SO3 . The fractions of SiO2 show clear Cs before September 2014 and those in the dissolved frac-
seasonal variations and were higher around May. The sea- tions in precipitation are still unknown.
sonal variations in Al2 O3 and SO3 are the opposite of that in
SiO2 . A positive temporal correlation was obtained between 3.5 Comparison with the simulation results and
the 137 Cs in PMf and SiO2 (R = 0.30). Negative correla- climatological deposition velocity analysis
tions were obtained for Al2 O3 and SO3 , with correlation co-
efficients of −0.36 and −0.35, respectively. Note that these In Fig. 8, the concentrations of 137 Cs in 2013 simulated by
results do not prove that the SiO2 -bearing aerosols are the Kajino et al. (2016) are compared with the time-resolved ob-
carriers of resuspended 137 Cs, but we can safely conclude servation data (Fig. 2). Kajino et al. (2016) included 137 Cs
that the origins of SiO2 and 137 Cs may be close to each resuspended from bare soil, 137 Cs resuspended from forest
other (i.e., that both come from the same source or the same ecosystems, and additional 137 Cs emissions from the FD-
area/direction). NPP. The additional 137 Cs emissions were negligibly small
Figure 7 shows comparisons of the relative abundance of in East Japan, with concentrations that were 2–3 orders of
the periodic mean XRF-measured atomic number concen- magnitude smaller than those from the two abovementioned
trations in different samples, fine sediment particles, coarse sources; therefore, the additional 137 Cs emissions are not de-
sediment particles, PMf , and particulate fractions of precipi- picted in the figure. The simulation was successful in ex-
https://doi.org/10.5194/acp-22-675-2022 Atmos. Chem. Phys., 22, 675–692, 2022684 A. Watanabe et al.: Eight-year variations in atmospheric radiocesium in Fukushima city
Figure 6. Temporal variations in the chemical composition of PMf as measured by XRF.
Figure 8. Time series of (black) measured airborne surface concen-
trations of 137 Cs and those simulated (by Kajino et al., 2016; K16)
Figure 7. Periodic mean chemical compositions of fine particles
considering different emission sources, mineral dust from bare soil
and coarse particles in sediments, PMf , and the precipitation filter (red) and aerosols emitted from forest ecosystems (lime).
(the particulate fraction of precipitation) measured by XRF.
plaining the magnitude and seasonal variations in concen- The log–log scatterplot between the monthly mean concen-
trations at Tsushima and Tsukuba, but the simulation in trations and monthly cumulative deposition of observed (pur-
Fukushima city disagreed with the observations. The simu- ple) and simulated (orange) 137 Cs is depicted in Fig. 9a. The
lation showed an enhancement of 137 Cs from forests in the coefficient of determination of the observation was 0.68, with
summer, but this was not detected in the observations. The a risk factor < 0.1 %. Equation (1) holds for the monthly
observed magnitude and seasonal trends are rather similar to mean resuspended 137 Cs at Fukushima University. As seen
those simulated for 137 Cs from soil dust. in Eq. (2), the intercept of the y axis indicates the removal
Kajino et al. (2016) used only the observed concentra- rate a. log(a) is dimensionless, but if b is close to 1, the unit
tions to estimate the regional budget of resuspended 137 Cs of a can be meters per second (m s−1 ). From Fig. 9, the value
in the air, but we used the observed deposition to evaluate of b for observation is close to 1. Therefore, the ratios of the
the model, as shown in Fig. 9. Suppose there is a simple non- monthly deposition amounts to the monthly mean concentra-
linear relationship between the deposition (D) and airborne tions are referred to as the climatological deposition velocity
surface concentration (C): (m s−1 ). Time series of the climatological deposition veloc-
ity are presented in Fig. 9b. Note that the concept of clima-
D = aC b , (1)
tological deposition velocity differs from that of dry depo-
where a represents a removal rate, and b represents nonlin- sition velocity. The dry deposition velocity is defined as the
earity, such as spatial and temporal variabilities. If one can ratio of the mass flux divided by the concentrations, but this
take a long-term average of D and C, Eq. (1) may hold. Equa- climatological deposition velocity is only the ratio of total
tion (1) is reformulated as (dry plus wet) deposition amounts divided by concentrations
without the concept of mass flux. To account for the wet de-
log(D) = b log(C) + log(a). (2) position flux, both in-cloud and below-cloud concentrations
Atmos. Chem. Phys., 22, 675–692, 2022 https://doi.org/10.5194/acp-22-675-2022A. Watanabe et al.: Eight-year variations in atmospheric radiocesium in Fukushima city 685
are needed, but such vertical measurement data are not avail- indicates that the deposition ratios at the two sites were ap-
able. proximately 10, which is almost the same level as the ini-
Figure 9a clearly shows that the removal rate (a) used in tial amounts (202×103 Bq m−2 at Fukushima University and
Kajino et al. (2016) can be underestimated by 1–2 orders 17.6×10³ Bq m−2 at the MRI), with a variation of more than
of magnitude. The deposition velocities used in Kajino et 1 order of magnitude and peaks in winter (especially Jan-
al. (2016) were estimated from the observation of 137 Cs in uary) that decreased slightly over time. Figure 9b shows that
March 2011, which was supposed to be mainly composed the January peak is typical in Fukushima city and was not
of submicron water-soluble particles. However, the current observed at the MRI. The possible reasons for the January
study and the series of previous studies regarding resus- peak in Fukushima city are discussed later, in Sect. 4.3. The
pended 137 Cs indicated that the host particles of 137 Cs could slight decreasing tendency was probably due to decontami-
be substantially larger (e.g., soil and bioaerosols). This may nation, which was ongoing in Fukushima during the period
be the reason for the overestimation of the simulated 137 Cs until 2018, as shown later in Table 1. Certainly, natural varia-
concentration from forests during summer in Fukushima city. tions could also have contributed to the decreasing tendency.
If the deposition velocities of the model increased by 1–2 or-
ders of magnitude, the transport of 137 Cs from the contami- 4 Discussion
nated forest to Fukushima city in summer may decrease such
that the simulated concentration in Fukushima city agrees Even 8 years after the FDNPP accident, the airborne sur-
with the observation. Certainly, their simulated regional bud- face concentration of 137 Cs has not fallen to the level prior
get needs to be reassessed using the realistic deposition ve- to the accident, which was at an order of magnitude of
locities indicated in the current study. 10−6 Bq m−3 . In “difficult-to-return” zones, the concentra-
The observed climatological deposition velocity varied by tions sometimes still exceed 10−2 Bq m−3 . Based on long-
more than 1 order of magnitude over time. There are two term measurements, this study tries to understand the char-
main deposition mechanisms: dry deposition and wet depo- acteristics of radio-Cs in the air and its deposition and to re-
sition. Wet deposition is associated with precipitation. The veal its origins in order to identify effective ways to reduce
variations in the climatological deposition rate seem to agree radioactivity in contaminated terrestrial ecosystems.
with the observed precipitation, but almost no correlation
was observed (R ∼ 0.10). The mean climatological deposi-
4.1 Seasonal variation and possible sources
tion velocity was 5.3 × 10⁻¹ m s−1 , and the peak values oc-
curred in January. The maximum value was 4.9 m s−1 in Jan- The current study clearly shows that the concentrations of
uary 2013, when the monthly precipitation was not very high 137 Cs are high from winter to spring, with peaks in March,
(81.2 mm). Possible reasons for these peaks in January are and low from summer to autumn in the urban/rural area of
discussed later, in Sect. 4.3. The typical order of the dry de- Fukushima city (60 km northwest of the FDNPP). It also
position velocity of supermicron (1–10 µm in diameter) par- shows that the deposition amounts of 137 Cs are high in the
ticles is approximately 10−3 –10−2 m s−1 (e.g., Petroff and winter, especially in January, and low from summer to au-
Zhang, 2010), which is substantially lower than the values tumn. This seasonal trend is the opposite of that observed in
in our climatological deposition velocity analysis. As men- a forested area in the Abukuma Highlands (Tsushima, 30 km
tioned above, the magnitudes of the instant deposition ve- northwest of the FDNPP), which was high in the summer
locity and our climatological deposition velocity are not di- (Ochiai et al., 2016; Kinase et al., 2018). From winter to
rectly comparable, but it demonstrates the efficacy of wet spring, northwesterly winds prevail over the region associ-
deposition as compared with dry deposition. Wet deposition ated with migrating disturbances, while southeasterly winds
plays an important role in the removal of resuspended 137 Cs- prevail over the region associated with the Pacific high pres-
bearing particles from the air. sure system. The three simulated monthly mean surface wind
fields for January to March and June to August are shown in
3.6 Comparison of deposition amounts at Fukushima
Kajino et al. (2016).
University and the MRI
In summer, Fukushima city is downwind of Tsushima.
The concentrations of 137 Cs at Tsushima are approximately
Figure 10 compares the deposition amounts of 137 Cs at 10 times greater than those in Fukushima city, but there is
Fukushima University (60 km northwest of the FDNPP) and no enhancement of 137 Cs in summer. The traveling distances
the MRI (170 km southwest of the FDNPP) from March 2011 of carrier aerosols depend on their aerodynamic diameters.
to March 2019. The deposition data at the MRI are available The distance between the two sites is approximately 30 km.
from Environmental Radioactivity and Radiation in Japan The traveling distances of aerosols below < 10 µm are not
(https://www.kankyo-hoshano.go.jp/data/database/, last ac- very different and are larger than 100 km because their grav-
cess: 14 June 2021). There was a significant positive corre- itational deposition velocities are negligibly small. On the
lation between the deposition amounts of 137 Cs at the two other hand, the traveling distances rapidly decrease propor-
sites, but the ratios varied substantially over time. Figure 10b tionally to a square of the diameter above 10 µm, and the trav-
https://doi.org/10.5194/acp-22-675-2022 Atmos. Chem. Phys., 22, 675–692, 2022686 A. Watanabe et al.: Eight-year variations in atmospheric radiocesium in Fukushima city
Figure 9. (a) Scatterplot of (purple circles) observed airborne surface concentrations and deposition of 137 Cs as well as those simulated (by
Kajino et al., 2016; K16) considering different emission sources, mineral dust from bare soil (orange open squares) and aerosols emitted from
forest ecosystems (orange solid squares). The purple and orange lines indicate the regression lines of the observed data and the simulated
(both dust and forest) data, respectively. (b) Time series of (blue) climatological deposition velocity on the left axis and (gray) precipitation
amounts on the right axis.
Figure 10. (a) Scatterplot of the observed surface deposition of 137 Cs at Fukushima University and the MRI from March 2011 to March 2019,
with a regression line. (b) Time series of the ratio of deposition at Fukushima University to deposition at the MRI, with a regression line.
eling distance of an aerosol with a diameter of several tens of Abukuma Highlands and the ground surface in areas up-
micrometers is on the order of 10 km (Kajino et al., 2021). wind of the sampling site in the season (northwest direc-
Igarashi et al. (2019a) reported that the major proportions of tions) is less contaminated than the site. In winter and spring,
bioaerosols in forests in summer are smaller than 5 µm in di- 137 Cs in the backup filter particles and PM is pronounced
f
ameter and can travel a fairly long distance. Pollen is much in Fukushima city. These characteristics are somewhat dif-
larger than 10 µm, but pollen emission is limited in summer ferent from those reported in previous studies. Miyamoto et
(Igarashi et al., 2019a). Consequently, there was a significant al. (2014) measured the size distributions of radio-Cs with a
enhancement in concentrations in the forests in summer but cascade impactor for two periods, from 17 March to 1 April
no enhancement in the downwind urban/rural areas, prob- and from 9 to 13 May 2011, at a site 120 km southwest of
ably because the carrier aerosols were efficiently deposited the FDNPP. They showed that the peak size ranges were
onto the ground surface by wet deposition in addition to dry 1.2–2.1 and 0.65–1.1 µm in the former and latter periods,
deposition before significant amounts of atmospheric 137 Cs respectively. Doi et al. (2013) reported that the peak diam-
reached the downwind areas. Consistent with our findings eters of the 137 Cs concentration from 4 to 11 April were 1.0
presented in Fig. 5, 137 Cs in PMc was more abundant than and 1.5 µm at Tsukuba, 170 km southwest of the FDNPP.
that in PMf and the backup filter particles in summer. To Kaneyasu et al. (2017) measured the size distributions of
obtain a quantitative understanding of the regional cycle of 137 Cs and other chemical components six times at Tsukuba
atmospheric 137 Cs in the northern part of Fukushima Prefec- from April to September 2011. The peak diameter ranges
ture, accurate simulations are required in the future. were 0.49–0.7 µm in the earlier stages (before 9 June), but the
In winter and spring, the concentrations of 137 Cs are prob- contributions of coarse-mode particles (> 1 µm) increased
ably enhanced due to local emissions from nearby sources after 9 June, and the second modes appeared in the ranges of
because the location of the sampling site is upwind of the 3.5–5.2 and 7.8–11 µm in July and September, respectively.
Atmos. Chem. Phys., 22, 675–692, 2022 https://doi.org/10.5194/acp-22-675-2022You can also read