ESREM Renewable Energy Incentive Mechanisms - DRAFT GUIDELINE REPORT
←
→
Page content transcription
If your browser does not render page correctly, please read the page content below
DRAFT GUIDELINE REPORT

Renewable Energy Incentive
Mechanisms

Prepared for:

ESREM
Prepared by:

In association with:

                         CPCS Ref: 19479ESREM project
                                          June 7, 2021

                                          www.cpcs.ca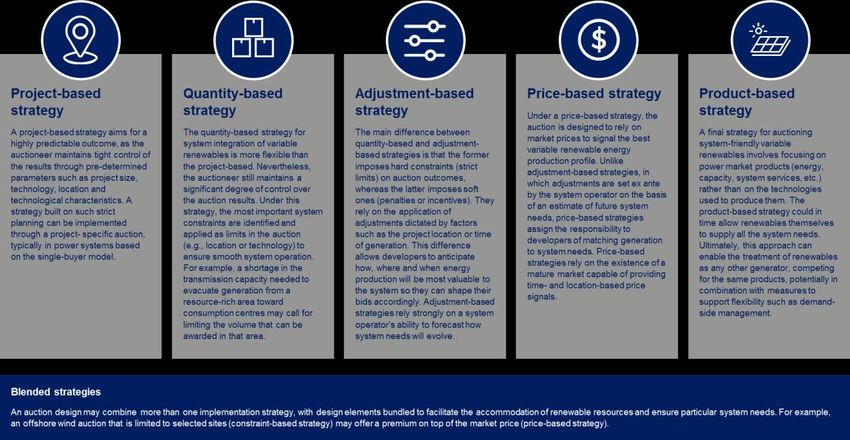
REPORT   Renewable Energy Incentive Mechanisms

                           Consultancy services to implement harmonised
                           regulatory/technical frameworks and synthesised renewable
                           and energy efficiency strategies in the EA-SA-IO region
                           This assignment will support the Common Market for Eastern and
                           Southern Africa (COMESA), East African Community (EAC),
                           Intergovernmental Authority on Development (IGAD), Indian Ocean
                           Commission (IOC), and Southern African Development Community
                           (SADC), in their collective efforts to promote the development of a
                           sustainable regional energy market in the Eastern Africa, Southern Africa,
                           and Indian Ocean (EA-SA-IO) Region.

                           Report
                           This report reviews the strengths and weaknesses of different incentive
                           mechanisms to promote increased renewable energy deployment across
                           the EA-SA-IO region. Particular attention is given to the strengths and
                           weaknesses of different renewable energy procurement methods, including
                           feed-in-tariffs and auctions.

                           Acknowledgements
                           The Team would like to extend our appreciation to the ESREM project team
                           for their invaluable guidance and contributions.

                           Opinions and Limitations
                           Unless otherwise indicated, the opinions herein are those of the authors and
                           do not necessarily reflect the views of COMESA, EAC, IGAD, IOC, or SADC.

                           CPCS makes deliberate efforts to validate data obtained from third parties,
                           but CPCS cannot warrant the accuracy of all data.

                           Confidentiality Statement
                           This report contains material which is deemed commercially sensitive and/or
                           confidential. This document may not be shared with third parties
                           without the prior written approval of ESREM.

                           Contact
                           Questions and comments on this Report can be directed to:
                           Anirudh (Rudy) Gautama
                           Project Manager
                           E: agautama@cpcs.ca

                           Cover and below image source: Sections of a 40-foot mural at CPCS
                           headquarters in Ottawa painted by Toronto artist Mike Parsons.
REPORT         Renewable Energy Incentive Mechanisms

   Table of contents
   Acronyms / Abbreviations .................................................................................................... iv
   Executive Summary................................................................................................................ v
   1    Introduction ................................................................................................................... 1-1
   2    Renewable energy in the EA-SA-IO region .................................................................. 2-1
       2.1     Cost of renewable energy ........................................................................................ 2-1
       2.2     Renewable energy penetration rates in the EA-SA-IO region .................................. 2-2
       2.3     Barriers to rapid renewable energy expansion ......................................................... 2-5
   3    Renewable Energy Incentive Mechanisms .................................................................. 3-1
       3.1     Policy objectives for new generation capacity .......................................................... 3-1
       3.2     Categorisation of renewable energy segments ........................................................ 3-2
       3.3     Incentive mechanisms for renewable energy ........................................................... 3-3
       3.4     Incentive mechanisms for different renewable energy segments ............................. 3-6
                     Utility-scale renewables .................................................................................... 3-6
                     Commercial and industrial renewables ............................................................. 3-6
                     Residential Renewables ................................................................................... 3-7
                     Implications of including storage ....................................................................... 3-8
                     Summary of incentive mechanisms .................................................................. 3-8
   4    Renewable Energy Procurement.................................................................................. 4-1
       4.1     Public Projects versus PPPs.................................................................................... 4-1
       4.2     Procurement Methods ............................................................................................. 4-3
       4.3     REFiTs and Auctions ............................................................................................... 4-6
                     Renewable Energy Feed-in Tariffs ................................................................... 4-7
                     Renewable energy auctions ........................................................................... 4-10
                     REFiTs, Auctions, and Key Procurement Objectives ...................................... 4-14
   5    Key implications and way forward ............................................................................... 5-1
       5.1     Implications ............................................................................................................. 5-1
       5.2     Way forward ............................................................................................................ 5-1
   Appendix A           References ................................................................................................. A-1

                                                                                                                                           ii
REPORT Renewable Energy Incentive Mechanisms
Table of figures
Figure 2-1: IRENA´s LCOE tracker for different renewable energy generation technologies .. 2-2
Figure 2-2: Installed Capacity by region and technology in the EA-SA-IO region (2019) ........ 2-3
Figure 2-3: Total renewable and non-renewable generation capacity in the EA-SA-IO region by
country................................................................................................................................... 2-4
Figure 2-4: Total installed renewable energy capacity in the EA-SA-IO region, 2010-2019 .... 2-5
Figure 3-1: Possible policy objectives for renewable energy expansion ................................. 3-1
Figure 3-2: Segments of renewable energy generation infrastructure .................................... 3-2
Figure 3-3: Common incentive mechanisms for promotion of renewable energy ................... 3-3
Figure 3-4: Description of incentive mechansisms for the promotion of renewable enegry..... 3-3
Figure 3-5: Selected lessons learned on incentive mechanisms from the region ................... 3-5
Figure 3-6: Key challenges and incentive mechanisms for utility scale renewables ............... 3-6
Figure 3-7: Key challenges and incentive mechanisms for C&I renewables ........................... 3-7
Figure 3-8: Key challenges and incentive mechanisms for residential renewables................. 3-8
Figure 3-9: Advantages and disadvantages of incentive mechanisms and relevance for
different renewable energy segments .................................................................................... 3-9
Figure 4-1: – Schematic comparison of public projecs and PPPs .......................................... 4-2
Figure 4-2: Solicited and unsolicited procurement.................................................................. 4-4
Figure 4-3: Modern procurement approaches ........................................................................ 4-5
Figure 4-4: Comparison of procurement methods by procurement objectives ........................ 4-5
Figure 4-5: Overview of suitable procurement methods by projects and market characteristics
.............................................................................................................................................. 4-6
Figure 4-6: Overview of selected REFiT-schemes in Africa ................................................... 4-7
Figure 4-7: Overview of selected renewable energy auctions in the EA-SA-IO region ......... 4-10
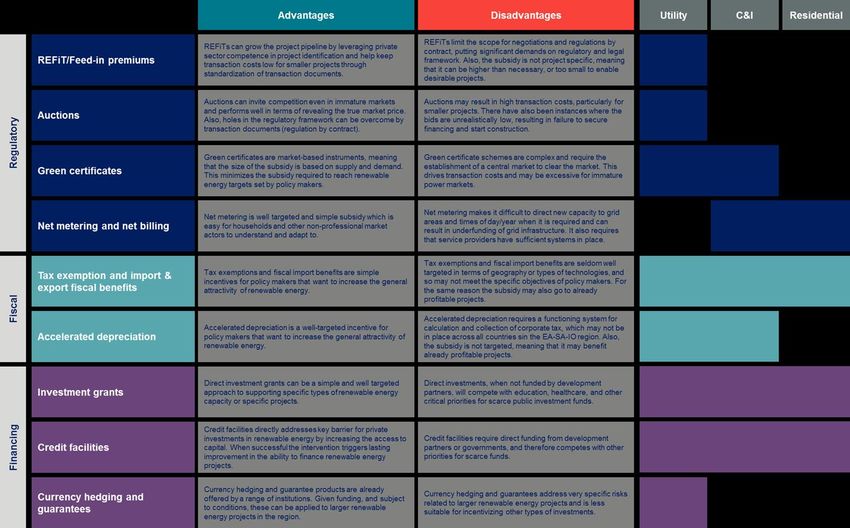
Figure 4-8: Main strategies for renewable energy auction .................................................... 4-13
Figure 4-9: Comparison of REFiTs and auctions on key procurement objectives ................. 4-14
iii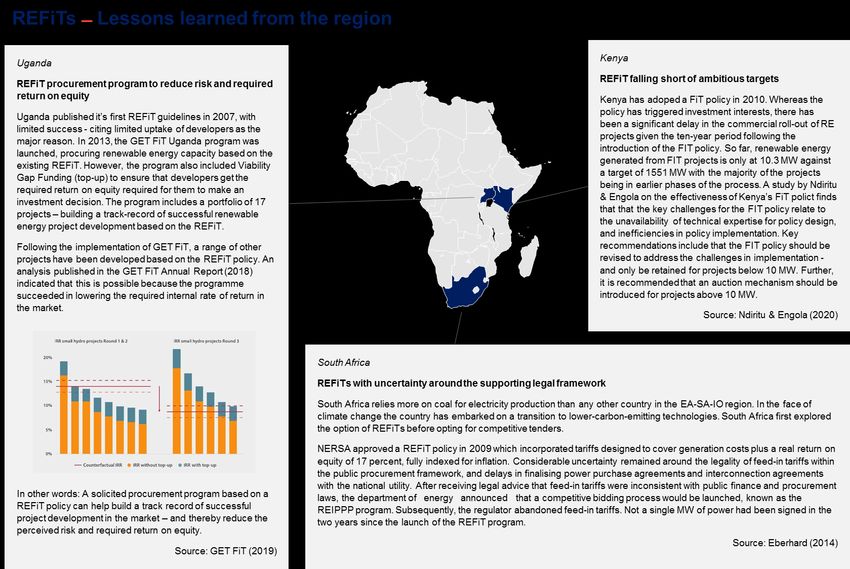
REPORT   Renewable Energy Incentive Mechanisms

   Acronyms / Abbreviations

    CAGR          Compound annual growth rate
    C&I           Commercial and industrial
    COMESA        Common Market for Eastern and Southern Africa
    CSP           Concentrated solar power
    EA            Eastern Africa
    EAC           East African Community
    ESREM         Enhancement of a Sustainable Regional Energy Market
    EUR           Euro
    FI            Financial intermediary
    GET FiT       Global Energy Transfer Feed-in Tariff
    GIZ           Deutsche Gesellschaft für Internationale Zusammenarbeit (German
                  Corporation for International Cooperation)
    kWh           Kilowatt hour
    IGAD          Intergovernmental Authority on Development
    IFC           International Finance Corporation
    IO            Indian Ocean
    IOC           Indian Ocean Commission
    IPP           Independent Power Producer
    IRENA         The International Renewable Energy Agency
    IRR           Internal Rate of Return
    KfW           Kreditanstalt Für Wiederaufbau (The German Development Bank)
    LCOE          Levelised Cost of Electricity
    MW            Megawatt
    NERSA         National Energy Regulator of South Africa
    PPA           Power Purchase Agreement
    PPP           Public-private-partnership
    PV            Photovoltaic
    REFiT         A renewable energy feed-in tariff
    REIPPP        Renewable Energy Independent Power Producer Procurement
    RLSF          Regional Liquidity Support Facility
    SA            Southern Africa
    SADC          Southern African Development Community
    SDG           Sustainable Development Goal
    USD           United States Dollar

                                                                                    iv
REPORT       Renewable Energy Incentive Mechanisms

   Executive Summary
   Following a drastic fall in the price of renewable energy generation capacity over the past
   decade, renewable energy has emerged as the least-cost alternative for generation expansion
   across the Eastern Africa, Southern Africa, and Indian Ocean (EA-SA-IO) region1. Even so, only
   23 percent of the total generation capacity in the region is renewable, and many of the countries
   are falling behind the rest of the world in terms of renewable energy generation expansion
   (IRENA, 2020a).

   Depending on their specific circumstances, countries across the EA-SA-IO can have different
   policy motivations for wishing to increase their electricity generation from renewable sources.
   The figure below outlines a number of these.

   Incentive mechanisms are important tools for policy makers aiming to increase renewable
   energy penetration, but the specific investments required to address the different policy
   objectives need to be unlocked by means of distinct market interventions.

   For example, utility-scale, commercial and industrial, and residential renewable energy
   generation capacity face different challenges in scaling up, and therefore require different
   approaches.

   Indeed, a large number of incentive mechanisms are already in active use by governments
   across the region wishing to promote renewable energy. IRENA (2015a) classifies these as
   follows:

   •   Regulatory incentive mechanisms are comprehensive programs to provide the regulatory
       and market conditions required for a renewable energy investment to take place.
   •   Fiscal incentive mechanisms aim to lower financing costs and reduce the burden of high
       upfront costs for renewable energy projects. They typically come in the form of tax incentives,
       rebates, and grants.
   •   Financing incentive mechanisms typically aim to improve access to capital and lower
       financing costs. They often come in the form of concessional loans, guarantees, and other
       measures to mitigate risk.
   The figure below explores strengths and weaknesses of different incentive mechanisms, and
   provides a high-level assessment of the types of generation capacity they are best suited to
   address. It is important to note that the choice of incentive mechanisms needs to be assessed
   in the market and regulatory context of each country

   1The scope of the project includes 28 countries: Angola, Botswana, Burundi, Comoros, Djiboui, DRC, Egypt,
   Eritrea, Eswaiti, Kenya, Lesotho, Libya, Madagascar, Malawi, Mauritius, Mozambique, Namibia, Rwanda,
   Seychelles, Somalia, South Africa, South Sudan, Sudan, Tanzania, Tunisia, Uganda, Zambia and Zimbabwe.

                                                                                                               v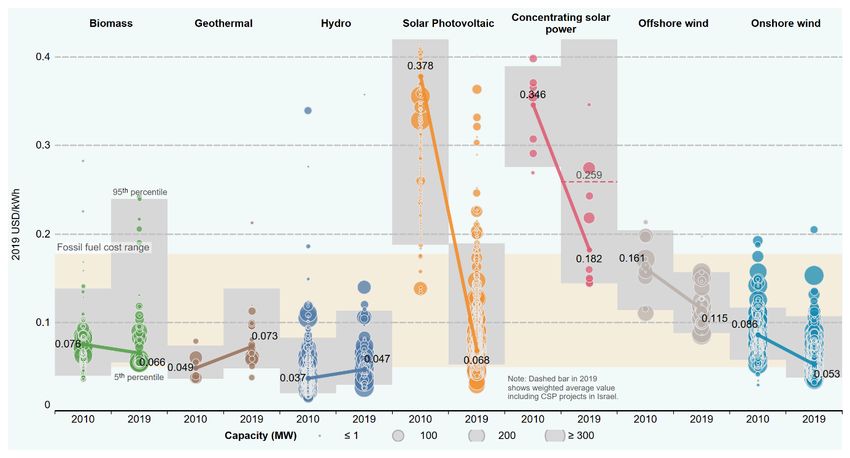
REPORT   Renewable Energy Incentive Mechanisms

                                                 vi
REPORT      ‘Renewable Energy Incentive Mechanisms

   Modern procurement methods qualify as an incentive mechanism, and are already widely
   applied across the region: Over the past decade, Renewable Energy Feed-in Tariffs (REFiTs)
   and auctions (see figure above) have emerged as key tools for governments wishing to procure
   renewable energy generation capacity through public-private partnerships:

   •   REFiT: Offers cost-based compensation to renewable energy producers on top of the market
       price for electricity, typically per kWh produced, providing price certainty and long-term
       contracts that help finance renewable energy investments.
   •   Auctions: Are competitive processes for procuring renewable energy generation capacity.
       In an auction, project developers bid against each other to supply energy through long-term
       contracts. Awards are generally made according to transparent criteria, including price.
       Auctions are often supported by other instruments, such as guarantees and fiscal import
       benefits.
   The following table provides a side-by-side comparison of REFiTs and auctions with regards to
   the key procurement objectives: i) Price discovery, ii) transparency, iii) expediency, and iv) low
   transaction cost.

                     REFiTs                                  Auctions

   Price             Aligning REFiT price to actual          Auctions carries the potential for
   Discovery         project and technology costs over       market-based price discovery even in
                     time may be challenging. There is       immature markets. In absence of
                     therefore a risk for over-subsidising   appropriate financial penalties there is
                     certain projects, while leaving other   a risk of under-bidding, leaving the
                     economically desirable projects         projects financially unfeasible.
                     financially unfeasible.
   Transparency      A consistent REFiT framework can        Well-designed       auctions     provide
                     foster renewable energy market          unrivalled     transparency     for    all
                     development – and provide a level       participants,     but   this    requires
                     of transparency and predictability to   significant efforts on the part of the
                     developers. The terms are usually       procuring entity. Awarded contracts
                     standardised and non-negotiable.        are usually standardised and non-
                                                             negotiable.
   Expediency        Once     established,   a    REFiT      A best practice bid process, including
                     framework should reduce project         pre-qualification may take significantly
                     lead-times, because contracts are       longer than a REFiT process. Even so,
                     standardised and non-negotiable.        bid-to-contract lead times are usually
                     However, tariff setting and re-         shorter for auctions than for traditional
                     evaluation requires both time and       solicited procurement (IRENA, 2019).
                     effort from authorities. Further,
                     standard offers may lead to queuing
                     of projects and longer processing
                     times.
   Low               Once established, the standardised      Auctions are comparatively expensive
   transaction       processes and documents inherent        for the procuring entity because much
   cost              in the REFiT process will normally      of the documentation needs to be
                     minimise transaction costs. Given       custom-made. There are, however,
                     that the tariffs and criteria are       clear learning curves for subsequent
                     known upfront there is minimal risk     auctions    (IRENA,      2019).   Also,
                     of developers wasting time on           developers face an upfront risk of
                     unsuccessful bids.                      preparing bids that are not accepted.

                                                                                                          vii
REPORT ‘Renewable Energy Incentive Mechanisms
In summary, REFiTs and auctions are both viable policy tools for procurement of renewable
energy capacity in the EA-SA-IO region. Depending on the context, they may however, serve
different types of needs:
1. REFiTs are particularly useful for fostering a project pipeline and growing the market by
providing a level of transparency and predictability to developers. The lower transaction
costs make REFiTs more suitable for smaller projects.
2. Auctions have been proven to drive down the levelised cost of electricity (LCOE) by
introducing competition even in immature markets. There are, however, significant
transaction costs which may be difficult to justify for smaller projects.
viiiREPORT ‘Renewable Energy Incentive Mechanisms
1 Introduction
The Common Market for Eastern and Southern Africa (COMESA), East African Community
(EAC), Intergovernmental Authority on Development (IGAD), Indian Ocean Commission (IOC),
and Southern African Development Community (SADC) are jointly leading the implementation
of a European Union-funded Project on the Enhancement of a Sustainable Regional Energy
Market in the Eastern Africa, Southern Africa and Indian Ocean (EA-SA-IO) Region (ESREM).
The overall objective of the Project is to contribute to a sustainable regional energy market in
the EA-SA-IO region2, working towards a conducive investment environment and promoting
sustainable development. As such, the project is relevant for the African Union’s Agenda 2063
and the United Nation’s 2030 Agenda and contributes primarily to the progressive achievement
of Sustainable Development Goal (SDG) 7 of ensuring access to affordable, reliable, sustainable
and modern energy for all. Furthermore, it promotes progress towards SDG 5 (achieving gender
equality and empowering all women and girls), SDG 9 (building resilient infrastructure, promoting
inclusive and sustainable industrialisation and fostering innovation), and SDG 12 (ensuring
sustainable consumption and production patterns).
Under the Project, regional harmonised legal and regulatory frameworks and synthesised
renewable energy and energy efficiency programs in the EA-SA-IO region are being drafted.
The outputs, once adopted, are expected to stimulate regional integration, energy trade and
investment in energy markets across the region.
A core component of the workstream to design and develop renewable energy and energy
efficiency incentive models for the region and provide technical support to member states in the
enactment of policy/legislation and the dissemination of knowledge on successful policy
approaches to incentivise increased renewable energy penetration.
Many countries across the EA-SA-IO region have such incentive mechanisms in place, however,
these take varying forms in implementation and are embedded in different regulatory
environments. Consequently, there is a clear potential to harmonise the approach, and provide
model guidelines based on best practices, while responding to country-specific requirements.
To this end, the Consultant is developing two outputs:
1. A report renewable energy incentive mechanisms (this document) – which will feed into;
2. Model guidelines for renewable energy procurement in the EA-SA-IO region.
In the context of this report, incentive mechanisms are understood as measures to motivate and
encourage increased investments in renewable energy. It follows that other enabling policies
such as sector regulations and public sector infrastructure investments are not discussed.
In order to provide a general discussion of available renewable energy incentive mechanisms
and their suitability for promoting different types of renewable energy, as well as a more detailed
overview of procurement mechanisms as a foundation for the subsequent policy guidelines, this
report is structured as follows:
2The scope of the project includes 28 countries: Angola, Botswana, Burundi, Comoros, Djiboui, DRC, Egypt,
Eritrea, Eswaiti, Kenya, Lesotho, Libya, Madagascar, Malawi, Mauritius, Mozambique, Namibia, Rwanda,
Seychelles, Somalia, South Africa, South Sudan, Sudan, Tanzania, Tunisia, Uganda, Zambia and Zimbabwe.
1-1REPORT ‘Renewable Energy Incentive Mechanisms
• Chapter 2 lays out the status quo with respect to renewable energy penetration in the EA-
SA-IO region.
• Chapter 3 introduces a spectrum of incentive mechanisms and assesses their suitability for
unlocking different segments of renewable energy investments in the region.
• Chapter 4 lays the groundwork for the subsequent guidelines, by reviewing different
approaches to the procurement of utility scale renewable energy capacity from the private
sector through public-private partnerships (PPPs), in light of the differing contexts of the
countries in the EA-SA-IO region.
• Chapter 5 provides an overview of implications and describes the way forward.
Comments and feedback received on this report will be further discussed with representatives
from member states during a ‘virtual’ workshop planned to be held in early July, 2021.
1-2REPORT ‘Renewable Energy Incentive Mechanisms
2 Renewable energy in the EA-SA-IO
region
Key take-aways:
1. Despite drastic reductions in the cost of renewable energy over the past decade, the
total renewable energy penetration rate in the EA-SA-IO region remains low.
2. Several barriers are currently holding back renewable energy investments in the region,
including perceived risks that make financing difficult and costly. Some, but not all of
these barriers can be addressed by renewable energy incentive mechanisms.
3. These barriers manifest themselves to varying degrees in different countries, meaning
that there is no one-size-fits-all approach to incentivising renewable energy
deployment.
This chapter outlines the current situation for renewable energy in the EA-SA-IO region, and
identifies several barriers that need to be addressed to achieve a more rapid scaling up of
deployment.
2.1 Cost of renewable energy
Between 2010 and 2020, the world saw a drastic decrease in the average global Levelised Cost
of Electricity3 (LCOE) generated from renewable sources (see Figure 2-1 below). The cost of
utility-scale solar photovoltaic (PV) came down by 82 percent, while the cost of onshore wind
power fell by 40 percent (IRENA, 2020b). This means that in 2021, renewable energy in most
cases is the least-cost alternative for new electricity generation capacity globally. Most observers
expect the general trend of falling prices to continue.
3Levelised Cost of Electricity is a measure of the average net present cost of electricity generation for a power plant
over its lifetime.
2-1REPORT ‘Renewable Energy Incentive Mechanisms
Figure 2-1: IRENA´s LCOE tracker for different renewable energy generation technologies
Additionally, over the five-year period from 2015 to 2019, the cost of utility-scale battery storage
has fallen by more than two-thirds (Bloomberg, 2019). This is important because it allows solar
and wind power – most of which is intermittent by nature and produced when the sun shines or
the wind blows – to be harnessed and dispatched when there is demand, even in locations where
reservoir hydropower and bioenergy are not available to provide flexible supply. In fact,
Bloomberg finds that the price of multi-hour lithium-ion batteries has fallen to a point such that
they are now competitive with fossil generation capacity, such as natural gas peaking plants,
when it comes to providing dispatchable power in many markets - even without subsidies.
2.2 Renewable energy penetration rates in the EA-SA-IO region
In the countries that form the EA-SA-IO region, about 23 percent of the installed generation
capacity is renewable. As evident from Figure 2-2., the lion’s share of electricity is still produced
by burning natural gas and coal.
2-2REPORT ‘Renewable Energy Incentive Mechanisms
Figure 2-2: Installed Capacity by region and technology in the EA-SA-IO region (2019)
Illustration: Consultant’s analysis of data from IRENA, 2020
Perhaps more striking than the current dominance of fossil generation capacity, is how
geographically concentrated it is. Four countries, namely Egypt, South Africa, Libya, and Tunisia
make up about 80 percent of the total installed generation capacity in the EA-SA-IO region;
however, of this amount, only 11 percent comes from renewable generation sources. In the
remaining 25 countries, the installed capacity from renewable sources is near 70 percent.
2-3REPORT ‘Renewable Energy Incentive Mechanisms
Figure 2-3: Total renewable and non-renewable generation capacity in the EA-SA-IO region by
country
Source: Consultant’s illustration of data from IRENA, 2019
From 2010 to 2019, the installed capacity in renewable energy in the EA-SA-IO region has
almost doubled from 21.1 GW to 39.1 GW, as detailed in the figure below. This corresponds to
a compound annual growth rate (CAGR) of seven percent (falling short of the global CAGR of
nine percent in the same period). Whereas this demonstrates some positive development over
the last decade, it should be noted that growth has slowed down in the past two years, falling
behind global renewable energy expansions. Furthermore, as evident in Figure 2-3, renewable
energy still only makes up 23 percent of the regional generation capacity (IRENA, 2020a).
2-4REPORT ‘Renewable Energy Incentive Mechanisms
Figure 2-4: Total installed renewable energy capacity in the EA-SA-IO region, 2010-2019
Source: Consultant’s illustration of data from IRENA, 2020
In the preceding sections, we have highlighted that despite drastic cost reductions that have
made renewables the least-cost option, the total penetration rate remains low for the EA-SA-IO
region as a whole. This is in spite of the fact that the African continent has abundant renewable
energy resources, with the theoretical potential estimated to be 1,000 times higher than the
total electricity demand in 2040 (IRENA, KfW & GIZ, 2021). The resulting question is: What is
holding back renewable energy in the region?
2.3 Barriers to rapid renewable energy expansion
Over the past few decades many countries in the EA-SA-IO region have gone through some
form of power sector reform. These have often resulted in hybrid models dominated by vertically
integrated utilities, with private participation in the form of Independent Power Producers (IPPs)
coming in on the margins to address growing electricity demand deficits at a time of limited fiscal
resources (Power Africa, 2019).
Publicly held utilities still own the lion´s share of generation capacity across the region, but many
of them are unable to raise sufficient debt at affordable rates (IRENA, KfW & GIZ, 2021).
Therefore, IPPs are the fastest growing source of new generation capacity on the African
continent. By attracting private investments in generation, governments free up scarce public
resources for other critical priorities such as healthcare and education.
A study by IRENA, KfW and GIZ (2021) identified a number of barriers to a more rapid scaling
up of renewable energy technologies across Africa. These include:
• High actual and/or perceived risk often makes raising financing for renewable energy
projects difficult and costly;
• Shortcomings in regulatory and legal frameworks for private sector investments;
• Integrating large amounts of renewable energy is challenging in the absence of power
system flexibility;
• Electricity is wasted due to high transmission and distribution losses and energy
inefficiencies; and
2-5REPORT ‘Renewable Energy Incentive Mechanisms
• Many fossil fuel plants still have economic lifetimes that extend beyond the next decade.
These barriers manifest themselves to varying degrees in different countries, meaning that there
is no one-size-fits-all approach to incentivising renewable energy deployment. This is further
explored in the next chapter.
2-6REPORT Renewable Energy Incentive Mechanisms
3 Renewable Energy Incentive
Mechanisms
Key take-aways:
1. Depending on their specific circumstances, countries across the EA-SA-IO can have
different policy motivations for increasing their electricity generation from renewable
sources. These include emissions reduction and access expansion beyond the grid.
2. A large number of regulatory, fiscal, and financial incentive mechanisms are available
to policy makers. Their suitability depends on the country context, and whether the
generation will be absorbed by the national grid, directly by a co-located commercial or
industrial load, or directly by a co-located household.
3. As the share of variable renewables increase and prices of storage keeps falling, policy
makers must also consider how storage investments can best be integrated in
renewable energy incentive mechanisms.
This chapter introduces a series of possible policy objectives for increased renewable
energy penetration and discusses how different incentive mechanisms can best be deployed
to meet each of these.
3.1 Policy objectives for new generation capacity
Depending on their specific circumstances, countries across the EA-SA-IO can have different
policy motivations for wishing to increase electricity generation from renewable sources. For
example:
• Some countries have power grids that are limited to the major population centres and need
to expand rural access through mini- and off-grid solutions based on renewable energy.
• The countries with the highest installed generation capacity in the EA-SA-IO region have
near-universal access to electricity and comparatively mature economies, but also have the
highest emissions in the region due to their dependence on fossil generation sources. They
might therefore wish to replace existing generation from coal, oil, and natural gas with low-
cost and emissions free renewable energy.
The figure below introduces several possible policy objectives which could be balanced and
prioritised to guide design and implementation of incentive mechanisms in each country.
Figure 3-1: Possible policy objectives for renewable energy expansion
3-1REPORT Renewable Energy Incentive Mechanisms
Clearly, the renewable energy investments required to address these policy objectives need to
be unlocked by means of different market interventions. The subsequent section outlines a
typology for renewable energy projects to structure the discussion on renewable energy
incentive mechanisms.
3.2 Categorisation of renewable energy segments
Renewable energy generation can be grouped according to a number of parameters, including
technology, size, and whether it is variable or dispatchable. For the purpose of this report, a
three-part segmentation based on the direct off-taker is applied, because utility-scale,
commercial and industrial (C&I), and residential renewable energy generation capacity face
different challenges in scaling up.
The table below provides an overview of key characteristics of the different segments. The
purpose is not to give a clear-cut structure for classifying any and all projects, but rather to
provide a framework for identifying general segments of investments that need to be incentivised
by different means. It is therefore understood that there are considerable grey-zones.
Figure 3-2: Segments of renewable energy generation infrastructure
Utility-scale Commercial & Residential
Industrial
Summary These renewable energy These small to medium These small size
investments are typically size renewable energy renewable energy
larger, and may, investments are usually investments are most
depending on the for self-consumption, commonly used for self-
context, have meaningful either to reduce cost or consumption. In the EA-
impacts on the larger improve security of SA-IO region these are
power system. supply. often off-grid solutions
for electrification
purposes.
Project Size Large (>1 MW) Medium (REPORT Renewable Energy Incentive Mechanisms
3.3 Incentive mechanisms for renewable energy
A large number of incentive mechanisms are in active use by governments wishing to promote
renewable energy. IRENA (2015a) classifies these as follows:
• Regulatory incentive mechanisms are comprehensive programs to provide the regulatory
and market conditions required for a renewable energy investment to take place.
• Fiscal incentive mechanisms aim to reduce the burden of high upfront costs for renewable
energy projects. They typically come in the form of tax incentives, rebates, and grants.
• Financing incentive mechanisms typically aim to improve access to capital and lower
financing costs. They often come in the form of concessional loans, guarantees, and other
measures to mitigate risk.
While this report largely focuses on supply side (push) mechanisms, several demand side (pull)
mechanisms also need to be recognised for completeness. The figure below provides an
overview of the most common incentive mechanisms for promotion of renewable energy, as well
as relevant enabling mechanisms.
Figure 3-3: Common incentive mechanisms for promotion of renewable energy
Source: Adapted from IRENA (2015)
Figure 3-4 below describes incentive mechanisms for the promotion of renewable energy.
Figure 3-4: Description of incentive mechansisms for the promotion of renewable enegry
Incentive Description
Mechanism
Regulatory incentive mechanisms
REFiT and A renewable energy feed-in tariff (REFiT) or premium offers cost-based
Feed-in compensation to renewable energy producers on top of the market price for
premiums electricity, typically per kWh produced. This provides price certainty and long-term
contracts that may make financing more readily available. The main challenge is
getting the tariff or premium level just right, and adjusting it as needed.
3-3REPORT Renewable Energy Incentive Mechanisms
Auctions An auction is a competitive process for procuring renewable energy generation
capacity. In an auction, project developers bid against each other to supply energy
through long-term contracts. Awards are generally made according to transparent
criteria, including price. Auctions are often supported by other instruments, such as
guarantees and other fiscal benefits.
Renewable Renewable Energy Certificates are a market-based instrument that certifies that a
Energy MWh of renewable electricity has been generated. Certificate schemes typically
Certificates include a quota requirement governing how many certificates end-consumers have
(or Green to buy based on their consumption. The certificates are issued to generators, who
Certificates) in turn can sell them to end-consumers (typically represented by utilities), creating
a new revenue stream to help fund new renewable generation capacity.
Net metering Net metering (or net energy metering) is an electricity billing mechanism that allows
(or net billing) consumers who generate some or all of their own electricity to use that electricity
anytime, instead of when it is generated. In a net metering scheme, the
compensation is given in energy (i.e. in kWh), and the credit can be applied to offset
consumption of electricity within the current billing cycle and even in future billing
cycles. In net billing, the compensation is monetary.
Fiscal incentive mechanisms
Tax exemption Tax incentives for renewable energy projects are typically offered in the form of
reductions in sales, energy, value-added or other taxes. They may also be offered
as tax credits.
Import & export Fiscal import and export benefits can be offered in the form of reduced charges
fiscal benefits and duties on i) imports of goods and services required for construction of
renewable energy power plants and accompanying infrastructure, or ii) export of
renewable energy.
Accelerated Accelerated depreciation allows greater depreciation in the early years, reducing
depreciation the tax burden of renewable energy assets.
Financing incentive mechanisms
Investment Investment grants are offered by governments or other entities (e.g. development
grants partners) to partly or fully finance studies or private capital investments to increase
renewable energy generation capacity.
Credit facility A credit line is a loan that is disbursed by a funder to one or more intermediary
financial institutions for them to on-lend to end-borrowers, aiming to address one
or more credit market failures and increase lending to renewable energy projects.
A credit facility will always consist of one or more credit lines but can also include
supportive design elements such as guarantees and technical assistance.
Currency Currency hedging is a strategy designed to mitigate the impact of currency or
hedging foreign exchange risk on international investments returns, such as lending in local
currency.
Guarantees A guarantee is a financial instrument that is similar to an insurance policy. For a
fee, it provides financial compensation for the financier if the borrower is not able
to pay back.
Having introduced the segmentation of renewable energy investments and given an overview of
the most common incentive mechanisms, the subsequent section merges the two frameworks
to explore which incentive mechanisms are best suited to unlock the different types of
investments.
3-4REPORT Renewable Energy Incentive Mechanisms
Figure 3-5: Selected lessons learned on incentive mechanisms from the region
3-5REPORT Renewable Energy Incentive Mechanisms
3.4 Incentive mechanisms for different renewable energy segments
As outlined in the following sub-sections, utility-scale, commercial and industrial and residential
renewable energy generation capacity face different challenges in scaling up, meaning that they
need to be addressed by different incentive mechanisms. Notably, the differences between
these three categories are even more pronounced, and have greater policy implications than
other differences between projects such as type of technology (e.g. solar PV and wind). The
subsequent sub-sections therefore outline, on a general basis, the incentive mechanisms that
are suitable for each of the three segments. It should be noted, however, that implementation
needs to be tailored to the context and needs of each country.
Utility-scale renewables
Utility scale renewable energy investments are typically larger, and the ability to raise financing
in often immature credit markets is therefore often a key question. The figure below provides an
overview of the key challenges involved in scaling up utility-scale renewables and provides an
overview of the most common incentive mechanisms applied.
Figure 3-6: Key challenges and incentive mechanisms for utility scale renewables
Commercial and industrial renewables
These small to medium size renewable energy investments are usually for self-consumption,
either to reduce cost or improve security of supply. While the credit-market related challenges
may be smaller because the investments typically are not project financed, there are still
regulatory challenges that need to be addressed in order to scale up. These are outlined in the
figure below.
3-6REPORT Renewable Energy Incentive Mechanisms
Figure 3-7: Key challenges and incentive mechanisms for C&I renewables
Residential Renewables
These small size renewable energy investments are commonly for self-consumption, in some
cases financed and procured through an aggregator. Even so, access to capital is a pressing
issue at the household level across the EA-SA-IO region that needs to be addressed in order to
create a well-functioning market for residential renewables. The figure below provides an
overview of the available incentive mechanisms.
3-7REPORT Renewable Energy Incentive Mechanisms
Figure 3-8: Key challenges and incentive mechanisms for residential renewables
Implications of including storage
For off-grid solutions, storage is needed to ensure access to electricity throughout the day and
year. However, storage solutions are also becoming increasingly relevant, even on-grid as the
share of variable renewable energy increases. As utility-scale storage become more affordable,
more and more utilities are procuring combined solar and storage solutions in an effort to
increase the reliability of the grid, competing with traditional dispatchable sources (PV Magazine,
2021; Energy Storage News, 2021).
Going forward it will be increasingly important for policy makers to integrate storage in renewable
energy procurements and incentive mechanisms, for example by including these investments in
renewable energy auctions and making them eligible for relevant tax exemptions and grants.
Summary of incentive mechanisms
Clearly, most fiscal and financing incentives can be used to increase investments in utility-scale,
C&I and residential renewables alike by reducing investment costs and making credit more
readily available. On the other hand, several of the regulatory incentives are mainly relevant for
utility-scale investments, either because they are associated with transaction costs that only can
be carried by larger projects, or because they address capital market failures that mainly are
related to project financed investments. The figure below provides a summary of the findings in
section 3.4 as a basis for the subsequent guidelines for procurement of renewable energy
generation capacity.
3-8REPORT Renewable Energy Incentive Mechanisms
Figure 3-9: Advantages and disadvantages of incentive mechanisms and relevance for different renewable energy segments
3-9REPORT Renewable Energy Incentive Mechanisms
4 Renewable Energy Procurement
Key take-aways:
1. Achieving the goal of universal access to affordable, reliable and emissions free energy
in Africa may require investments between USD 60 and USD 90 billion annually until
2030. This effort will require mobilisation of private investments.
2. Where African governments traditionally have relied on direct negotiations to procure
private investments in generation capacity, modern procurement approaches such as
REFiTs and auctions have proven more effective in realising key procurement
objectives.
3. Where REFiTs are particularly useful for fostering a project pipeline and growing the
market by providing a level of transparency and predictability to developers, auctions
have been proven to drive down LCOE by introducing competition even in immature
markets. The lower transaction costs make REFiTs more suitable for smaller projects.
Having conducted a high-level assessment of the mechanisms available to governments
that wish to incentivise different segments of renewable energy generation, this chapter
focuses on a sub-set of the regulatory instruments commonly referred to as procurement
methods. An analysis is conducted to explore when and how these can best be leveraged to
increase the generation of renewable energy in the EA-SA-IO region.
4.1 Public Projects versus PPPs
Achieving the goal of universal access to affordable, reliable and emissions free energy in Africa
will require significant investment in the power sectors on the Continent, by some sources
estimated to be between United States Dollar (USD) 60 and USD 90 billion annually until 2030
(IRENA, KfW, & GIZ, 2021). Clearly, many governments in the EA-SA-IO region do not have the
resources required to shoulder this cost alone. As such, Public-Private Partnerships (PPPs),
often financed via Development Finance Institutions (DFIs) are widely regarded are an important
means of accessing the capital required to expand generation capacity (World Bank, 2020).
Public-Private Partnerships
A PPP is a cooperative arrangement between two or more public and private sectors,
typically of a long-term nature. It involves governments and the private sector working
together to complete a project and/or to provide services to the population. PPPs are
implemented in a number of countries across the region, and primarily used for
infrastructure projects such as hospitals, transport systems, sewerage systems – and
power infrastructure.
Source: Hodge & Greve (2007)
Furthermore, if an investment is financed by public sector borrowing, the full amount of the loan
including interest is repayable regardless of the success or failure of the project. With PPPs, on
the other hand, a significant share (though not all) of this risk is transferred to the private sector.
The figure below provides a schematic overview of risk allocation and payment obligations of
the government for public and PPP projects, respectively.
4-1REPORT Renewable Energy Incentive Mechanisms
PPP arrangements can take a variety of forms, with the most common being build-operate-
transfer (BOT). BOT is procurement method usually reserved for large-scale infrastructure
projects, wherein a private entity receives a concession from the public sector to finance, design,
construct, own, and operate a facility as described in the concession contract. This allows the
project proponent to recover its investment, operating and maintenance expenses. There are
many variations of PPPs, with BOT schemes being particularly common for renewable energy
projects (Yun et al., 2012).
Generally speaking, an IPP4 is a PPP, and a PPP in the electricity generation sector is an IPP.
The structuring and documentation of IPPs in the EA-SA-IO region is almost invariably driven by
a desire to achieve the lowest possible electricity tariff. A high-level comparison of public projects
and PPPs (in the form of IPPs) in terms of government cash-flow and risks is provided in the
figure below. For the remainder of this chapter, we focus on IPPs and methods available for
their procurement.
Figure 4-1: – Schematic comparison of public projecs and PPPs
4 In some cases, IPP refers to “Independent Power Projects” and not the company that is developing the project.
4-2REPORT Renewable Energy Incentive Mechanisms
Key terms
Debt Financing in Emerging Economies
Typically, DFIs offer cheaper debt than private financing institutions. Their mandates also
tend to allow them to accept more risk. Therefore, across the EA-SA-IO region one
typically sees DFI lenders driving IPP structuring and documentation and setting the
requirements for the risk allocations within the Project documentation. While market
practices are not set in stone, increasingly common themes and practices are emerging
across renewable energy IPPs across Sub-Saharan Africa.
IPPs in Sub-Saharan Africa are typically financed in the ratio of 20 – 30 percent equity
investment to 70 – 80 percent debt finance. Finance costs depend very much on the
quality of the project agreements (from a financing perspective) as well as the perceived
creditworthiness of the specific off-taker and attractiveness of the host country in question
as destination for foreign direct investment.
However, assuming a well-structured and documented IPP structure for solar PV, in the
current market, one might expect electricity tariffs based on post-tax equity internal rates
of return at around 12 percent (or potentially below this level), and interest rates on debt
finance at LIBOR + around five to six percent (with so-called 'door-to-door' tenors/terms
in the region of 15 to 18 years). Although these financing costs are borne initially by the
IPP, they will be reflected directly in the electricity tariff paid by the off-taker.
Bankability
Lenders will typically expect a very high standard of project documentation, and for risks
to be allocated according to the principle that each Project-related risk should be allocated
to the stakeholder who is best able to manage that risk.
As such, preparation and documentation of IPPs is driven to a large extent by what is
"bankable"; i.e., acceptable to the banks (and other financiers) financing the project.
In practice, this will depend on a range of factors including any experience and/or
perception of the financiers of the host country, the actual or perceived track record of the
utility/off-taker, the specific lenders, their appetite for the given project, and how well the
Government and utility have prepared and presented the project opportunity. It should
also be noted that what is bankable at one tariff (and/or surrounding risk allocation) in one
country may not be bankable in another.
Source: Multiconsult (2018)
4.2 Procurement Methods
Fundamentally, one can differentiate between solicited and unsolicited proposals for PPP
projects. Solicited projects are developed by the public sector when a project is required to be
initiated in accordance with a government’s policies and infrastructure development plan. In
contrast, unsolicited proposals are initiated by private sector organisations that seek business
opportunities.
4-3REPORT Renewable Energy Incentive Mechanisms
Figure 4-2: Solicited and unsolicited procurement
Projects implemented based on unsolicited proposals often face a range of challenges – ranging
from allegations of misuse of public resources, corruption, fraud, and poor quality of
infrastructure to the lack of competition resulting in high prices.
Even so, a lack of capacity to identify, prioritise, prepare, and procure projects still means that
unsolicited proposals remain fairly common in the region. Further, unsolicited proposals avoid
lengthy competitive processes for quicker implementation (Yun et al., 2015) and they can tap
into the innovation and knowledge of the private sector to identify value-for-money project
solutions (PPIAF, 2014).
Governments that wish to increase private-sector participation in their power sectors through
procurement of IPPs have several alternatives open to them, both solicited and unsolicited
contracting approaches. The table below outlines two generic approaches which often are
referred to as traditional (NREL, 2011).
Competitive solicitations A competitive solicitation is a formal process under which the
“Traditional RfP” procurement agent (often the utility) issues a request for proposal
(RfP), collects and evaluates qualifying bids, and executes contracts
with winning bidders. The approach typically involves contract
negotiation either with the highest-ranking bidder or with a short list of
bidders. Weight is given to both price and non-price criteria, and
regulators are typically involved in creating evaluation metrics and
ultimately approving contracts (Tierney and Schatzki 2008).
Direct negotiations Under direct negotiations (bilateral contract approach), contracts for
new renewable capacity are signed between the two entities without
resorting to an official competitive solicitation (Wiser et al. 2005).
Bilateral contracts are private, two-party transactions used in both
regulated and competitive markets. Either the developer (in which case
the procurement type would qualify as unsolicited) or the utility can
initiate bilateral contract negotiation.
In regulated markets, bilateral contract negotiation may occur on a
case-by-case basis if a utility solicits a bid from a particular developer
or if a developer approaches a utility with a proposal to develop new
electrical capacity within a utility’s service area. As with contracts
resulting from requests for proposal, bilateral contracts are subject to
approval by state utility regulators.
4-4REPORT Renewable Energy Incentive Mechanisms
However, in recent years, new procurement strategies have been successfully applied in
procuring renewable energy IPPs, chiefly the ones outlined in the table below.
Figure 4-3: Modern procurement approaches
Renewable Energy Feed-In A renewable energy feed-in-tariff is a policy mechanism designed to
Tariffs (REFiT) accelerate investments in (utility-scale) renewable energy technologies by
offering long-term contracts to renewable energy producers. The goal is to
offer cost-based compensation with transparent and certain pricing that
allows potential project developers to secure financing more easily (Cory et
al., 2010; Couture & Gagnon, 2010). As noted earlier, REFiT projects can be
initiated by developers or solicited by public entities via a procurement
program.
Auctions Under a formal auction framework, IPPs bid into the auction expressing a
willingness to sell a given product at a given price, soliciting from others their
willingness to buy at that price. Auctions have been used in bid-based energy
markets, where electricity producers effectively “bid” into a marketplace at a
price that approximates their marginal cost (Sioshansi 2008). Renewable
energy auctions are similar to request for proposal processes; the difference
being that auctions generally rely on the price criterion only after bidders are
qualified. Most electricity market auctions are conducted as sealed-bid
auctions, meaning that no contract negotiation is permitted. Eliminating all
non-price bid factors, procurement agents obtain a pared-down competitive
process, which may take significantly less time to administer.
As would be expected, the different types of procurement score differently in terms of fulfilling
the different procurement objectives that a Government may have, such as price discovery,
transparency, expedience, and transaction costs. This is further explored in the figure below.
Figure 4-4: Comparison of procurement methods by procurement objectives
4-5REPORT Renewable Energy Incentive Mechanisms
From the simplified figure above, one can see that the modern procurement approaches score
better than the traditional ones on most indicators. As always, however, project- and market-
specific characteristics need to be taken into consideration when deciding on a procurement
method.
Further, it should be noted that the objectives outlined above carry different weights depending
on the priorities of policy makers and preferences of stakeholders. As an example, DFIs typically
require a high level of transparency, which generally excludes direct negotiations.
Finally, if certain incentive mechanisms are employed and financed/funded by development
partners (e.g. investment grants in the form of top-ups), these partners may have requirements
and procurement guidelines that need to be followed.
The figure below provides a high-level overview of the types of projects for which the four main
procurement methods are most suitable.
Figure 4-5: Overview of suitable procurement methods by projects and market characteristics
As noted earlier, both REFiTs and auctions are modern procurement methods that have gained
considerable popularity in the last decade, especially for renewable energy mobilisation. In the
following section we further examine these two procurement methods.
4.3 REFiTs and Auctions
REFiTs have long been the most widely used support mechanism to encourage the growth of
grid-connected renewables globally. However, auctions have gained significant attention and
momentum in the past decade, with over 60 GW of solar capacity being awarded in auctions in
2019 alone (Eberhard, 2014; IRENA, 2021).
REFiTs and auctions have some key distinguishing features with implications for the market,
including that:
• auctions are solicited procurement of installed capacity, whereas;
• a REFiT policy sets the framework for unsolicited proposals (initiated by developers) that can
be paired with a solicited procurement program based on the REFiT policy.
4-6REPORT Renewable Energy Incentive Mechanisms
The following section takes a closer look at both REFiTs and auctions, discussing key design
criteria and providing examples and lessons learned from implementations across the EA-SA-
IO region.
Renewable Energy Feed-in Tariffs
REFiT policies or regimes have been established in a range of African countries. The following
provides an overview of certain African REFiT tariffs, selected to highlight the spectrum of
approaches and results.
Figure 4-6: Overview of selected REFiT-schemes in Africa
South Africa The National Energy Regulator of South Africa (NERSA) approved a REFiT policy
in 2009. Tariffs were designed to cover generation costs plus a real return on
equity of 17 percent and would be fully indexed for inflation (NERSA 2009). The
initially published feed-in tariffs— USD 15.6 cents per kWh for wind, 26 cents per
kWh for concentrated solar (including six hours of storage), and 49 cents per kWh
for solar PV. In March 2011 NERSA released a consultation paper with lower feed-
in tariffs, arguing that parameters such as exchange rates and the cost of debt
had changed. Moreover, the capital component of the tariffs was no longer to be
fully indexed for inflation. After receiving legal advice opining that REFiTs were
inconsistent with public finance and procurement laws, the Department of Energy
announced that a competitive bidding process for renewable energy would be
launched, known as the Renewable Energy Independent Power Producer
Procurement (REIPPP) program. Subsequently, the regulator abandoned feed-in
tariffs. See example box below for further details.
Uganda The Government of Uganda introduced a REFiT in 2007 as part of its Renewable
Energy Policy. Due to limited uptake by developers, it was reviewed in 2010 based
on updated LCOE numbers and with new guidelines. The REFiT is now reviewed
every two years. The latest guidelines were published in 2019 (REFiT – Phase 4
Guidelines) and is managed and implemented by Uganda’s Energy Regulatory
Authority as part of its mandate under the Electricity Act of 1999.
Uganda´s REFiT provides differentiated tariffs for hydropower, bagasse,
geothermal, biogas, landfill gas, biomass, wind power and solar PV, and the
guidelines specify cumulative capacity limits for each technology. In Phase 4, only
hydropower and bagasse projects have a fixed per kWh tariff defined (varying by
project size). Other technologies that are untested in Uganda have a combination
of a ceiling tariff and maximum return on equity – and are subject to bilateral
negotiations (ERA, 2019).
The private-sector development programme GET FiT Uganda was a vehicle
programme that procured 158 MW of renewable energy capacity based on the
REFiTs – in the form of 14 hydropower projects, two solar PV projects and a
bagasse project. The programme offered Viability Gap Funding (a per kWh top-
up), to demonstrate the economic viability of projects. See example box below for
further details.
Kenya In January 2010, the Kenyan government published its new REFiTs to provide
investment security to private investors in renewable electricity generation and
reduce administrative and transaction costs.5 As of 2020, only 10.3 MW of
generation capacity have been procured based on the FiT policy, falling short of
the 1,500 MW target. See example box below for further details.
5 Further details are available at: https://www.iea.org/policies/4957-revised-feed-in-tariffs-for-renewable-energy
4-7You can also read