Evaluation of micro rain radar-based precipitation classification algorithms to discriminate between stratiform and convective precipitation - Recent
←
→
Page content transcription
If your browser does not render page correctly, please read the page content below
Atmos. Meas. Tech., 14, 4565–4574, 2021
https://doi.org/10.5194/amt-14-4565-2021
© Author(s) 2021. This work is distributed under
the Creative Commons Attribution 4.0 License.

Evaluation of micro rain radar-based precipitation
classification algorithms to discriminate between stratiform
and convective precipitation
Andreas Foth1 , Janek Zimmer2 , Felix Lauermann1,a , and Heike Kalesse-Los1
1 Leipzig Institute for Meteorology, University of Leipzig, Leipzig, Germany
2 Meteologix  AG, Sattel, Switzerland
a now at: Meteorologisches Observatorium Lindenberg/Richard–Aßmann–Observatorium,

Deutscher Wetterdienst, Tauche, Germany

Correspondence: Andreas Foth (andreas.foth@uni-leipzig.de)

Received: 16 July 2020 – Discussion started: 18 August 2020
Revised: 16 March 2021 – Accepted: 26 April 2021 – Published: 21 June 2021

Abstract. In this paper, we present two micro rain radar-            The parameterization of the precipitation evaporation pro-
based approaches to discriminate between stratiform and           cess is highly empirical in current general circulation models
convective precipitation. One is based on probability density     (Rotstayn, 1997). Evaporation of precipitation generates cold
functions (PDFs) in combination with a confidence function,       pools that lead to convective organization (Schlemmer and
and the other one is an artificial neural network (ANN) clas-     Hohenegger, 2014) and tropical storms (Pattnaik and Krish-
sification. Both methods use the maximum radar reflectivity       namurti, 2007); it is highly relevant for boundary-layer hu-
per profile, the maximum of the observed mean Doppler ve-         midity (Worden et al., 2007) and subsequently for the trop-
locity per profile and the maximum of the temporal standard       ical general circulation (Bacmeister et al., 2006). However,
deviation (±15 min) of the observed mean Doppler velocity         also at the midlatitudes, precipitation evaporation is an im-
per profile from a micro rain radar (MRR). Training and test-     portant factor in the water cycle (Morrison et al., 2012), and
ing of the algorithms were performed using a 2-year data set      the simulated water cycle processes are highly sensitive to
from the Jülich Observatory for Cloud Evolution (JOYCE).          the empirical parameters and assumptions.
Both methods agree well, giving similar results. However,            In order to improve the parameterization of evaporation
the results of the ANN are more decisive since it is also able    from convective rain, a big data set of convective rain cases
to distinguish an inconclusive class, in turn making the strat-   is needed to generate robust statistics. Since it is a large effort
iform and convective classes more reliable.                       to manually discriminate between stratiform and convective
                                                                  cases, automated algorithms were developed.
                                                                     In previous approaches, stratiform and convective rain is
1   Introduction                                                  separated based on the raindrop size distribution measured
                                                                  by a disdrometer (Caracciolo et al., 2006; Thompson et al.,
Evaporation of precipitation below cloud base is a crucial        2015; Ghada et al., 2019). Precipitation was also classified
process in the water and energy cycle. Precipitation can be       using radar images and radar wind profiler data (Rosenfeld
of two clearly distinguishable types – stratiform and con-        et al., 1995; Williams et al., 1995; Tokay and Short, 1996;
vective. Both types originate from different clouds (Houze,       Tokay et al., 1999; Yang et al., 2013). Deng et al. (2014)
2014). Stratiform precipitation mainly falls from nimbostra-      classified convective precipitation based on thresholds of the
tus, whereas convective precipitation originates from active      radar reflectivity and the gradient of accumulative radar re-
cumulus and cumulonimbus clouds. These cloud types may            flectivity retrieved from a vertically pointing cloud radar.
occur separately or entangled in the same cloud complex.          Geerts and Dawei (2004) used a decision tree to separate

Published by Copernicus Publications on behalf of the European Geosciences Union.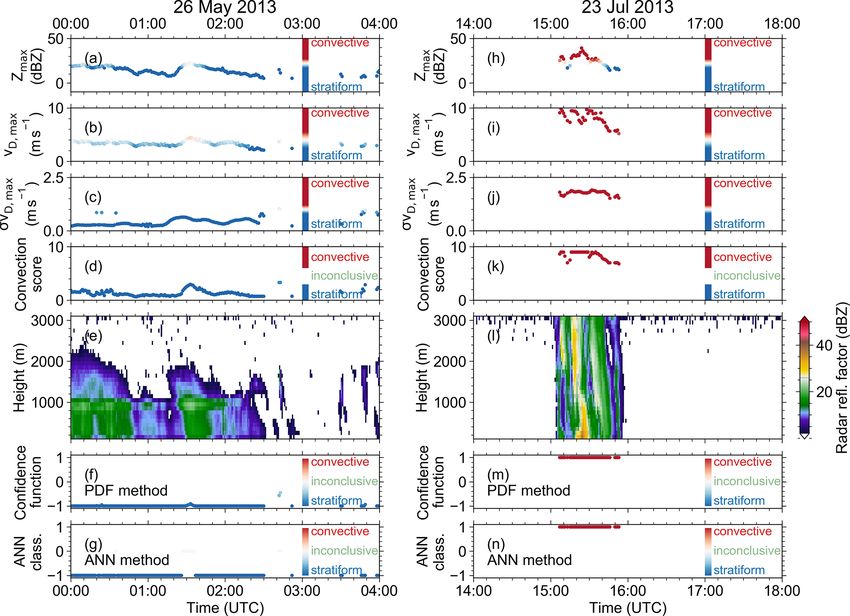
4566                                                      A. Foth et al.: Evaluation of precipitation classification algorithms

different precipitation types by means of cloud radar vari-        ing at 24 GHz (Peters et al., 2002). The MRR at JOYCE (in
ables. Additionally, discrimination algorithms using an ANN        2013 and 2014) is an MRR-2 system operating with 32 range
were developed (Yang et al., 2019; Ghada et al., 2019). The        gates. The lowermost range gates (number 0, 1 and 2) up to
ANN approach of Yang et al. (2019) is based on ground-             200 m are affected by near-field effects, and the last range
based Doppler radar observations. Lazri and Ameur (2018)           gate of 3100 m is too noisy. These range gates are usually
combined a support vector machine, ANN and random for-             omitted according to Maahn and Kollias (2012). Hence, 28
est to improve the stratiform convective classification using      range gates from 300 to 3000 m remain for the analyses in
spectral features of SEVIRI data. Jergensen et al. (2020) clas-    this study. The vertical and temporal resolution amounted
sify thunderstorms into three categories: supercell, part of a     to 100 m and 1 min, respectively. The MRR data were pro-
quasi-linear convective system, or disorganized using radar        cessed according to Peters et al. (2005). The instrument was
data in a machine-learning approach.                               zenith-pointing and measured the radar Doppler spectrum
   In summary, several approaches such as ANN, fuzzy log-          from which the mean Doppler velocity (vD ) was derived. The
ics, or decision trees based on different instruments such as      radar reflectivity factor (Z) is derived by integrating over the
disdrometer, cloud radar, precipitation radar, or radar wind       drop size distribution according to Peters et al. (2005).
profiler were developed in the past. In this paper, two meth-
ods are developed which classify rain as stratiform or con-
vective event based only on micro rain radar (MRR) obser-          3     Stratiform convective discrimination
vations to enable a widespread and straightforward usage for
                                                                   3.1     Convection indices
ground-based remote-sensing sites.
                                                                   Several weather indices can be used to describe the stabil-
2     Instrumentation                                              ity of the atmosphere (Kunz, 2007). Three indices that are
                                                                   based on thermodynamic profiles are described in the follow-
2.1    Supersite JOYCE                                             ing. All give a hint of the probability of convection based on
                                                                   COSMO (Consortium for Small-scale Modeling) EU model
In recent years, the Jülich Observatory for Cloud Evo-             data. COSMO-EU has a horizontal resolution of 7 km and
lution (JOYCE; http://cpex-lab.de/cpex-lab/EN/Home/                a vertical resolution between around 60 and 370 m below
JOYCE-CF/JOYCE-CF_node.html, last access: 1 December               3 km. The temporal resolution amounts to 1 h. The weather
2020) was equipped with a combination of synergistic               index total totals are a combination of the vertical totals
ground-based instruments (Löhnert et al., 2015). JOYCE             (VTs) and cross totals (CTs). The VT is the temperature (ϑ
is situated at 50◦ 540 3100 N and 6◦ 240 4900 E with an altitude   in ◦ Celsius) difference between 850 and 500 hPa, while the
of 111 m a.m.s.l.. In 2017 JOYCE was transformed into a            CT is 850 hPa dew point (τ ) minus the 500 hPa temperature:
Core Facility (JOYCE – CF) funded by the DFG (Deutsche
Forschungsgemeinschaft) with the aim of high-quality radar         TT = VT + CT
and passive microwave observations of the atmosphere.                    = (ϑ850 − ϑ500 ) + (τ850 − ϑ500 ) .                   (1)
The supersite operates a variety of ground-based active
and passive remote-sensing instruments for cloud and               The higher the TT is, the more probable convection is.
precipitation observations, for example, X, Ka, and W-Band            The second index, named the KO index (Andersson et al.,
radars, ceilometers, a Doppler wind lidar, an atmospheric          1989), describes the potential instability between lower and
emitted radiance interferometer (AERI), a Sun photometer,          higher levels of the atmosphere (at 1000, 850, 700, and
disdrometers, several radiation measurement systems, as            500 hPa). It is thus based on the pseudo-potential tempera-
well as an MRR. The latter is the main instrument in this          tures θe :
study and is explained in detail in the following sub-section.
The data used in this study were gathered in 2013 and 2014.        KO = 0.5(θe,700 + θe,500 − θe,1000 − θe,850 ).              (2)
The data from 2013 cover the entire year and were used to
train the algorithms (training data set). The data from 2014       The lower the KO index, the higher the potential of convec-
cover almost the entire year apart from February. This is          tion.
a completely independent data set and is used as a test data          The soaring index (S; http://www2.wetter3.de/soaring_
set for the algorithms. In 2013 and 2014, 471 and 683 h of         index.html, last access: 1 December 2020) is intended to be
rain were observed, respectively.                                  a tool in soaring and sporting aviation because it gives a hint
                                                                   of thermal lift and hence of instability. It is defined as
2.2    Micro rain radar
                                                                   S = ϑ850 − ϑ500 + τ500 − (ϑ700 − τ700 ) .                   (3)
The MRR which is built by the Metek (Meteorologische
Messtechnik GmbH) company is a compact FM–CW (fre-                 The higher the S index, the higher the probability of convec-
quency modulated–continuous wave) Doppler radar operat-            tion.

Atmos. Meas. Tech., 14, 4565–4574, 2021                                               https://doi.org/10.5194/amt-14-4565-2021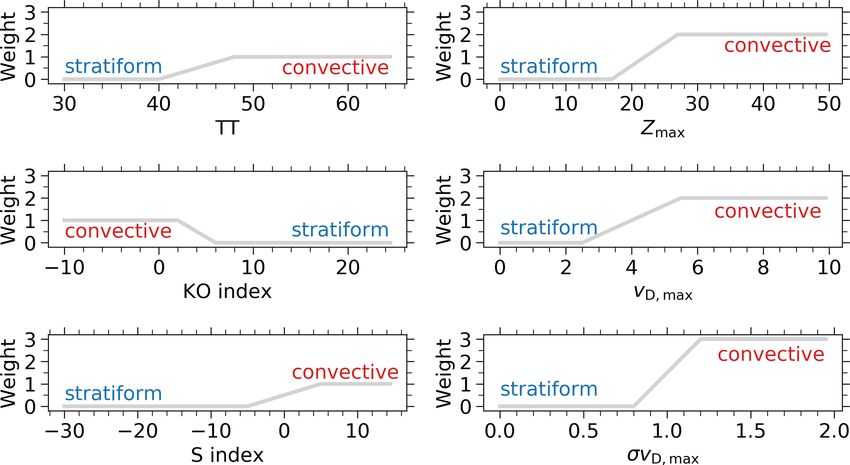
A. Foth et al.: Evaluation of precipitation classification algorithms                                                              4567

3.2   Convection score

First, a convection score to classify three types of precipi-
tation labelled as stratiform, convective and inconclusive is
defined by applying a threshold range to six different vari-
ables. Three variables are based on thermodynamic profiles
(TT, KO, S) and three are based on the MRR observations.
Specifically, the used MRR variables are the maximum of re-
flectivity (Zmax ) per profile, maximum of the mean Doppler
velocity (vD,max ) per profile and the maximum (per profile)
of the temporal standard deviation (±15 min) of the mean
Doppler velocity (σ vD,max ). The profile maxima are calcu-
lated between ground and 3 km. It is expected that larger          Figure 1. Weight of the meteorological and radar-based convec-
raindrops are usually caused by convective precipitation (Niu      tion criteria: total totals (TT), convection index (KO), soaring index
et al., 2010), which leads to higher Z and vD values, respec-      (S), maximum of the reflectivity (Zmax ) per profile, maximum of
tively. Furthermore, stratiform precipitation is expected to be    the Doppler velocity (vD,max ) per profile and the maximum (per
less variable over time, whereas convective precipitation re-      profile) of the temporal standard deviation of the Doppler velocity
                                                                   (σ vD,max ) within a ±15 min interval.
sults in a larger standard deviation of vD over time. It is as-
sumed that ±15 min is a reasonable time span for classifica-
tion of rain events. If the rain event is shorter than 30 min
(±15 min), the variability is determined over this shorter pe-
riod. The maxima of the height-dependent Z, vD and σ vD
are used to assign the vertical properties to profile proper-
ties. In case of cold stratiform rain there might be a clearly
defined melting layer. The so-called radar “bright band” is in-
dicated by erroneously high reflectivity values Z in the layer
of melting ice particles which force the detection to be con-
vective. Therefore, two other variables (vD and σ vD ) are cho-
sen which are not affected by the melting layer, and both will
counteract the false classification and force the retrieval to
classify as stratiform.
   Different weightings are assigned to the six variables as vi-   Figure 2. Relative frequency of occurrence of the convection score.
sualized in Fig. 1. Whenever a variable exceeds a convection
threshold range (or falls below it in the case of the KO index),
the weight to be convective increases. A detailed description      of the rain intensity is assumed to be the best criterion for the
of the value range of convection indices such as TT and KO         stratiform–convective discrimination.
is given by Kunz (2007). The threshold range of the MRR-              Figure 2 illustrates the distribution of the convection score.
based variables is determined empirically. For this purpose,       Whenever a convection score is less than 3, the profile is as-
the variables were closely examined and adjusted for clearly       signed as stratiform. Values between 3 and 5.5 are stated as
evident cases. The weightings of all variables are summed          inconclusive. Values larger than or equal to 5.5 are assigned
up, resulting in the convection score which ranges from 0          as convective. These strict thresholds enable a very certain
to 10. The application of a smooth linear threshold range of       classification with a low number of false classifications. The
weights between stratiform and convective is more realistic        inconclusive zone between stratiform and convective indi-
and leads to a more homogeneous distribution of the con-           cates a transition between both. The thresholds of 3 and 5.5
vection score compared to using strict binary thresholds. By       were chosen to confidently separate two classes which are
using six variables the classification is more robust against      mainly free of false classified rain events, resulting in a con-
false classifications than those based on one single variable.     fident data set for training the algorithms. This approach re-
The model-based variables have lower weightings because            places a manual inspection by visual classification of each
they are based on temperature and humidity profiles from the       single profile. However, several rain events (approx. 10 %)
nearest COSMO-EU model grid cell, which may differ cru-            were reviewed by eye to verify a correct classification. That
cially in whether it is a precipitating or a non-precipitating     means randomly selected cases were checked to see whether
grid cell. Therefore, the model-derived measures (TT, KO,          the convection score worked as intended, and the synoptic
and S) have lower weights, because the measured MRR vari-          situation was reviewed.
ables are more trustworthy than the modeled ones. σ vD,max
is assigned to have the highest weight because the variability

https://doi.org/10.5194/amt-14-4565-2021                                              Atmos. Meas. Tech., 14, 4565–4574, 2021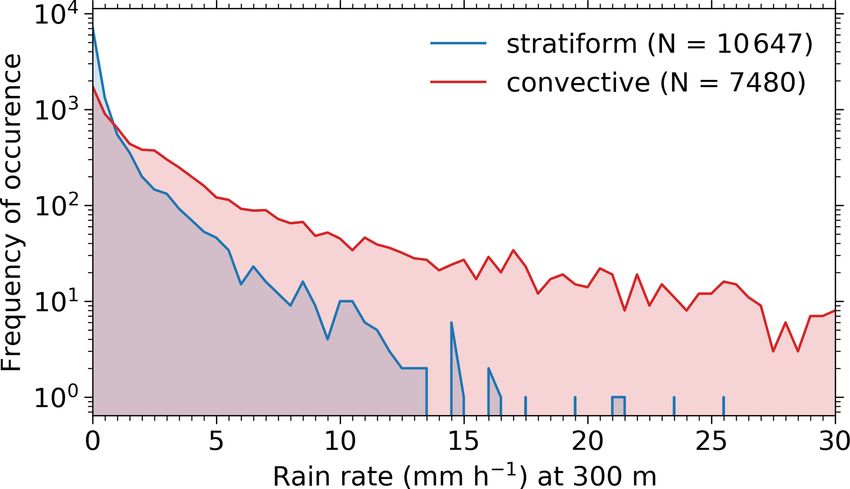
4568                                                        A. Foth et al.: Evaluation of precipitation classification algorithms

                                                                     (Winker et al., 2009). It shows that the confidence of a dis-
                                                                     crimination algorithm can be improved by using three mea-
                                                                     surement variables instead of only one or two. Later on, Liu
                                                                     et al. (2009) improved the algorithm by using five instead
                                                                     of three variables. Here, this separation approach is modified
                                                                     for MRR variables to classify precipitation as stratiform or
                                                                     convective.
                                                                        The confidence function is defined as
                                                                               nc (X) − ns (X)
                                                                     f (X) =                                                    (4)
                                                                               nc (X) + ns (X)
                                                                               Pc (X) − Ps (X)/Ns /Nc
Figure 3. Frequency of occurrence of rain rate at 300 m height for          =                           ,                       (5)
                                                                               Pc (X) + Ps (X)/Ns /Nc
stratiform (blue) and convective (red) rain cases.
                                                                     with ni being the number of occurrences of class i (stratiform
                                                                     s or convective c) having attribute X and Ni the total number
   In this step, each profile is classified as either stratiform,    of events for the ith class. P is the PDF of X, which can be
inconclusive, or convective using the convection score, and          multidimensional X = [X1 , . . ., Xm ]. The used bin size of the
this assignment is stated as the true state to train the algo-       distributions of Z, vD,max , and σ vD,max amounts to 0.5 dB,
rithms explained below. Since the motivation of this work is         0.125 m s−1 , and 0.025 m s−1 , respectively. The value of f
to classify the precipitation type and its confidence purely         is bounded by [−1, 1]. The lower the value, the more prob-
based on the MRR observations, the following methods                 able the MRR-observed rain profile is of stratiform nature.
based on PDFs or ANN are developed. Since the PDF and                Values of exactly −1 are treated as certainly stratiform, and
ANN method are based on training, the MRR data have to               values of +1 correspond to certainly convective profiles. Val-
be free of extreme or unphysical values. Therefore the MRR           ues around 0 indicate uncertain classifications. On the basis
data (input) are filtered. Only measurements with Zmax be-           of the return value of f , a classification and a measure of
tween −10 and 50 dBZ, vD,max between 0 and 10 m s−1 and              the confidence of this classification can be derived. The sign
σ vD,max between 0 and 2.5 m s−1 are taken into account.             of f determines the class assignment, and the absolute mag-
   Here, the question might arise why inconclusive profiles          nitude of f assigns the confidence to the classification. In
should be learned by algorithms. In fact, rain events can be         the following the PDFs are smoothed using a Gaussian filter
ambiguous and cannot be classified as stratiform or convec-          with a standard deviation of three bins in each dimension to
tive, especially stratiform rain moving towards mountainous          account for gaps in the PDF due to missing variable combi-
area which causes convection. On the other hand, vertical air        nations in the training data. Applying such a Gaussian filter
motion and turbulence influence vD,max and might shift strat-        makes the PDF method more robust.
iform profiles towards higher convection scores and convec-             Figure 4d, e and f show the one-dimensional distribution
tive profiles to lower scores. A class with inconclusive pro-        of the three MRR variables (Zmax , vD,max and σ vD,max ) and
files accounts for the mentioned features and avoids misclas-        their corresponding confidence functions f (Fig. 4a, b, c).
sifications into the stratiform and convective classes, respec-      Here, the stratiform and convective precipitation profiles are
tively.                                                              distinguished by the convection score explained above. How-
   The frequency distribution of rain rate at 300 m height is        ever, Zmax at values between 5 and 25 dB shows a region of
shown in Fig. 3. The precipitation cases are separated by the        overlap between both classes, resulting in low magnitude of
convection score. The stratiform precipitation mostly causes         f ranging between −0.8 and 0.8. Zmax below 5 dBZ or above
low rain rates below 1 mm h−1 , whereas high rain rates above        25 dBZ can be reliably classified as stratiform or convective,
15 mm h−1 are very rare. In contrast, high rain rates above          respectively (Fig. 4d). The distribution of vD,max (Fig. 4e) as
15 mm h−1 are caused by convective precipitation. It has to          well as σ vD,max (Fig. 4f) shows significant overlap regions
be considered that the absolute number of occurrence differs         between stratiform and convective profiles between 2.5 and
from Fig. 2 because precipitation disappears due to evapora-         5.5 m s−1 and between 0.4 and 1.1 m s−1 , respectively. This
tion on the way through the atmosphere and does not reach            results in absolute magnitudes of f below 0.8 for both vD -
300 m, which is the lowest available MRR height.                     related variables. The overlap area of stratiform and convec-
                                                                     tive profiles is smallest for σ vD,max , but since vertical air
3.3    Rain classification method based on PDF                       motion and turbulence influence vD,max , it cannot serve as
                                                                     a stand-alone value. In conclusion, a classification algorithm
This algorithm was developed based on the classification al-         based on only one of the mentioned MRR variables is not
gorithm by Liu et al. (2004) which was originally developed          able to unambiguously distinguish between stratiform and
for the Cloud-Aerosol Lidar and Infrared Pathfinder Satel-           convective precipitation indicated due to existing overlap re-
lite Observations (CALIPSO) aerosol cloud discrimination             gions.

Atmos. Meas. Tech., 14, 4565–4574, 2021                                               https://doi.org/10.5194/amt-14-4565-2021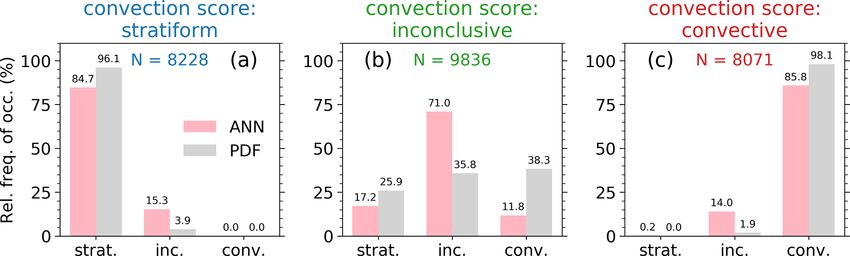
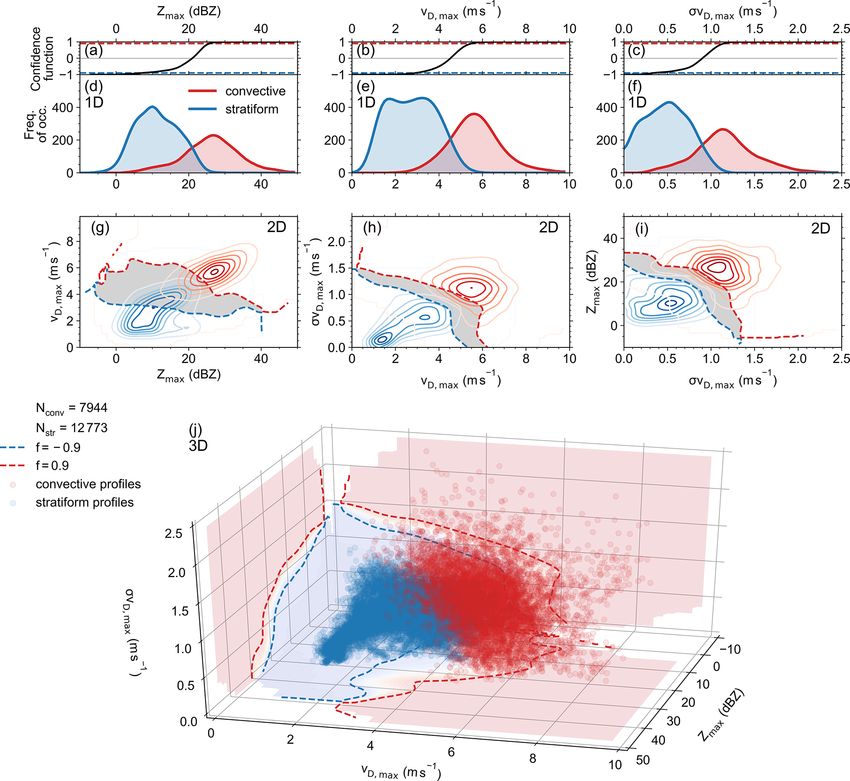
A. Foth et al.: Evaluation of precipitation classification algorithms                                                                4569

Figure 4. Overview of the one-dimensional (1D: d, e, f), two-dimensional (2D: g, h, i), and three-dimensional (3D: j) probability density
functions for the maximum radar reflectivity Zmax per profile (d), the maximum of the observed Doppler velocity vD,max per profile (e), the
maximum of the temporal standard deviation of the observed Doppler velocity σ vD,max per profile (f), and each 2D combination of these
three variables (g–i). Panel (j) shows the 3D scatterplot of the three variables with the contour of the corresponding confidence values in
each plane. Panels (a)–(c) show the confidence function of the corresponding 1D distributions. The dashed lines represent the thresholds
of a confident classification with values beyond −0.9 and 0.9, whereas values in between are indicated by a grey area (g–i). Stratiform or
convective profiles are indicated by blue or red colors and by low or high values of the confidence functions, respectively.

   The ambiguity can be reduced by adding a second dimen-               ment. In principle, these ambiguous assigned profiles with
sion to the PDF. Figure 4g, h and i illustrate the distribu-            f values between −0.9 and 0.9 could be stated as inconclu-
tion of each two-dimensional (2D) combination of the three              sive. However, the PDF algorithm is not trained to classify
MRR-based variables. The dashed lines indicate the f values             inconclusive cases. A quantitative estimation of how well the
of −0.9 and 0.9. The values in between represent the over-              discrimination works is given at the end of this sub-section.
lap where no unambiguous assignment can be made (grey                   By using all three mentioned MRR-based variables, a three-
area). The peaks of the two classes are clearly separated for           dimensional (3D) PDF can be created which is visualized in
all three variable combinations (Fig. 4g, h, i). Nevertheless,          Fig. 4j. It is indicated that both stratiform and convective pro-
there are still observations leading to an ambiguous assign-            files are clearly separated with a very small region of overlap.

https://doi.org/10.5194/amt-14-4565-2021                                                   Atmos. Meas. Tech., 14, 4565–4574, 2021
4570                                                             A. Foth et al.: Evaluation of precipitation classification algorithms

                                                                          independent of Z and would not add any more information
                                                                          to the discrimination algorithm.

                                                                          3.4    Method based on an artificial neural network
                                                                                 (ANN)

                                                                          A classification of rain as stratiform, convective or inconclu-
                                                                          sive can also be based on an ANN. The ANN model cre-
                                                                          ated is a multi-layer perceptron approach implemented using
                                                                          the open-source machine-learning library for research and
                                                                          production TensorFlow (TensorFlow: an end-to-end open-
                                                                          source machine-learning platform, https://www.tensorflow.
Figure 5. Comparison of the mean stratiform convective discrimi-          org/, last access: 1 December 2020). It is trained with Zmax ,
nation failure rates for two data sets, the training data set from 2013   vD,max and σ vD,max from the training data set (2013). The
(light grey) and the test data set from 2014 (dark grey). The shown       ANN model (Fig. 6) consists of three input nodes (Zmax ,
failure rate is separated for PDFs with increasing dimension: 1D          vD,max and σ vD,max ) and is further composed of two hid-
is based on only one MRR variable, 2D is a two-dimensional PDF            den layers with six nodes each and one output node to learn
based on two MRR variables, and 3D is a three-dimensional PDF
                                                                          how to classify rain events according to the true classification
based on three MRR variables, as mentioned in the legend.
                                                                          made by the convection score. With the chosen number of
                                                                          hidden layers and nodes, nonlinear relationships can be bet-
The quality of the 3D-PDF-based classification in contrast to             ter represented, and the ANN shows the best performance.
2D and 1D can be explained in terms of failure rates Rf (Liu              Giving Zmax , vD,max and σ vD,max as input to the ANN, it
et al., 2009):                                                            will classify the rain event with probabilities of being strati-
                                                                          form (labeled as −1), inconclusive (0), and convective (1). To
           |f (X) − 1|                                                    finally classify the rain event, the class with the highest prob-
Rf (X) =               .                                           (6)
               −2                                                         ability is stated as being the actual rain type. For example,
As explained above, the performance of the classification is              the ANN outputs the probabilities 0.7 for stratiform, 0.2 for
limited by the amount of overlap in the PDFs. The smaller                 inconclusive, and 0.1 for convective. Then this profile is clas-
the overlap, the clearer the separation between stratiform and            sified as stratiform with the label −1. The model is trained
convective profiles. Figure 5 presents the mean failure rate              for 500 epochs (iteration steps), and the training data are
for the 1D, 2D, and 3D PDFs of the training data set 2013                 shuffled before each epoch. The algorithm Adam (Kingma
and the independent test data set 2014. The training data                 and Ba, 2014) is used to optimize the model. As activation
were used to build the PDF for the calculation of f . For each            functions relu (rectified linear unit) and softmax are used for
profile from the test data, the corresponding f value can be              the two hidden layers and the output layer, respectively. Relu
read out from the trained confidence function. To account                 avoids negative output, whereas softmax produces an output
for measurement uncertainties or turbulence influencing all               which is a range of values between 0 and 1, with the sum of
radar variables, the f underlying PDFs are smoothed using                 the probabilities equal to 1. As a loss function the categori-
a Gaussian filter with a standard deviation of three bins in              cal cross-entropy is used to compute the cross-entropy loss
each dimension corresponding to a Zmax of 1.5 dB, vD,max of               between the truth and the predictions. The cross-entropy is
0.38 m s−1 , and σ vD,max of 0.08 m s−1 . In Fig. 5 it is obvious         a measure of the difference between two probability distribu-
that a reduction of the overlap by adding another attribute               tions. The accuracy of the neural network can be described in
(MRR-based variable) results in smaller failure rates. The                terms of how often the predictions equal the truth. The ANN
highest failure rates result from the 1D PDFs. The mean fail-             accuracy of the independent test data set (2014) amounts to
ure rate for the 3D-PDF-based rain classification discrimina-             80 %.
tion for training and test data is less than 1 % and 3 %, respec-
tively. This is much lower than the failure rates of 1D and 2D
PDFs for stratiform–convective discrimination, which range                4     Results
between 2 % and 7 % for the training data set and between
3 % and 15 % for the test data set.                                       After the successful development and evaluation of the clas-
   It was shown that the algorithm performance could be im-               sification algorithms, both methods (3D-PDF and ANN)
proved by adding more variables. However, the number of                   were applied to two case studies. The first one was a rainy
independent variables only obtained by MRR is limited. Z                  night on 26 May 2013 (Fig. 7a–g). Figure 7e shows the time–
calculation is based on the drop number concentration. Other              height display of the radar reflectivity factor. The day began
MRR variables such as rain rate or liquid water content are               with rain from 00:00 to 02:30 UTC. The rain fell homoge-
also based on drop number concentration and are hence not                 neously with only small variations in Zmax (a), vD,max (b)

Atmos. Meas. Tech., 14, 4565–4574, 2021                                                    https://doi.org/10.5194/amt-14-4565-2021
A. Foth et al.: Evaluation of precipitation classification algorithms 4571
completely misclassified cases and only a few percent of er-
roneously inconclusive cases. Here the averaged convection
scores are roughly 6, that is, on the lower edge of the convec-
tive classification and close to the transition of convection
scores of less than 5.5 that are stated as inconclusive; 85.8 %
and 98.1 % (ANN and PDF) of the true convective cases are
correctly classified as convective.
However, the most critical point is the classification of
the true inconclusive cases (Fig. 8b). Only 71 % and 35.8 %
(ANN and PDF) are correctly classified. That means that
nearly 30 % of ANN-based profiles and nearly 65 % of PDF-
based profiles of all true inconclusive cases are classified as
stratiform or convective. The ANN performs better here. This
is caused by the strict convection score discrimination which
was stated as truth. In fact, these inconclusive cases might
be classified as stratiform or convective, but the thresholds
were chosen very strictly to confidently separate two classes
Figure 6. Diagram of the neural network with an input layer con- which are mainly free of misclassified rain events. The av-
sisting of three nodes (green) according to the three MRR-based
eraged convection score of the false stratiform inconclusive
variables, two hidden layers with six nodes each (blue) and the out-
cases (ANN) amounts to 3.6, and that of the false convective
put layer with one node (red).
inconclusive cases amounts to 5 (Fig. 8b). The erroneously
stratiform and convective classified inconclusive cases of the
PDF method (25.9 % and 38.3 %) have averaged convection
and σ vD,max (c). The calculated convection score (d) was score values of 3.6 (stratiform) and 4.9 (convective). Appar-
very low, which means that these rain events were stated as ently, these cases would be correctly classified in case of less
being stratiform. For this springtime rain event, the PDF (f) strict convection score thresholds than currently used (3 and
and ANN (g) methods produce very similar results, and both 5.5; see Fig. 2). It is expected to improve the ANN and PDF
agree with the true class given by the convection score. performances by gathering more data for algorithm training.
The right panel of Fig. 7 shows the same quantities as in It has to be considered that the total amount of data is dif-
the left panel but for 23 July 2013. This case indicates con- ferent for both methods. This is due to the fact that some
vective rain falling between 15:00 and 16:00 UTC. Zmax (h), combinations of the three input variables do not appear
vD,max (i) and σ vD,max (j) and the calculated convection score within the training data, causing gaps in the 3D PDF. Those
are characterized by high values representing convective rain. combinations cannot be classified, but the number is less than
Figure 7l shows the radar reflectivity factor of the shower. 0.2 % for the 2014 test data set.
The PDF and ANN methods are in very good agreement
and classify each profile as convective in conformity with
the convection score (truth). 5 Conclusions and outlook
The performance of both algorithms over a whole year
(test data year 2014) is illustrated in Fig. 8. It shows the rela- In order to improve microphysical parameterizations within
tive frequency of occurrence of precipitation profiles that are small-scale models, one has to deal with large data sets. The
defined by the convection score (truth) as stratiform (a), in- presented rain-type classification methods based on PDF and
conclusive (b), or convective (c). For the PDF method cases ANN algorithms are suited to processing micro rain radar
are stated as stratiform when the f value is lower than −0.9, data from long time series. The effort of creating a robust
inconclusive when f is between −0.9 and 0.9, and convec- training data set without unphysical data between both meth-
tive when f is larger than 0.9. For the stratiform cases the ods is similar, and the application of both methods is straight-
PDF and ANN methods classify most stratiform cases as forward. The main advantage of the ANN in contrast to the
stratiform (84.7 % and 96.1 % for ANN and PDF, respec- PDF method is that the ANN method was trained to directly
tively; see Fig. 8a). Only 15.3 % and 3.9 %, respectively, classify inconclusive profiles, which leads to a lower number
are erroneously classified as inconclusive. These are cases of false classified profiles.
with higher convection scores with averaged values around In a next step, evaporative cooling rates will be estimated
roughly 2.5, which is closer to the transition of convection for convective rain events to parameterize the cooling by
scores larger than 3 that are stated as inconclusive. As ex- means of temperature, relative humidity and rain droplet
pected, neither ANN nor PDF misclassified true stratiform number concentration. Application of the algorithms to
cases as convective. The performance of the classification of different ground-based remote-sensing sites that have long-
true convective cases (c) is very similar. There are almost no term MRR observations to create stratiform-vs.-convective
https://doi.org/10.5194/amt-14-4565-2021 Atmos. Meas. Tech., 14, 4565–4574, 20214572 A. Foth et al.: Evaluation of precipitation classification algorithms
Figure 7. Discrimination indices: Zmax (a, h), vD,max (b, i), σ vD,max (c, j) and the convection score indicating the true rain type (d, k). MRR
reflectivity (e, l) and the rain classification based on the PDF method given by the confidence function (f, m) and based on the ANN (g, n).
The data points in the time series are colored according to the convection criteria of whether the values indicate stratiform or convective rain.
Panels (a)–(g) refer to the case study of 26 May 2013, and panels (h)–(n) show 23 July 2013.
Figure 8. Relative frequency of occurrences of the stratiform, inconclusive and convective rain classifications for both the ANN (light pink)
and PDF (grey) methods separated by the true class (a, b, c) based on the test data 2014. The true class is defined by the strict convection
score discrimination. The colored numbers denote the sample size. The numbers on top of each bar indicate the actual value.
rain event climatologies is also planned. At present, the new Code availability. The open-source machine-learning library for
MRR of the University of Leipzig (https://www.physgeo. research and production TensorFlow used for this publication
uni-leipzig.de/en/institut-fuer-meteorologie/forschung/ is available at https://www.tensorflow.org/ (Abadi et al., 2015;
workinggroupremotesensingandarcticclimatesystem/?lang= https://doi.org/10.5281/zenodo.4758419, TensorFlow Developers,
en&content=ql, last access: 10 June 2021) is running 24/7. 2021).
In the near future, the classification algorithms will be ap-
plied operationally and will be improved with continuously
Data availability. Data were provided by the Cloud and Precip-
gathered data.
itation Exploration Laboratory (CPEX-LAB, http://cpex-lab.de,
last access: 18 June 2021), a competence centre within the
Geoverbund ABC/J, and are freely available on request from
Atmos. Meas. Tech., 14, 4565–4574, 2021 https://doi.org/10.5194/amt-14-4565-2021A. Foth et al.: Evaluation of precipitation classification algorithms 4573
http://cpex-lab.de/cpex-lab/EN/Home/JOYCE-CF/JOYCE-CF_ Caracciolo, C., Prodi, F., Battaglia, A., and Porcu’, F.: Anal-
node.html (CPEX-LAB, 2021). ysis of the moments and parameters of a gamma DSD
to infer precipitation properties: A convective strati-
form discrimination algorithm, Atmos. Res., 80, 165–186,
Author contributions. AF prepared the manuscript in close collabo- https://doi.org/10.1016/j.atmosres.2005.07.003, 2006.
ration with HKl. AF performed the investigations and data analyses. Cloud and Precipitation Exploration Laboratory (CPEX-LAB):
JZ and FL contributed with their knowledge about basic meteorol- JOYCE-CF, available at: http://cpex-lab.de/cpex-lab/EN/Home/
ogy and convective indices. JZ also contributed with his experience JOYCE-CF/JOYCE-CF_node.html, last access: 18 June 2021.
in radar data analysis. The conceptualization was initialized by AF. Deng, M., Kollias, P., Feng, Z., Zhang, C., Long, C. N., Kalesse,
All the authors contributed to the scientific discussions. H., Chandra, A., Kumar, V. V., and Protat, A.: Stratiform and
Convective Precipitation Observed by Multiple Radars during
the DYNAMO/AMIE Experiment, J. Appl. Meteorol. Clim., 53,
Competing interests. The authors declare that they have no conflict 2503–2523, https://doi.org/10.1175/JAMC-D-13-0311.1, 2014.
of interest. Geerts, B. and Dawei, Y.: Classification and Characterization of
Tropical Precipitation Based on High-Resolution Airborne Ver-
tical Incidence Radar. Part I: Classification, J. Appl. Meteorol.,
43, 1554–1566, https://doi.org/10.1175/JAM2158.1, 2004.
Special issue statement. This article is part of the special issue
Ghada, W., Estrella, N., and Menzel, A.: Machine learn-
“Tropospheric profiling (ISTP11) (AMT/ACP inter-journal SI)”. It
ing approach to classify rain type based on Thies dis-
is a result of the 11th edition of the International Symposium on
drometers and cloud observations, Atmosphere, 10, 251,
Tropospheric Profiling (ISTP), Toulouse, France, 20–24 May 2019.
https://doi.org/10.3390/atmos10050251, 2019.
Houze Jr., R. A.: Cloud dynamics, 2nd edn., Academic press, Hei-
delberg, Germany, 2014.
Acknowledgements. The authors thank the JOYCE team for per- Jergensen, G. E., McGovern, A., Lagerquist, R., and Smith,
forming the MRR observations and providing the MRR data. T.: Classifying Convective Storms Using Machine Learning,
Weather Forecast., 35, 537–559, https://doi.org/10.1175/WAF-
D-19-0170.1, 2020.
Financial support. This research has been supported by the Kingma, D. P. and Ba, J.: Adam: A Method for Stochastic Optimiza-
German Science Foundation (DFG) (grant nos. FO 1285/2-1, tion, arXiv [preprint], arXiv:1412.6980, 22 December 2014.
KA 4162/2-1, WE 1900/33-1, and LO 901/7-1) and the Federal Kunz, M.: The skill of convective parameters and indices to predict
Ministry of Education and Research in Germany (BMBF) (grant isolated and severe thunderstorms, Nat. Hazards Earth Syst. Sci.,
nos. FKZ: 01LK1504C and 01LK1502N). 7, 327–342, https://doi.org/10.5194/nhess-7-327-2007, 2007.
Lazri, M. and Ameur, S.: Combination of support vector ma-
chine, artificial neural network and random forest for improv-
Review statement. This paper was edited by V. Chandrasekar and ing the classification of convective and stratiform rain using
reviewed by three anonymous referees. spectral features of SEVIRI data, Atmos. Res., 203, 118–129,
https://doi.org/10.1016/j.atmosres.2017.12.006, 2018.
Liu, Z., Vaughan, M. A., Winker, D. M., Hostetler, C. A., Poole,
L. R., Hlavka, D., Hart, W., and McGill, M.: Use of probabil-
ity distribution functions for discriminating between cloud and
References aerosol in lidar backscatter data, J. Geophys. Res.-Atmos., 109,
D15202, https://doi.org/10.1029/2004JD004732, 2004.
Abadi, M., Agarwal, A., Barham, P., Brevdo, E., Chen, Z., Citro, Liu, Z., Vaughan, M., Winker, D., Kittaka, C., Getzewich,
C., Corrado, G. S., Davis, A., Dean, J., Devin, M., Ghemawat, S., B., Kuehn, R., Omar, A., Powell, K., Trepte, C., and
Goodfellow, I., Harp, A., Irving, G., Isard, M., Jia, Y., Jozefow- Hostetler, C.: The CALIPSO Lidar Cloud and Aerosol Dis-
icz, R., Kaiser, L., Kudlur, M., Levenberg, J., Mané, D., Monga, crimination: Version 2 Algorithm and Initial Assessment
R., Moore, S., Murray, D., Olah, C., Schuster, M., Shlens, J., of Performance, J. Atmos. Ocean. Tech., 26, 1198–1213,
Steiner, B., Sutskever, I., Talwar, K., Tucker, P., Vanhoucke, https://doi.org/10.1175/2009JTECHA1229.1, 2009.
V., Vasudevan, V., Viégas, F., Vinyals, O., Warden, P., Watten- Löhnert, U., Schween, J. H., Acquistapace, C., Ebell, K., Maahn,
berg, M., Wicke, M., Yu, Y., and Zheng, X.: TensorFlow: Large- M., Barrera-Verdejo, M., Hirsikko, A., Bohn, B., Knaps, A.,
Scale Machine Learning on Heterogeneous Systems, available O’Connor, E., Simmer, C., Wahner, A., and Crewell, S.: JOYCE:
at: https://www.tensorflow.org/ (last access: 1 December 2020), Jülich Observatory for Cloud Evolution, B. Am. Meteorol. Soc.,
2015. 96, 1157–1174, https://doi.org/10.1175/BAMS-D-14-00105.1,
Andersson, T., Andersson, M., Jacobsson, C., and Nilsson, S.: Ther- 2015.
modynamic indexes for forecasting thunderstorms in southern Maahn, M. and Kollias, P.: Improved Micro Rain Radar snow mea-
sweden, Meteorol. Mag., 118, 141–146, 1989. surements using Doppler spectra post-processing, Atmos. Meas.
Bacmeister, J. T., Suarez, M. J., and Robertson, F. R.: Rain Reevap- Tech., 5, 2661–2673, https://doi.org/10.5194/amt-5-2661-2012,
oration, Boundary Layer–Convection Interactions, and Pacific 2012.
Rainfall Patterns in an AGCM, J. Atmos. Sci., 63, 3383–3403,
https://doi.org/10.1175/JAS3791.1, 2006.
https://doi.org/10.5194/amt-14-4565-2021 Atmos. Meas. Tech., 14, 4565–4574, 20214574 A. Foth et al.: Evaluation of precipitation classification algorithms Morrison, H., Tessendorf, S. A., Ikeda, K., and Thompson, G.: Sen- Tokay, A. and Short, D. A.: Evidence from Tropi- sitivity of a Simulated Midlatitude Squall Line to Parameteriza- cal Raindrop Spectra of the Origin of Rain from tion of Raindrop Breakup, Mon. Weather Rev., 140, 2437–2460, Stratiform versus Convective Clouds, J. Appl. Me- https://doi.org/10.1175/MWR-D-11-00283.1, 2012. teorol., 35, 355–371, https://doi.org/10.1175/1520- Niu, S., Jia, X., Sang, J., Liu, X., Lu, C., and Liu, Y.: Distributions of 0450(1996)0352.0.CO;2, 1996. Raindrop Sizes and Fall Velocities in a Semiarid Plateau Climate: Tokay, A., Short, D. A., Williams, C. R., Ecklund, W. L., Convective versus Stratiform Rains, J. Appl. Meteorol. Clim., 49, and Gage, K. S.: Tropical Rainfall Associated with 632–645, https://doi.org/10.1175/2009JAMC2208.1, 2010. Convective and Stratiform Clouds: Intercomparison Pattnaik, S. and Krishnamurti, T. N.: Impact of cloud mi- of Disdrometer and Profiler Measurements, J. Appl. crophysical processes on hurricane intensity, part 2: Sen- Meteorol., 38, 302–320, https://doi.org/10.1175/1520- sitivity experiments, Meteorol. Atmos. Phys., 97, 127–147, 0450(1999)0382.0.CO;2, 1999. https://doi.org/10.1007/s00703-006-0248-x, 2007. Williams, C. R., Ecklund, W. L., and Gage, K. S.: Peters, G., Fischer, B., and Anderson, T.: Rain observations with Classification of Precipitating Clouds in the Trop- a vertically looking Micro Rain Radar (MRR), Boreal Environ. ics Using 915-MHz Wind Profilers, J. Atmos. Ocean. Res., 7, 353–362, 2002. Technol., 12, 996–1012, https://doi.org/10.1175/1520- Peters, G., Fischer, B., Münster, H., Clemens, M., and Wag- 0426(1995)0122.0.CO;2, 1995. ner, A.: Profiles of Raindrop Size Distributions as Retrieved Winker, D. M., Vaughan, M. A., Omar, A., Hu, Y., Pow- by Microrain Radars, J. Appl. Meteorol., 44, 1930–1949, ell, K. A., Liu, Z., Hunt, W. H., and Young, S. A.: https://doi.org/10.1175/JAM2316.1, 2005. Overview of the CALIPSO Mission and CALIOP Data Pro- Rosenfeld, D., Amitai, E., and Wolff, D. B.: Improved Accuracy cessing Algorithms, J. Atmos. Ocean. Tech., 26, 2310–2323, of Radar WPMM Estimated Rainfall upon Application of Ob- https://doi.org/10.1175/2009JTECHA1281.1, 2009. jective Classification Criteria, J. Appl. Meteorol., 34, 212–223, Worden, J., Noone, D., Bowman, K., Beer, R., Eldering, A., https://doi.org/10.1175/1520-0450-34.1.212, 1995. Fisher, B., Gunson, M., Goldman, A., Herman, R., Kulawik, Rotstayn, L. D.: A physically based scheme for the treat- S. S., Lampel, M., Osterman, G., Rinsland, C., Rodgers, ment of stratiform clouds and precipitation in large-scale C., Sander, S., Shephard, M., Webster, C. R., and Wor- models. I: Description and evaluation of the microphysi- den, H.: Importance of rain evaporation and continental con- cal processes, Q. J. Roy. Meteor. Soc., 123, 1227–1282, vection in the tropical water cycle, Nature, 445, 528–532, https://doi.org/10.1002/qj.49712354106, 1997. https://doi.org/10.1038/nature05508, 2007. Schlemmer, L. and Hohenegger, C.: The Formation of Wider and Yang, Y., Chen, X., and Qi, Y.: Classification of convec- Deeper Clouds as a Result of Cold-Pool Dynamics, J. Atmos. tive/stratiform echoes in radar reflectivity observations using a Sci., 71, 2842–2858, https://doi.org/10.1175/JAS-D-13-0170.1, fuzzy logic algorithm, J. Geophys. Res.-Atmos., 118, 1896– 2014. 1905, https://doi.org/10.1002/jgrd.50214, 2013. TensorFlow Developers: TensorFlow (Version v2.5.0), Zenodo Yang, Z., Liu, P., and Yang, Y.: Convective/Stratiform Precipitation [code], https://doi.org/10.5281/zenodo.4758419, 2021. Classification Using Ground-Based Doppler Radar Data Based Thompson, E. J., Rutledge, S. A., Dolan, B., and Thurai, on the K-Nearest Neighbor Algorithm, Remote Sens., 11, 2277, M.: Drop Size Distributions and Radar Observations of https://doi.org/10.3390/rs11192277, 2019. Convective and Stratiform Rain over the Equatorial Indian and West Pacific Oceans, J. Atmos. Sci., 72, 4091–4125, https://doi.org/10.1175/JAS-D-14-0206.1, 2015. Atmos. Meas. Tech., 14, 4565–4574, 2021 https://doi.org/10.5194/amt-14-4565-2021
You can also read