Evaluation of Nearshore QuikSCAT 4.1 and ERA-5 Wind Stress and Wind Stress Curl Fields over Eastern Boundary Currents

Page created by Darrell Sparks
 
CONTINUE READING
Evaluation of Nearshore QuikSCAT 4.1 and ERA-5 Wind Stress and Wind Stress Curl Fields over Eastern Boundary Currents
remote sensing
Article
Evaluation of Nearshore QuikSCAT 4.1 and ERA-5 Wind Stress
and Wind Stress Curl Fields over Eastern Boundary Currents
P. Ted Strub *           and Corinne James

                                          College of Earth, Ocean, and Atmospheric Sciences, Oregon State University, 104 CEOAS Administration
                                          Building, Corvallis, OR 97331-5503, USA; corinne.james@oregonstate.edu
                                          * Correspondence: ted.strub@oregonstate.edu

                                          Abstract: Fields of coastal wind stress and wind stress curl in the 10–100 km next to the land control
                                          the processes of upwelling and downwelling of nutrients and water properties that are vital to highly
                                          productive coastal marine ecosystems. Here we ask the question: Do the present surface wind stress
                                          products from a satellite-borne scatterometer (QuikSCAT) and an atmospheric reanalysis model
                                          (ERA-5) systematically overestimate the magnitude of wind speed and stress in the 10–50 km next
                                          to the coast? We compare QuikSCAT wind speed retrievals to the relatively unused wind speed
                                          retrievals from satellite altimeters, which are able to approach closer to the coast than scatterometers
                                          without land reflections, due to their smaller radar footprints. Altimeter data on tracks approaching
                                          and crossing the coast indicate that the increases in coastal QuikSCAT wind speed values and ERA-5
                                          coastal wind stress values are unrealistic. For analyses of wind speed and stress requiring high
                                          accuracy, especially those involving wind stress curl, we suggest considering individual Level 2B
                                          scatterometer wind retrievals as suspect at distances of 10 km and less from the coast, along with use
                                          of the Poor Coastal Processing flag. We found that similar increases in wind stress values next to the
Citation: Strub, P.T.; James, C.
                                          coast in gridded ERA-5 fields are not due to errors in the model physics or wind speeds. They are
Evaluation of Nearshore QuikSCAT
                                          created during the interpolation of wind stress from the original model grid to a regular rectangular
4.1 and ERA-5 Wind Stress and Wind
Stress Curl Fields over Eastern
                                          grid. We recommend that researchers who are analyzing wind stress and wind stress curl should
Boundary Currents. Remote Sens.           calculate wind stress themselves from the gridded ERA-5 vector wind speed fields, rather than using
2022, 14, 2251. https://doi.org/          the interpolated model wind stress or curl fields.
10.3390/rs14092251
                                          Keywords: coastal winds; scatterometry; reanalysis surface winds; wind stress curl
Academic Editors: Bryan Stiles,
Svetla Hristova-Veleva, Lucrezia
Ricciardulli, Larry O’Neill,
Zorana Jelenak and Joe Sapp
                                          1. Introduction
Received: 31 March 2022                   1.1. Motivation and Questions Asked
Accepted: 5 May 2022
                                               Although scatterometers and atmospheric circulation models have improved our
Published: 7 May 2022
                                          understanding of the spatial variability in surface winds over the open ocean, the deter-
Publisher’s Note: MDPI stays neutral      mination of high-resolution spatial variability in the wind fields within several tens of
with regard to jurisdictional claims in   kilometers of land is still problematic. This affects studies of the wind stress and wind
published maps and institutional affil-   stress curl over narrow continental shelves, such as those found in eastern boundary up-
iations.                                  welling systems. Here, we evaluate wind speed and wind stress in two such systems—the
                                          Benguela Current System (BCS) along the southwest coast of Africa and the California
                                          Current System (CCS) next to the U.S. West Coast. The wind data sets came from both a
                                          well-described scatterometer (QuikSCAT) and a much-used global atmospheric reanalysis
Copyright: © 2022 by the authors.
                                          product (ERA-5).
Licensee MDPI, Basel, Switzerland.
                                               Our initial motivation for this evaluation came from the appearance of unexpected
This article is an open access article
distributed under the terms and
                                          results in the seasonally changing fields of wind stress and wind stress curl next to the coast
conditions of the Creative Commons
                                          in these two upwelling systems. Both systems are the sites of economically and ecologically
Attribution (CC BY) license (https://     important marine ecosystems, which respond to climatic changes in the surface forcing by
creativecommons.org/licenses/by/          winds [1,2]. Upwelling brings to the surface an increase in nutrients and other changes
4.0/).                                    in water properies, including hypoxic and acidic conditions. Causes of upwelling within

Remote Sens. 2022, 14, 2251. https://doi.org/10.3390/rs14092251                                      https://www.mdpi.com/journal/remotesensing
Evaluation of Nearshore QuikSCAT 4.1 and ERA-5 Wind Stress and Wind Stress Curl Fields over Eastern Boundary Currents
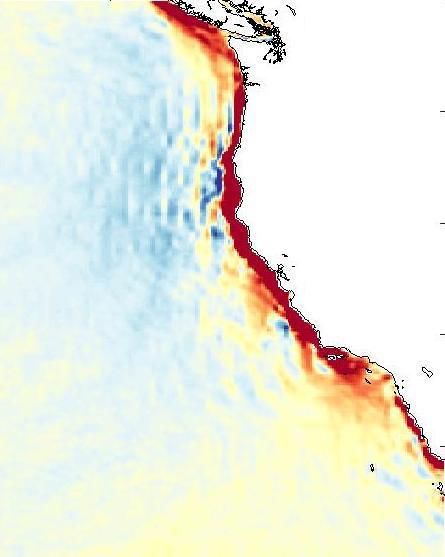
Remote Sens. 2022, 14, 2251                                                                                             2 of 26

                              the water column include both alongshore wind stress and the curl of the wind stress.
                              Equatorward alongshore wind stress adjacent to the coast causes the Ekman transport of
                              mass in the surface away from the coast, which is replaced by upwelled water next to the
                              coast. This upwelling is usually assumed to be distributed over a narrow coastal band,
                              with estimates of 5–30 km width [3,4]. At the same time, the greater roughness and friction
                              of the land, compared to the water, slows the wind as land is approached, creating a wider
                              band of wind stress curl (positive in the northern hemisphere and negative in the southern
                              hemisphere for equatorward winds blowing along the west coast of a continent). This
                              curl results in divergence of the surface Ekman transports, again resulting in upwelling
                              to provide the vertical convergence to balance the surface horizontal divergence. Coastal
                              upwelling caused by the alongshore wind stress is an order of magnitude greater than
                              that caused by the wind stress curl, but the curl acts over a region that may be an order of
                              magnitude greater in area than the band of coastal upwelling (as seen in the figures below),
                              making the net effects of both types of upwelling comparable. To evaluate the relative
                              magnitude of each type of forcing, accurate estimates of the wind stress and wind stress
                              curl are needed in the 10–100 km next to the coast (see [5] for further descriptions of the
                              importance of wind forcing in coastal regions).
                                   In the mid- and lower-latitude regions of the two eastern boundary current systems
                              studied here (BCS and CCS), monthly averages of the wind stress are persistently upwelling-
                              favorable (equatorward) year-round, strongest in summer. Winds in the higher-latitude
                              regions of each system are upwelling-favorable in summer and downwelling-favorable
                              (poleward) in winter. The results of the initial gridding of winds around Southern Africa
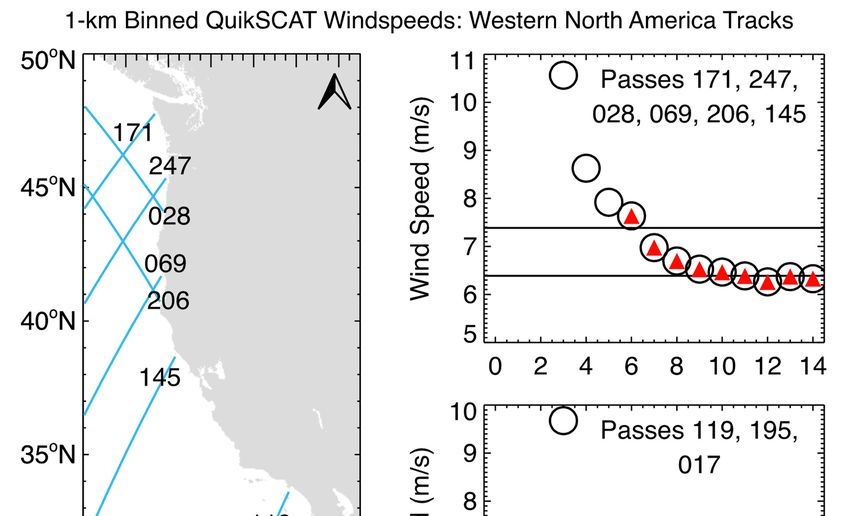
                              and the U.S. West Coast (USWC) are shown in Figure 1, where wind stress vectors from
                              QuikSCAT (QS, subset to every 0.4◦ ) and ERA-5 (subset to every 0.5◦ ) are overlayed on
                              color displays for the curl of the wind stress (showing all 0.1◦ and 0.25◦ gridded data
                              points). The 10-year averages are presented for summer months (January and July for the
                              southern and northern hemispheres, respectively), during which the direction of the wind
                              stress is equatorward almost everywhere. The decreases in wind speed and wind stress
                              in the 100–200 km bands next to the coast create bands of negative (positive) wind stress
                              curl along the coasts of the BCS and CCS, respectively. However, also evident are narrow
                              regions (1–2 grid points) of wind stress curl with opposite signs immediately adjacent to
                              the coast, narrower for the QS data than the ERA-5 data, due to the size of the grid spacing.
                              This indicates an unexpected increase in wind speed as land is approached. Although
                              more prevalent in summer, these anomalous curl values next to the coast can be found
                              during all seasons. As described below, overestimates of scatterometer wind speed near
                              the coast can be caused by uncorrected reflections of the radar signal from land. For the
                              ERA-5 fields, errors in coastal winds could indicate errors in the physics of air–sea and
                              air–land interactions, decreases in the Marine Boundary Layer heights near the coast, etc.
                              The unexpected increase in wind speed next to the coast in both of these products motivates
                              the detailed evaluations presented in this paper.
                                   The questions we ask are:
                              (1)   Do actual wind speeds generally increase as land is approached within 10–50 km of
                                    the coast in the two regions examined here?
                              (2)   If the increase in wind speeds near the coast in the scatterometer data is an artifact, at
                                    what distance from the coast should we consider the data suspect?
                              (3)   If the scatterometer wind speeds are in error, can we identify the cause of the error?
                              (4)   If the increase in the wind stress values near the coast in the ERA-5 data is an artifact,
                                    what causes it and can we find a procedure to avoid it?
Remote Sens. 2022, 14, x FOR PEER REVIEW          3 of 26

Remote Sens. 2022, 14, 2251                        3 of 26

                                 Figure 1. Cont.
Remote
Remote   Sens.
       Sens.   2022,
             2022, 14,14, x FOR PEER REVIEW
                       2251                                                                                                                                                                                                4 4of of
                                                                                                                                                                                                                                 26 26

                                            1. (Previous   page)  10-year   averages  (11/1999-11/2009)                                                                  ◦ ) overlaid on wind stress curl (full 0.1◦ grid) for
                                  Figure
                                     Figure    1. (Previous   page)  10-year  averages   (11/1999-11/2009)ofofQuikSCAT
                                                                                                                 QuikSCAT  v4.1 wind
                                                                                                                             v4.1  wind stress vectors
                                                                                                                                          stress       (subset
                                                                                                                                                 vectors  (subsetto to
                                                                                                                                                                     0.40.4°)  overlaid on wind stress curl (full 0.1° grid) for
                                  summer      along   thethe
                                                          coasts  of of
                                                                     (a)(a)
                                                                         southern  Africa  and  (b)(b)
                                                                                                    western    North America.    AllAll
                                                                                                                                     L2B   retrievals areare
                                                                                                                                                           used   to to
                                                                                                                                                                     create    thethe  ◦ gridded values. (This page) 10-year
                                                                                                                                                                                    0.10.1°
                                     summer      along       coasts         southern   Africa and       western  North  America.         L2B  retrievals      used       create             gridded values. (This page) 10-year
                                  averages     (QuikSCAT     period)   of of
                                                                          ERA-5  reanalysis   wind  stress  vectors (subset  to to ◦
                                                                                                                                0.50.5°)
                                                                                                                                     ) overlaid  ononwind   stress  curl   (full 0.25 ◦ grid) forfor
                                                                                                                                                                                                  summer    along  thethe
                                                                                                                                                                                                                        coasts  of of
                                     averages     (QuikSCAT     period)      ERA-5   reanalysis  wind   stress vectors (subset            overlaid     wind    stress  curl   (full 0.25° grid)      summer    along      coasts
                                  (c)(c)
                                      southern
                                          southern Africa  andand
                                                      Africa   (d)(d)
                                                                    western  North
                                                                       western  NorthAmerica.  From
                                                                                        America.   Fromthe the
                                                                                                           interpolated
                                                                                                               interpolated  ◦ ERA-5
                                                                                                                         0.250.25° ERA-5wind   stress
                                                                                                                                             wind     grid.grid.
                                                                                                                                                   stress    The The
                                                                                                                                                                  insets    show
                                                                                                                                                                        insets     expanded
                                                                                                                                                                                 show          views
                                                                                                                                                                                        expanded      of the
                                                                                                                                                                                                    views  ofreversal  in sign
                                                                                                                                                                                                              the reversal   in of
                                                                                                                                                                                                                                sign
                                  theofwind
                                         the wind
                                               stressstress curl to
                                                       curl next next
                                                                    thetocoast.
                                                                          the coast.
Remote Sens. 2022, 14, 2251                                                                                            5 of 26

                              1.2. Previous Work
                                    The improved retrieval of QuikSCAT vector wind speeds in coastal regions (ver-
                              sion 4.1) is described in detail by [5]. Each location on Earth’s surface within the continuous
                              swath mapped by QuikSCAT’s rotating antennas was sampled from several angles as the
                              satellite moved along its orbit, and the returned power of the radar was estimated in the
                              form of a sigma-0 parameter for each look angle. From the muliple values of sigma-0,
                              the surface vector wind was estimated. The nominal radar footprints were ovals with
                              major/minor axes of approximately 35 km and 25 km, respectively. The returned power
                              within each oval was further divided into 8 km by 25 km “slices.” When the slices are
                              oriented parallel to the coast, they may sample within several kilometers of land. For
                              each returned slice of radar power, a previous methodology (version 3.1) used the known
                              and more complicated radar surface footprint pattern to calculate the fractional coverage
                              of the footprint over land (version 3.1 is also called the Land Contribution Ratio, LCR).
                              Observations were rejected if too much land (typically >1%) was found within the footprint.
                              Improving on this in version 4.0, the known albedo of the land was combined with the
                              LCR to estimate the portion of returned power for each slice that was coming from land to
                              the scatterometer. If this “expected contribution to sigma-0 from land” (ES) was greater
                              than 0.4%, the observation was rejected. Otherwise, the returned power was subtracted to
                              form a modified (LCRES) value of sigma-0, which was used with the other observations
                              of sigma-0 at the same location to form the estimate of vector wind speed. This increased
                              the number of retrieved wind estimates within 20 km of land by more than an order of
                              magnitude [5]. The retrieved vectors were used to form an “irregular” grid of vector winds
                              within each swath with a grid spacing of ~12.5 km (the grid points change from swath to
                              swath). These are the basic Level 2B LCRES vector wind data, version 4.0. The increased
                              proximity to land allows for the analysis of winds in large lakes and semi-enclosed regions
                              of the ocean, such as the Inland Sea along southern Chile [5,6].
                                    An additional evaluation of remaining errors due to land was added in version 4.1
                              in the form of a “Poor Coastal Processing” (PCP) flag. Comparisons of the difference
                              between wind speed magnitudes from LCRES retrievals and collocated meteorological
                              buoy wind speeds indicate that the differences are large when the distance to land is 5 km
                              or less [5]. Thus, the PCP flag was set for (1) observations within 5 km of land. It was also
                              set for (2) observations that occur when the “pitch” of the satellite is too great. Finally,
                              the differences between each LCRES observation wind speed and the nearest neighbor
                              observations farther offshore were used to flag (3) regions with persistent errors, and these
                              were included in the PCP flags [5]. Below, we show the results obtained both with and
                              without the use of the PCP flags.
                                    In [5], meteorological buoy wind speeds within 100 km of land were used to quantify
                              the differences between scatterometer and buoy estimates of wind speeds, as a function of
                              distance to the coast. Here, we employed the relatively rare use of wind speeds derived from
                              alongtrack altimeter sigma-0 values as they approach and cross the land. This methodology
                              was used by [3] along the Chilean coast (another region of persistent upwelling) to show
                              that there was an average decrease in the wind speed as land is approached. In [3],
                              results of the less accurate altimeter retrieval algorithms were corrected by using collocated
                              scatterometer retrievals over open water. Here, we did not quantify the difference between
                              the scatterometer and altimeter wind speed estimates. We only used the altimeter to verify
                              that wind speeds decreased as land was approached in our two systems, as found by [3]
                              off Chile.

                              2. Materials and Methods
                                   We used the Jet Propulsion Laboratory’s (JPL’s) version 4.1 of the ten-year (1999–2009)
                              QuikSCAT Level 2B (L2B) swaths of vector wind retrievals (see “Data Availability State-
                              ment” below). Wind stress was calculated from the scatterometer ten-meter equivalent
                              wind speed using a drag coefficient that depends only on wind speed [7]. In order to
                              resolve the wind stress and wind stress curl as close to land as possible, our initial analyses
Remote Sens. 2022, 14, 2251                                                                                            6 of 26

                              (Figure 1) did not exclude the retrieved winds that were flagged as uncertain by the PCP
                              flag, although figures showing our detailed (1-km) analyses (below) used color coding to
                              identify the observations that would have been eliminated by the PCP flag. Ignoring this
                              flag is approximately equivalent to using version 4.0 of the data set for oceanic applications.
                              To create gridded fields of wind stress and wind stress curl for our research projects, our
                              processing consisted of: (1) applying a minimum of QC criteria to the raw vector wind
                              retrievals in each Level 2B swath to remove extreme values; (2) calculating vector wind
                              stress from the remaining vector wind retrievals; and (3) interpolating vector wind stress
                              retrievals from each swath’s variable grid (with ~12.5 km grid spacing) to a common grid
                              with 0.1◦ spacing. The interpolation used retrieved winds within 40 km of each grid point
                              to estimate a polynomial surface, which provides estimates of both the wind stress and the
                              gradients of the wind stress at each grid point, from which the curl of the wind stress was
                              calculated. If there were not 10 values of L2B vector wind retrievals within the 40 km radius,
                              data at the grid point were treated as missing. The regridding method was similar to that
                              used by JPL to produce gridded Level 3 fields, although we required fewer observations in
                              our 40 km radius than required by JPL. The re-gridded swath data were averaged to form
                              individual monthly means, long-term (10-year) climatological monthly mean fields and a
                              long-term annual mean. While gridding the data, as described above, the PCP flag may
                              or may not be used to eliminate the L2B retrievals. Figure 1 presents the fields gridded by
                              ignoring the PCP flags.
                                    Rather than using the gridded data, most of the results presented below used several
                              forms of binning of the individual L2B retrievals to investigate whether they showed
                              evidence of increased wind speed as land was approached. In some cases, they were
                              “binned” into 7 km by 13 km rectangular regions—averaging all retrievals that fall within
                              a region. To compare scatterometer averages of wind speeds to altimeter wind speed
                              retrievals, rectangular areas were arranged along altimeter tracks that cross land in the
                              two eastern boundary upwelling systems. Figure 2 presents an example of the boxes along
                              altimeter Track/Pass 031 off South Africa. (Note: The continuous altimeter track is formally
                              divided into numbered “passes” that cross the coast at different locations. We informally
                              refer to these interchangeably as both Track XX and Pass XX, since, from a regional point of
                              view, each Pass is a separate Track). The data were averaged in bins set by the along-track
                              distance to the altimeter track’s land crossing. Following the same tracks, altimeter and
                              scatteromater retrievals were also binned according to the actual distance to the nearest
                              land. For the scatterometer, this produces irregularly shaped regions of points, located
                              within 6.5 km on either side of the altimeter track and within the specified ranges of distance
                              from the nearest land (see figures below).
                                    ERA-5 daily reanalysis wind stress data have been retrieved from the Copernicus
                              web site (https://cds.climate.copernicus.eu/, accessed on 30 June 2021) for the period
                              1979–2020. Although the original model fields were calculated on a reduced Gaussian grid
                              (RGG), data provided by the Copernicus Climate Data Store (CDS) web interface were
                              interpolated by the Copernicus system to a rectangular latitude-longitude grid with regular
                              0.25◦ spacing. We obtained the 10-m vector wind speed and wind stress on this rectangular
                              grid, calculating wind stress curl from the wind stress values. We also downloaded a short
                              period of data (August–September 2005) on the original RGG grid from the ECMWF web
                              site (https://apps.ecmwf.int/data-catalogues/era5/?class=ea, accessed on 20 June 2021),
                              which we used to evaluate the effect of the gridding on the nearshore values of wind speed
                              and wind stress.
Remote Sens. 2022, 14, x FOR PEER REVIEW                                                                                                      7 of 26
   Remote Sens. 2022, 14, 2251                                                                                                          7 of 26

                                  Figure2.
                                 Figure      Altimeter track
                                          2. Altimeter  track031
                                                               031along
                                                                    alongthethesouthwest
                                                                                 southwestcorner  of South
                                                                                              corner        Africa,
                                                                                                      of South       showing
                                                                                                                 Africa,        the locations
                                                                                                                          showing             of
                                                                                                                                      the locations of
                                  the nominal   grid points that define  the altimeter track (not  data points) and  the coastal  crossing
                                 the nominal grid points that define the altimeter track (not data points) and the coastal crossing        (blue
                                  dots).dots).
                                 (blue   The rectangular   areas within
                                               The rectangular     areas which
                                                                          withinL2B  scatterometer
                                                                                  which             wind speedwind
                                                                                          L2B scatterometer       retrievals
                                                                                                                        speedareretrievals
                                                                                                                                 binned extend
                                                                                                                                           are binned
                                  6.5 km6.5
                                 extend   on either
                                              km onside   of the
                                                      either     track
                                                              side     and track
                                                                    of the   7 km along
                                                                                   and 7the
                                                                                          kmtrack,
                                                                                               alongstarting  7 kmstarting
                                                                                                       the track,   from the7coastal
                                                                                                                                km fromcrossing.
                                                                                                                                           the coastal
                                  The box that
                                 crossing.  Thewould    be touching
                                                 box that   would bethe   coastal crossing
                                                                        touching            is not
                                                                                   the coastal     shown or
                                                                                                crossing      used.
                                                                                                           is not  shown or used.

                                       Wind speed magnitudes (not directions) were available from the reference altimeters,
                                      ERA-5 daily reanalysis wind stress data have been retrieved from the Copernicus
                                  TOPEX/Poseidon (T/P) and Jason-1/2/3. The instantaneous footprints of these altimeters
                                 web
                                  weresite (https://cds.climate.copernicus.eu/,
                                        smaller   than those of the scatterometers, accessed          in 30asJune
                                                                                          characterized         6–7 2021)
                                                                                                                     km byfor     theSince
                                                                                                                              [8,9].   periodthe1979–
                                 2020. Although
                                  altimeter  moves the     original
                                                       ~7 km          modeland
                                                               per second       fields  were1-Hz
                                                                                   we used      calculated
                                                                                                     data, the  onfootprint
                                                                                                                     a reduced       Gaussian
                                                                                                                               represents     an grid
                                 (RGG),
                                  elongated area of approximately 7 km by 14 km. Under extremely high significant wave were
                                          data   provided     by  the   Copernicus      Climate     Data    Store   (CDS)    web     interface
                                 interpolated
                                  conditions, thebyinstantaneous
                                                      the Copernicus      system
                                                                     footprint   mayto reach
                                                                                       a rectangular       latitude-longitude
                                                                                               10 km, creating     a slightly larger  grid  with reg-
                                                                                                                                         oblong
                                 ular 0.25° spacing.
                                  footprint.  In [3], theyWe  obtained
                                                            described      the 10-mofvector
                                                                        a footprint      6.9 kmwind
                                                                                                  by 20speed
                                                                                                          km forandthesewind    stress which
                                                                                                                          altimeters,     on this rec-
                                  seems overly
                                 tangular   grid,large.   Altimeter
                                                    calculating   windretrievals
                                                                           stress are
                                                                                   curlcentered
                                                                                         from the  on wind
                                                                                                       the nadir    points
                                                                                                               stress        of theWe
                                                                                                                        values.       altimeter,
                                                                                                                                          also down-
                                 loaded a short period of data (August–September 2005) on the original RGG griddata
                                  which  fall within   1 km  of the nominal     altimeter   track. We   used    along-track    altimeter     from the
                                  from the  RADS     (Radar  Altimeter   Data   System)   data  set, made     available
                                 ECMWF web site (https://apps.ecmwf.int/data-catalogues/era5/?class=ea, accessed on 20   at the  Delft   Techni-
                                  cal University’s web site (https://rads.tudelft.nl/rads/rads.shtml, accessed on 25 February
                                 June 2021), which we used to evaluate the effect of the gridding on the nearshore values
                                  2021). The relationship between wind speed and returned radar power is opposite for
                                 of wind speed and wind stress.
                                  the nadir altimeter reflections to that for the slanted scatterometer reflections: high
                                      Wind
                                  winds        speed
                                          create       magnitudes
                                                   small  waves that(not     directions)
                                                                        reflect            were available
                                                                                  the scatterometer’s           fromradar
                                                                                                            slanted    the reference
                                                                                                                               beam back   altimeters,
                                                                                                                                               to
                                 TOPEX/Poseidon
                                  the satellite, while(T/P)    and waves
                                                         the same   Jason-1/2/3.
                                                                             scatterThe    instantaneous
                                                                                      the altimeter’s     nadirfootprints
                                                                                                                  radar signal of these    altimeters
                                                                                                                                   away from
                                 were  smaller Land
                                  the satellite.  than also
                                                         thosescatters
                                                                of the the
                                                                        scatterometers,       characterized
                                                                             slanted scatterometer       signal as   6–7tokm
                                                                                                                  back      theby    [8,9]. and
                                                                                                                                 satellite   Since the
                                 altimeter
                                  either absorbs or scatters the altimeter’s nadir beam away from the satellite. Thus, for an
                                            moves      ~7  km   per second     and    we   used   1-Hz    data,   the   footprint     represents
                                  both scatterometers
                                 elongated                and altimeters,7 land
                                              area of approximately           km by contamination
                                                                                       14 km. Under    produces     overestimates
                                                                                                            extremely                  of wind wave
                                                                                                                          high significant
                                  speed. The the
                                 conditions,    magnitude     of the land
                                                    instantaneous           effectsmay
                                                                       footprint     is much
                                                                                          reachgreater
                                                                                                  10 km,for    the scatterometer,
                                                                                                             creating                   since oblong
                                                                                                                        a slightly larger
                                 footprint. In [3], they described a footprint of 6.9 km by 20 km for these altimeters, which
                                 seems overly large. Altimeter retrievals are centered on the nadir points of the altimeter,
                                 which fall within 1 km of the nominal altimeter track. We used along-track altimeter data
                                 from the RADS (Radar Altimeter Data System) data set, made available at the Delft Tech-
                                 nical University’s web site (https://rads.tudelft.nl/rads/rads.shtml, accessed on 25 Febru-
                                 ary 2021). The relationship between wind speed and returned radar power is opposite for
                                 the nadir altimeter reflections to that for the slanted scatterometer reflections: high winds
Remote Sens. 2022, 14, 2251                                                                                            8 of 26

                              land can sometimes reflect 10 times more power than the wind-roughened water. For
                              the altimeter, the decrease in the signal can only be of the same magnitude as the signal,
                              producing a weaker change in returned power for the same fraction of land than in the
                              scatterometer signal [10]. The decreased effect of land on the altimeter signal may combine
                              with the smaller footprint to allow it to retrieve wind speeds closer to the coast than for the
                              scatterometer. We stress that we did not rely on the altimeter wind speeds for absolute wind
                              speed values, but simply detected increases or decreases in wind speeds. Thus, we did not
                              attempt to calibrate the altimeter wind speeds against the scatterometer wind speeds or
                              other wind measurements, as performed by [3].
                                    For both scatterometer, altimeter and ERA-5 data, observations were collected within
                              each spatial bin to form 3-month seasonal averages. The altimeter collected a 1-Hz estimate
                              of wind speed for approximately 7-km sections of track, within 1 km of the nominal
                              track. The 10-day repeats over 28 years would produce a maximum of approximately
                              250 observations in each 3-month season over the open ocean without any data losses.
                              Losses due to rain and other atmospheric effects, orbital problems, electrical problems,
                              etc., reduce this number over the open ocean, while other factors reduce the usable data as
                              land is approached. With one exception, there were at least 68 valid altimeter observations
                              in all of the 3-month averages in the closest bin to the altimeter’s coastal crossing, as
                              presented below. Far from the coast there are usually over 200 altimeter observations used
                              in each average. Estimates of the expected errors/uncertainty in the individual altimeter
                              wind speed retrievals varied from 0.8–0.9 m s−1 [3] to 0.9–1.3 m s−1 [9]. Using a value
                              of 1.3 m s−1 and dividing by the square root of the number of observations resulted in
                              maximum expected errors of 0.2 m s−1 or less for the seasonal averages of the altimeter
                              wind speeds for all but one track in Figure 3. In Figure 4, the number of observations in
                              all averages produced estimated uncertainties of 0.1 m s−1 or less. For the scatterometer
                              data, the expected errors in the individual observations was 0.7 m s−1 [10]. Thus, for
                              the averages within the bins, only 50 observations were needed to reduce the expected
                              errors to 0.1 m s−1 . Only when considering narrow 1-km bins within ~5 km of the coast
                              does the number of scatterometer observations fall below 50. However, it is suggested
                              that unidentified systematic errors of ~0.1 m s−1 may continue to persist in scatterometer
                              averages [10]. Thus, for both altimeter and scatterometer averages of the wind speeds, we
                              characterized the uncertainties as ~0.1–0.2 m s−1 .
                                    Expected errors in the ERA-5 wind fields were characterized by comparisons to ASCAT
                              scatterometer winds by [11]. Global comparisons yielded rms differences of 1.5–2.0 m s−1 .
                              Our comparisons here used data only from the 10-year QuikSCAT period to allow direct
                              comparisons between ERA-5 and satellite results. With decorrelation scales of 3–5 days for
                              the winds, three-month averages of the daily winds contained approximately 700 or more
                              independent observations, resulting again in estimated uncertainties of less than 0.1 m s−1 .
                              For wind stress values of approximately 0.05–0.2 N m−2 over water, as found below, this
                              wind speed translated to errors in wind stress of order 0.002–0.003 N m−2 .
Remote Sens. 2022, 14, x FOR PEER REVIEW                                                                                                        9 of 26
     Remote Sens. 2022, 14, 2251                                                                                                             9 of 26

                                      Figure
                                   Figure      3. (Top)
                                           3. (Top)      Locations
                                                     Locations       of the
                                                                 of the       six altimeter
                                                                         six altimeter      tracks
                                                                                         tracks  for for
                                                                                                     the the  northern
                                                                                                          northern   andand    southern
                                                                                                                           southern       regions
                                                                                                                                       regions offoff
                                                                                                                                                   south-
                                      southwest
                                   west           Africa,with
                                         Africa, along    along28-year
                                                                 with 28-year   (1993–2020)
                                                                          (1993–2020)        averages
                                                                                         averages    of of winter(Middle)
                                                                                                        winter     (Middle)andandsummer
                                                                                                                                   summer (Bottom)
                                                                                                                                             (Bottom) al-
                                      altimeter-derived
                                   timeter-derived    wind wind  speeds
                                                             speeds        retrieved
                                                                     retrieved        along
                                                                                  along     7-km
                                                                                         7-km      sections
                                                                                                secions       of the
                                                                                                          of the     tracks.
                                                                                                                  tracks. TheThe    x-axis
                                                                                                                                x-axis     shows
                                                                                                                                        shows  thethe
                                                                                                                                                   along-
                                      along-track   distance  to the  coastal   crossing.  Values   for  the 0–7   km  bin  closest  to
                                   track distance to the coastal crossing. Values for the 0-7 km bin closest to the coast are not shown.the coast are
                                      not shown.
Remote
 RemoteSens.
        Sens.2022,
              2022,14,
                    14,x2251
                         FOR PEER REVIEW                                                                                          1010ofof26
                                                                                                                                           26

                                 Figure
                                  Figure4.
                                         4. As
                                            As in Figure
                                                  Figure 3,3,except
                                                              exceptthe
                                                                      thealtimeter
                                                                           altimeter wind
                                                                                   wind   speed
                                                                                        speed     retrievals
                                                                                              retrievals     are averaged
                                                                                                         are averaged      into 7-km
                                                                                                                      into 7-km        bins
                                                                                                                                 bins based
                                 based
                                  on theon the distance
                                         distance to theto  the nearest
                                                         nearest  land. land.

                                  3. Results
                                          Expected errors in the ERA-5 wind fields were characterized by comparisons to
                                  3.1. Altimeter
                                 ASCAT              and QuikSCAT
                                              scatterometer    winds Wind   Speed
                                                                      by [11].     Analyses
                                                                                Global  comparisons yielded rms differences of 1.5–
                                 2.0 mMost s−1. Our  comparisons     here  used   data only
                                                 of our evaluations of the QS coastal wind    from   the 10-year
                                                                                                 speeds  used theQuikSCAT
                                                                                                                    data next toperiod    to
                                                                                                                                   southern
                                 allow     direct  comparisons     between   ERA-5   and   satellite results. With  decorrelation
                                  Africa’s west coast. To compare the altimeter retrievals of wind speed to those from the           scales
                                 of   3–5 days for we
                                  scatterometer,      theinitially
                                                            winds, three-month     averages
                                                                    retrieved altimeter    windof the daily
                                                                                                  speed       winds
                                                                                                         values      contained
                                                                                                                 in 7-km          approxi-
                                                                                                                           sections   of the
                                 mately
                                  tracks,700     or more
                                             ignoring   theindependent     observations,
                                                             closest section               resulting
                                                                              to the coastal          again inGiven
                                                                                              land crossing.    estimated   uncertainties
                                                                                                                       the lower    amount
                                 of
                                  ofless
                                       datathan   0.1 m from
                                              available  s−1. For wind
                                                                the     stressfor
                                                                    altimeter   values  of approximately
                                                                                   a given                   0.05–0.2toNthe
                                                                                            period, as compared           m−2scatterometer,
                                                                                                                               over water,
                                 as
                                  wefound      below,this
                                         conducted     thisfor
                                                            wind
                                                               the speed
                                                                   28-yeartranslated
                                                                            altimeter to errors1993–2020.
                                                                                      record,    in wind stress  of order 0.002–0.003
                                                                                                            Climatological     three-monthN
                                 m   −2.
                                  seasonal      averages of these wind speeds were compared to averages of the wind speed
                                  magnitude from QuikSCAT, averaged in 7 km by 13-km rectangles centered on the same
                                 3.tracks.
                                     Results An example of the sampling geometry is presented in Figure 2. The seasonal winter
                                  and     summer
                                 3.1. Altimeter and  averages
                                                        QuikSCAT of wind
                                                                     Windspeed     along the six altimeter tracks available between
                                                                            Speed Analyses
                                  20–35◦ S appear in Figure 3. Average wind speed values were plotted as a function of the
                                          Most of our evaluations of the QS coastal wind speeds used the data next to southern
                                  alongtrack distance from the 7-km section to the track’s land crossing (the closest coastal
                                 Africa’s west coast. To compare the altimeter retrievals of wind speed to those from the
                                  data point is at 10.5 km). Due to the angles at which the tracks approached the coast, and
                                 scatterometer, we initially retrieved altimeter wind speed values in 7-km sections of the
                                  also to capes and bays in the coastline, the distance of the track section (the bin) between
                                 tracks, ignoring the closest section to the coastal land crossing. Given the lower amount
                                  7–13 km of the coastal crossing was closer to the coast than 7 km. Data in this first bin
                                 of data available from the altimeter for a given period, as compared to the scatterometer,
                                  were affected by radar footprints that extend over the coast, resulting in wind speeds that
                                 we conducted this for the 28-year altimeter record, 1993–2020. Climatological three-month
                                  increased in some of the bin averages that were closest to the coast. The coastline near
                                 seasonal
                                  the crossing averages   of these
                                                    of Track        windparticularly
                                                               235 was     speeds were     compared producing
                                                                                        convoluted,    to averagesa of   the wind
                                                                                                                       decrease   andspeed
                                                                                                                                       then
                                 magnitude from QuikSCAT, averaged in 7 km by 13-km rectangles centered on the same
Remote Sens. 2022, 14, 2251                                                                                            11 of 26

                              increase next to the coast, as discussed below. As discussed above, expected errors for all
                              averages presented in Figure 3, except along Track 235, were less 0.2 m s−1 . For Track 235,
                              the low number of data points for the inner two averages during both seasons produced
                              uncertainties in Figure 3 between 0.2 m s−1 and 0.5 m s−1 .
                                    Figure 4 eliminated the problem caused by the slanted altimeter tracks by binning the
                              altimeter wind speeds according to the actual distance to the nearest land, as reported in the
                              along-track data records. Ignoring Track 235, only Track 209 showed an increase in wind
                              speed in the bin closest to the coast (using data between 7–13 km from land). As discussed
                              below, this may be due to a small island that does not appear on the map. The lowest
                              number of points in any of the most coastal averages was 162, resulting in a maximum
                              expected error of 0.1 m s−1 . The decrease in wind speed (remembering that the altimeter
                              estimates were approximate) between the last two data points (at ~17 and ~10 km from
                              land) ranged from 0.2 to 0.9 m s−1 for most tracks during the two seasons. We concluded
                              that, based on the altimeter data, the actual wind speed did not increase in general as the
                              coast was approached, agreeing with the results of [3] along the Chilean coast.
                                    Results of the 10-year binned averages of winter and summer L2B scatterometer
                              wind speed magnitudes appear in Figure 5, where the average scatterometer wind speed
                              magnitudes from within the 7 km by 13 km rectangular areas oriented along the altimeter
                              tracks (as in Figure 2) were plotted as a function of the along-track distance between the
                              center of the rectangle and the coastal crossing of the altimeter track. As in the altimeter
                              plots, the center of the first coastal rectangle next to the coast for which data were plotted
                              was at 10.5 km from the crossing. Solid lines show averages of the points within the
                              rectangles, excluding those marked as suspect by the PCP flag. All but the two most
                              northern tracks showed an increase in wind speed next to the coast during summer (Track
                              057) or winter (Tracks 133, 209 and 031), with increases of 0.3 m s−1 to 0.5 m s−1 . This result
                              did not change when all of the retrievals within the rectangles were used (ignoring the PCP
                              flag), represented by the dotted lines. The fewest number of points in the closest bin to the
                              crossing was 231 (Track 133 in winter), producing an uncertainty of 0.05 m s−1 ).
                                    Even more than the altimeter data along the tracks, averages of the wind speeds in
                              the rectangles suffered from retrievals that were much closer than 7 km from the coast.
                              In Figure 6, the scatterometer wind speeds were averaged according to their distances to
                              the nearest land (compare to the similar binning of altimeter data in Figure 4). Thus, all
                              L2B scatterometer data within 6.5 km of the altimeter track and between 7–13 km from the
                              nearest land were averaged into the closest point from land (the PCP flags had no effect on
                              these points and were not used). In these averages, the fewest number of points in any of
                              the averages closest to the coast was 1066, producing an uncertainty of 0.02 m s−1 , although
                              a nominal uncertainty of 0.1 m s−1 was still used. The influence of land still affected three
                              of the six tracks at the 1–2 grid points closest to land, more strongly during summer. We
                              note that, in Figure 1a, the region covered by the two most northern tracks did not show
                              the reversal in sign of the wind stress curl next to the coast, consistent with the fact that
                              the data along those tracks did not show an increase in wind speed next to the coast in
                              either Figure 5 or Figure 6. From these results, we concluded that QuikSCAT data retrieved
                              from within 7–13 km of land may display an artificial increase in wind speed. The actual
                              increase between the last two grid points next to land depends on the track location and
                              the season but is as large as approximately 0.5 m s−1 .
Remote Sens. 2022, 14, x FOR PEER REVIEW                                                                                                   12 of 26

Remote Sens. 2022, 14, 2251                                                                                            12 of 26
                                 actual increase between the last two grid points next to land depends on the track location
                                 and the season but is as large as approximately 0.5 m s .−1

                                 Figure
                                  Figure 5.
                                         5. As
                                            As in
                                                in Figure 3, except
                                                             except showing
                                                                      showingQuikSCAT
                                                                                 QuikSCATwindwindspeeds
                                                                                                    speeds  binned
                                                                                                          binned     into
                                                                                                                   into   rectangular
                                                                                                                        rectangular    boxes
                                                                                                                                    boxes     (7
                                                                                                                                          (7 km
                                 km   bykm)
                                  by 13  13 km)    arranged
                                             arranged   alongalong    the altimeter
                                                               the altimeter         tracks
                                                                              tracks as     as in
                                                                                        shown   shown
                                                                                                  Figurein2.Figure   2. Solid
                                                                                                             Solid Lines:     Lines: Retrievals
                                                                                                                           Retrievals marked as
                                 marked
                                  suspect as
                                          by suspect
                                              the PCPby   the
                                                       flag   PCP
                                                            are     flag areDotted
                                                                excluded.    excluded.   Dotted
                                                                                    Lines:       Lines: All
                                                                                           All retrieved     retrieved scatterometer
                                                                                                          scatterometer   L2 wind speedL2values
                                                                                                                                          wind
                                 speed  values  within  each  rectangle  are  averaged.  The x-axis  shows   the alongtrack   distance
                                  within each rectangle are averaged. The x-axis shows the alongtrack distance from the box center     from theto
                                 box center to the nearest coastal crossing. Values for the box that would be touching the coast are
                                  the nearest coastal crossing. Values for the box that would be touching the coast are not shown.
                                 not shown.
                                        This is a suggestive but not conclusive result. To investigate this further, we examined
                                       This  is a suggestive
                                  in more detail                   but notdata
                                                    the scatterometer        conclusive
                                                                                  that wereresult.
                                                                                              foundTowithin
                                                                                                         investigate    this further,
                                                                                                               the 7–13-km               we exam-
                                                                                                                                rectangles    closest
                                 ined  incoast
                                  to the  moreon   detail  thetracks
                                                     all six    scatterometer
                                                                       (which were dataaveraged
                                                                                         that weretofound
                                                                                                       form within
                                                                                                             the wind  thespeed
                                                                                                                             7–13-km    rectangles
                                                                                                                                   nearest   to land
                                 closest to the
                                  in Figure        coast on
                                             5). Figure        all six the
                                                            7 shows    tracks  (which
                                                                           spatial       were averaged
                                                                                     distribution   of thesetopoints.
                                                                                                               form the     wind
                                                                                                                        First,      speed
                                                                                                                                black       nearest
                                                                                                                                       points   were
                                 to  land  in  Figure   5).  Figure    7 shows     the  spatial  distribution    of  these
                                  plotted for all wind speed retrievals that fell within the 7 × 13 km rectangles, ignoring  points.   First,  black
                                                                                                                                                  the
                                 points  were
                                  PCP flag.      plotted
                                               Some         for all
                                                      of these       winddot)
                                                                  (black    speed    retrievals that
                                                                                 observations     werefell  within
                                                                                                         closer than the7 7km× 13
                                                                                                                               or km   rectangles,
                                                                                                                                   farther  than 13
                                 ignoring
                                  km fromthe  land.PCP   flag.blue
                                                      Next,      Some   of these
                                                                      dots          (black dot)
                                                                            were plotted           observations
                                                                                             for all points within were  6.5closer
                                                                                                                              km ofthan
                                                                                                                                      the 7nominal
                                                                                                                                             km or
                                 farther  thanbetween
                                  track and      13 km from 7–13land.    Next,the
                                                                   km from       blue  dots were
                                                                                    nearest   land,plotted    for allon
                                                                                                     as reported       points   within 6.5 km
                                                                                                                          the scaterometer         of
                                                                                                                                                data
                                 the  nominal     track  and    between    7–13   km   from  the   nearest  land,   as reported
                                  record. These overlay many of the black dots within the rectangle and include many more           on  the scater-
                                 ometer   data record.
                                  points outside     of theThese    overlay
                                                              rectangle,      many
                                                                            due       of the
                                                                                  to the      black dots
                                                                                          coastline        within Finally,
                                                                                                      geometry.     the rectangle
                                                                                                                               orange and  include
                                                                                                                                         dots   were
                                 many
                                  plotted over all of the above data points within the rectangle that have the PCP flagorange
                                         more    points   outside    of the  rectangle,   due   to the  coastline  geometry.      Finally,    set, so
                                 dots  were
                                  at 5 km   orplotted   over
                                                closer to   theall  of the
                                                                 coast,  or above    data points
                                                                            if otherwise            within
                                                                                            they were       the rectangle
                                                                                                          considered          that have the PCP
                                                                                                                         suspect.
                                 flag set, so at 5 km or closer to the coast, or if otherwise they were considered suspect.
RemoteSens.
Remote Sens. 2022, 14, x2251
             2022, 14,   FOR PEER REVIEW                                                                                                               1313ofof26
                                                                                                                                                                26

                                 Figure
                                  Figure 6.
                                          6. As
                                              As in
                                                  in Figure
                                                     Figure 5 except showing
                                                                      showing QuikSCAT
                                                                                QuikSCATwind windspeeds
                                                                                                    speedsbinned
                                                                                                            binnedaccording
                                                                                                                     accordingtotothethe distance
                                                                                                                                       distance of
                                 of the individual     wind retrievals to the nearest  land.  Bins are again  divided  into  7 km   distances
                                  the individual wind retrievals to the nearest land. Bins are again divided into 7 km distances (7–13,       (7–
                                 13, 14–20,
                                  14–20,      etc.).
                                         etc.).  TheThe  blue
                                                      blue    dots
                                                           dots    in Figure
                                                                in Figure     7 show
                                                                           7 show  thethe  retrievals
                                                                                       retrievals     within
                                                                                                   within    7–13
                                                                                                          7–13  kmkm   of any
                                                                                                                    of any  landland
                                                                                                                                   andand  within
                                                                                                                                        within 6.5
                                 6.5 km  of  the  altimeter track. Above   data points  closest to the coast are the averages    of the
                                  km of the altimeter track. Above data points closest to the coast are the averages of the blue dots   blue dots
                                                                                                                                                in
                                 in Figure 7.
                                  Figure 7.

                                       In
                                        In Figure
                                            Figure 7, 7, ifif one
                                                              one imagines
                                                                     imagines the   the altimeter
                                                                                         altimeter track
                                                                                                       track running
                                                                                                               running through
                                                                                                                           through the   the middle
                                                                                                                                               middle of   of the
                                                                                                                                                               the
                                 northern     and   southern        faces    of the   rectangles     (perpendicular        to
                                  northern and southern faces of the rectangles (perpendicular to those faces), the reason for those    faces),     the   reason
                                 for
                                  thethe  convoluted
                                       convoluted           altimeter
                                                       altimeter           wind
                                                                        wind       speed
                                                                                speed    ininFigure
                                                                                                Figure3 3forforTrack/Pass
                                                                                                                Track/Pass 235  235 becomes
                                                                                                                                       becomes clear. clear. The
                                                                                                                                                              The
                                 track
                                  trackwas
                                         wassheltered
                                               shelteredfrom   from thethewinds
                                                                            winds(coming
                                                                                      (comingfrom fromthe thesoutheast)
                                                                                                              southeast)as    asititentered
                                                                                                                                     enteredthe  thesouthern
                                                                                                                                                       southern
                                 end
                                  end ofof the
                                            the bay
                                                 bay near
                                                       near 23.4°S
                                                                23.4◦ S (the
                                                                           (the wind
                                                                                  wind speed
                                                                                          speed decreases),
                                                                                                   decreases), thenthen itit moved
                                                                                                                              moved into   into the
                                                                                                                                                  the bay
                                                                                                                                                        bay and
                                                                                                                                                              and
                                 actually    touched      land      at  the   northeast     corner     of  the  track   (the
                                  actually touched land at the northeast corner of the track (the wind speed increases). Along wind      speed      increases).
                                 Along    Trackthe
                                  Track 209,       209,
                                                      longthetaillongoftail
                                                                          blue of points
                                                                                  blue points
                                                                                           to thetosouth
                                                                                                       the south
                                                                                                              of theof rectangle
                                                                                                                       the rectangle   waswas caused caused    by
                                                                                                                                                           by the
                                 the  proximity
                                  proximity         to Dassen
                                                to Dassen            Island
                                                                Island         in the
                                                                          in the       southeast.
                                                                                   southeast.         In visible
                                                                                                 In visible        high-resolution
                                                                                                               high-resolution              satellite
                                                                                                                                      satellite         images,
                                                                                                                                                   images,    one
                                 one
                                  can can
                                       see see   another
                                            another    small  small    island,
                                                                  island,        Vodeling
                                                                            Vodeling           Island,
                                                                                         Island,         located
                                                                                                    located   aboutabout    a kilometer
                                                                                                                      a kilometer       from  from
                                                                                                                                                 the the
                                                                                                                                                       coastcoast
                                                                                                                                                              just
                                 just north
                                  north        of where
                                          of where            the Track
                                                      the Track               209 crosses
                                                                       209 crosses            the coast
                                                                                       the coast            (position
                                                                                                    (position   shownshown by theby  starthein star
                                                                                                                                               Figure in Figure
                                                                                                                                                          7). The
                                 7). The island
                                  island   was not  was
                                                      in thenot data
                                                                  in thebase
                                                                           dataused
                                                                                  basetoused
                                                                                           draw to draw     our coastlines.
                                                                                                    our coastlines.             If it not
                                                                                                                         If it was     wasinnot theindata
                                                                                                                                                        the data
                                                                                                                                                             base
                                 base   used   to estimate       the  distance     to  nearest   land   that  was   included
                                  used to estimate the distance to nearest land that was included in the RADS altimeter data      in  the   RADS      altimeter
                                 data   records,
                                  records,         reflections
                                             reflections      fromfrom        this island
                                                                       this island    may mayexplainexplain    the continued
                                                                                                        the continued       increaseincrease      in altimeter
                                                                                                                                          in altimeter      wind
                                 wind
                                  speedspeed
                                          for thisfortrack
                                                       this next
                                                               tracktonextthe to   theincoast
                                                                               coast      Figurein Figure
                                                                                                     4, even4,when
                                                                                                                 eventhe when      the altimeter
                                                                                                                             altimeter      bin wasbin       was
                                                                                                                                                         thought
                                 thought
                                  to be over to 7bekm
                                                    overfrom  7 km     from
                                                                   land.       land. altimeter
                                                                           A 7-km      A 7-km altimeter
                                                                                                     footprintfootprint
                                                                                                                  might bemight 7 km be  from7 km thefrom     the
                                                                                                                                                        nominal
                                  coast butcoast
                                 nominal      still receive
                                                     but stillreflections        from the from
                                                                   receive reflections        island.the island.
Remote Sens.
       Remote2022,
               Sens.14, x FOR
                     2022,      PEER REVIEW
                           14, 2251                                                                                                14 of1426of 26

                                        Figure 7. For each altimeter track, the closest 7 km × 13 km box used to average the scatterometer
                                    Figure 7. For each altimeter track, the closest 7 km × 13 km box used to average the scatterometer
                                        wind speeds in Figure 5 is shown. Shown also are all retrievals within 7–13 km of land and within
                                    wind speeds in Figure 5 is shown. Shown also are all retrievals within 7–13 km of land and within
                                         6.5 km of the altimeter track (blue). Within each box, retrievals flagged by the “Poor Coastal
                                    6.5 km of the altimeter track (blue). Within each box, retrievals flagged by the “Poor Coastal Pro-
                                         Processing” flag as ‘suspect’ are in orange. Retrievals closer than 7 km or farther from 13 km from
                                    cessing”  flag as ‘suspect’ are in orange. Retrievals closer than 7 km or farther from 13 km from land
                                         land but not flagged are shown in black.
                                    but not flagged are shown in black.

                                         To examine the wind speeds in more detail, in Figure 8, the points within the rectan-
                                    gular binds in Figure 7 were averaged into 1-km bins based on their distance to the nearest
                                    land. The black circles represent the averages of all points within the 1 km subsets of the
                                    data within the rectangles, each circle with a diameter of approximately 0.5 m s−1. The red
                                    triangles are averages that exclude the points identified by the PCP flag as suspect. Even
                                    in these narrow bins, the number of points assures that the uncertainties in the averages
                                                                                                                −1
Remote Sens. 2022, 14, 2251                                                                                                                 15 of 26

                                            To examine the wind speeds in more detail, in Figure 8, the points within the rectan-
                                      gular binds in Figure 7 were averaged into 1-km bins based on their distance to the nearest
                                      land. The black circles represent the averages of all points within the 1 km subsets of the
                                      data within the rectangles, each circle with a diameter of approximately 0.5 m s−115
Remote Sens. 2022, 14, x FOR PEER REVIEW
                                                                                                                                        . The  red
                                                                                                                                           of 26
                                      triangles are averages that exclude the points identified by the PCP flag as suspect. Even in
                                      these narrow bins, the number of points assures that the uncertainties in the averages at
                                      distances of 6 km or more from land were less than 0.1 m s−1 . At 5 km and less from land,
                                   land,  uncertainties
                                      uncertainties  werewere  larger
                                                           larger  but but
                                                                        still still
                                                                              less less
                                                                                    thanthan
                                                                                           0.5 m0.5s−m1 .sThe
                                                                                                          −1. The lower of the two horizontal
                                                                                                               lower of the two horizontal lines
                                   lines  (separated
                                      (separated      by 1.0
                                                  by 1.0  m sm s) passes
                                                              − 1 −1 ) passes   through
                                                                            through      thethe  center
                                                                                              center   of of
                                                                                                           thethe  circle,
                                                                                                                circle,    representing
                                                                                                                        representing thethe av-
                                                                                                                                         average
                                   erage
                                      wind wind  speed
                                             speed      in bin
                                                   in the  the centered
                                                               bin centeredat 11atkm 11 from
                                                                                        km from      the nearest
                                                                                               the nearest     land.land.

                                      Figure
                                   Figure      8. Scatterometer
                                           8. Scatterometer   wind wind  speeds
                                                                     speeds  fromfrom
                                                                                   L2B L2B    retrievals
                                                                                        retrievals       within
                                                                                                    within the 7 the
                                                                                                                 × 137km× bin
                                                                                                                          13 km   bin nearest
                                                                                                                               nearest          to the
                                                                                                                                       to the coast
                                   (the rectangles  in Figure  7), averaged   into 1-km  bins  based  on the distance  from  the L2B  vector
                                      coast (the rectangles in Figure 7), averaged into 1-km bins based on the distance from the L2B vector   wind
                                   retrieval  to the nearest
                                      wind retrieval          land. All
                                                      to the nearest      seasons
                                                                      land.        are included.
                                                                            All seasons             BlackBlack
                                                                                          are included.   circles are the
                                                                                                               circles     averages
                                                                                                                       are the       of all
                                                                                                                               averages     points
                                                                                                                                         of all points
                                   within  the  1-km  bin  within   the rectangle;  red triangles  exclude  those  identified  by the
                                      within the 1-km bin within the rectangle; red triangles exclude those identified by the PCP flagPCP   flag as as
                                   suspect, including all points within 5 km of land. The two horizontal lines are separated by 1 m/s,
                                      suspect, including all points within 5 km of land. The two horizontal lines are separated by 1 m/s,
                                   while the lower of the two lines passes through the wind speed value at 11 km from the nearest
                                      while the lower of the two lines passes through the wind speed value at 11 km from the nearest land.
                                   land.

                                       With the exception of Track 235, there was sometimes an initial decrease in wind
                                   speed as land was approached from offshore, then an increase in wind speed starting
                                   somewhere between 8–10 km from land. The increase between 10–11 km and 6 km was
Remote Sens. 2022, 14, 2251                                                                                           16 of 26

                                    With the exception of Track 235, there was sometimes an initial decrease in wind speed
                              as land was approached from offshore, then an increase in wind speed starting somewhere
                              between 8–10 km from land. The increase between 10–11 km and 6 km was least for Tracks
                              159 and 031 (0.3–0.5 m s−1 ) and greatest for Tracks 209, 133 and 057 (~1.0 m s−1 or more).
                              In some cases, excluding points based on the PCP flag reduces the increase in wind speed
                              slightly (triangles move to the lower half of the circles for Tracks 031 and 209), but the
                              general trend remains. For Track 235, the steady decrease in wind speed as land was
                              approached appears to be most strongly controlled by the sheltering provided within the
                              bay from the wind that was predominantly from the southeast (Figure 7).
                                    To further increase the data and the regions investigated, nine tracks next to the U.S.
                              west coast were added to the analysis in Figure 9. In this analysis, we excluded the tracks
                              between Track 145 and Track 119 because they either passed over islands in the Southern
                              California Bight or ended in regions of complex coastal geometry, such as Track 221 (not
                              shown), which terminated within Monterey Bay (36–37◦ N). Along these tracks, an increase
                              in altimeter wind speed approaching the coast only occurred at the grid point closest to
                              the coast on the most northern Track 171 (not shown), even when distance was measured
                              along-track to the nearest coastal crossing rather than to the nearest land. The QuikSCAT
                              wind speed averages in Figure 9, on the other hand, showed consistent increases in wind
                              speed at 8–10 km and closer to the land from the six northern tracks (in typical exposed
                              coastal conditions with strong summer and winter winds of opposite directions) and the
                              three southern tracks (in the sheltered Southern California Bight where northerly winds are
                              typically much weaker). This is true for the averages of all of the points and for averages of
                              just the “good” points represented by the red triangles. This indicates that the elimination
                              of “suspect” points by the PCP flag does not eliminate the overestimates of wind speeds
                              within 10 km of the coast.
                                    The magnitude of the increase in wind speed between 10–11 km and 6 km from land
                              indicated by the scatterometer data varies between altimeter tracks, from ~0.3 m s−1 to
                              over 1.0 m s−1 . Where there was enough data, this increase continued to grow at 5 km and
                              less from land, providing support for the flagging of data inshore of 5 km by the PCP flag.
                              Our results were consistent with those of [5], who showed (their Figure 7) an increase in
                              the differences between wind speeds measured by LCRES retrievals and meteorological
                              buoys (LCRES-buoy) when the distance to land decreased from about 15 km to 7–8 km,
                              increasing from ~0.7 m s−1 to ~1.3 m s−1 . They noted that the positive biases in the
                              QuikSCAT wind speeds (compared to buoys) were only modestly greater at 10 km from
                              land than at 40 km. Our results agree approximately with this difference (~0.5 m s−1 ).
                              Considering the altimeter result that the actual wind speed was decreasing toward land,
                              both results indicated an overestimate in wind speed of approximately 0.5 to 1.0 m s−1
                              between about 10–11 km and 6 km from land, producing the change in sign of wind stress
                              curl that attracted our attention.
                                    Based on these results, and particularly because we were interested in accurate mean
                              values of wind stress curl, in our research applications we discarded all Level 2B wind
                              retrievals at 10 km and less from land. We also discard retrievals with the PCP flag set, since
                              it included factors in addition to proximity to land. Figure 10 shows the 10-year averages
                              of QuikSCAT wind stress and wind stress curl for the same domains as in Figure 1a,b, but
                              with the removal of retrievals at distances of 10 km and less of land and the use of the PCP
                              flag. We also counted the closest 0.1◦ grid point to the coast as missing, since the gridding
                              procedure essentially extrapolated to this position, using data from 40 km farther offshore.
                              Elimination of the narrow regions next to the coast with a reversal in sign of the wind stress
                              curl was clear. The appearance was minor over these large regions but became important in
                              our analysis of the relative roles of wind stress versus wind stress curl in driving upwelling
                              in specific coastal regions.
increases in wind speed at 8–10 km and closer to the land from the six northern tracks (in
                              typical exposed coastal conditions with strong summer and winter winds of opposite
                              directions) and the three southern tracks (in the sheltered Southern California Bight where
                              northerly winds are typically much weaker). This is true for the averages of all of the
                              points and for averages of just the “good” points represented by the red triangles. This
Remote Sens. 2022, 14, 2251                                                                                         17 of 26
                              indicates that the elimination of “suspect” points by the PCP flag does not eliminate     the
                              overestimates of wind speeds within 10 km of the coast.

                              Figure  9. As in Figure 8, scatterometer
                              Figure 9.                  scatterometer wind
                                                                       wind speeds
                                                                            speeds from
                                                                                    fromL2B
                                                                                          L2Bretrievals
                                                                                              retrievalswithin
                                                                                                         withinthe  nearest77×× 13 km
                                                                                                                thenearest
                              bin to the
                                     the coast,
                                         coast, averaged
                                                averaged into 1-km bins based on the distance
                                                                                       distance from the
                                                                                                       the L2B
                                                                                                           L2B vector
                                                                                                               vector wind
                                                                                                                      wind retrieval
                                                                                                                             retrieval
                                                                                         Figure 7).
                              to the nearest land along each altimeter track (similar to Figure 7). Here we composite all retrievals
                              during all seasons from multiple tracks along two regions of the U.S. West Coast: the more energetic
                              region off northern California, Oregon and Washington; and the calmer region within the Southern
                              California Bight. Black circles, red triangles and horizontal lines are as in Figure 8.

                              3.2. ERA-5 Wind Stress and Wind Speed Analyses
                                   Moving to the ERA-5 wind stress and wind stress curl fields in Figure 1c,d, our
                              analysis focused on the coastal region off northern California between 37–42◦ N. Off Cape
                              Mendocino (~40.4◦ N) and north of Cape Blanco (~43◦ N), the July average in Figure 1d
                              depicts negative wind stress curl adjacent to land, indicating an increase in the equatorward
                              winds next to the coast. In Figure 11, we formed averages of ERA-5 10-m wind speed
                              magnitudes and cross-transect wind stresses along transects that moved from ocean to land,
                              approximately perpendicular to the coastline (Figure 11, maps, not along altimeter tracks).
                              In Figure 11 line plots, it is evident for summer and winter (and for the other seasons, not
                              shown) that there was a universal decrease in wind speed over the ~50 km next to the coast,
                              continuing to decrease over land. Red arrows identify the two grid points over water and
                              closest to the coast near Cape Mendocino. This decrease in wind speed over the ocean next
                              to the coast was also found along all three transects in Figure 11, as well as along all other
                              transects that we examined crossing the coast between 30–50◦ N.
4, x FOR PEER REVIEW
        Remote Sens. 2022, 14, 2251                                                                                                    18 of 26

                                          Figure 10. Edited 10-year averages of QuikSCAT wind stress vectors overlaid on wind stress curl for
               Figure 10. Edited 10-year averages of QuikSCAT wind stress vectors overlaid on wind stress curl for summer along the coasts of (a) so
                                          summer
               western U.S, as in Figure 1a,b.     along retrievals
                                               L2B wind   the coastsmarked
                                                                    of (a) southern Africa
                                                                             as suspect     andPCP
                                                                                        by the  (b) the
                                                                                                    flagwestern U.S,within
                                                                                                        or located   as in Figure 1a,b.
                                                                                                                           10 km of landL2B
                                                                                                                                          arewind
                                                                                                                                              eliminated.
                                          retrievals marked as suspect by the PCP flag or located within 10 km of land are eliminated.

                                              However, cross-transect vector (i.e., signed) wind stress values in Figure 11 can be seen
                                         to increase near Cape Mendocino at the same points (red arrows pointing at blue circles),
                                         whether winds were from the north (negative wind stress in summer, June–August) or
                                         from the south (positive wind stress during winter, December–February). The increase
                                         in wind stress magnitude was even greater over land inshore of Cape Mendocino. The
                                         increase near and over land was not the same for all transects, although the magnitude of
                                         the wind stress was greater over land during some seasons for all transects.
                                              The cause for increasing wind stress over land was due to the difference in “surface
                                         roughness” between water (very low) and land (much greater). To examine the behavior of
                                         the wind stress within the ERA-5 model, one month (August 2005) of data on the native
                                         RGG grid of the model was examined. Figure 12 presents the “surface roughness” (used to
                                         calculate wind stress) and cross-transect vector wind stress on the native RGG grid points
                                         of the model, along with the same variables on the regular lat-lon grid, onto which all of
                                         our ERA-5 data were interpolated.
Remote Sens. 2022, 14, 2251Remote Sens. 2022, 14, x FOR PEER REVIEW                                                                                 1919ofof2626

                                       Figure 11. (Above,Figure
                                                            single
                                                                 11.panel)
                                                                     (Above,ERA-5   interpolated
                                                                             single panel)         grid pointsgrid
                                                                                           ERA-5 interpolated     surrounding    three transects
                                                                                                                     points surrounding           crossing
                                                                                                                                        three transects cross-
                                                          ing the coast of northern California. Colors identify the transects and correspond to the colors of
                                       the coast of northern   California. Colors identify the transects and correspond to the colors of lines
                                       in the line plots. Red arrows point to two grid points over water just offshore of Cape Mendocino
                                       (40.4◦ N). (Below, four panels) (Left) Averages of the ERA-5 10-meter wind speed magnitude at the
                                       interpolated grid points shown in the map, as a function of the distance between the grid point and
                                       the nearest land (negative is distance over land to nearest coastline). (Right) Cross-transect wind
                                       stress at the same gridpoints. Three-month seasonal averages for the 10-year QuikSCAT period
                                       are shown for equatorward winds in summer (top) and poleward winds in winter (bottom). Red
                                       arrows point to data at the two grid points over water just offshore of Cape Mendocino (40.4◦ N).
                                       The transects are identified by the latitude of their coastal crossing.
Remote Sens. 2022, 14, 2251                                                                                          20 of 26

                                    The locations of the grid points on the map (Figure 12, left panel) can also be seen
                              relative to the coastline on the plots of roughness and wind stress (middle and right panels).
                              For clarity, we plotted only the more northern line of points at 41.4◦ N and the more southern
                              line of points at 40.4◦ N. On the plot of surface roughness, the values on the RGG grid points
                              (circles) over water were very low (appearing near zero), rising to much greater values
                              over land. On the interpolated grid (crosses), the roughness was also low over water away
                              from the coast. On the dark blue interpolated grid point over water but closest to land near
                              Cape Mendocino (red arrow), roughness showed an increase compared to farther offshore
                              over water. This is because that grid point lies between the RGG grid point located over
                              water and the next RGG point, located on land. The method of interpolation was bi-linear,
                              so the interpolated point did not appear exactly on the line between the RGG points. As
                              evident on the Figure 12 map, only along the transect that crosses Cape Mendocino did the
                              interpolated points over water next to the coast lie directly between land and ocean RGG
                              grid points. This is also seen in the line plots of monthly averaged (August) cross-transect
                              wind stress, where the circles and dotted lines over water showed a decrease in wind stress
                              as land was approached, then an increase over land. On the wind stress line plot, the
                              first dark blue circle over land inshore of Cape Mendocino was off-scale with a greater
                              (negative) wind stress magnitude. Interpolation between this point and the first RGG point
                              (dark blue circle) over water created the increased value of the interpolated wind stress
                              (red arrow) over water for that transect.
                                    Figure 13 presents a map of the August 2005 average vector wind stress field, with blue
                              vectors on the RGG grid and orange vectors on the interpolated grid. Just offshore of Cape
                              Mendocino, in the black box, one finds two orange vectors next to the coast that are greater
                              than the next orange vectors offshore (the same grid points identified in Figures 11 and 12).
                              We see again that these two orange vectors lie between weaker blue vectors just to their
                              west over water and stronger blue vectors over land to their east. Interpolation from the
                              blue to orange vector locations caused the increased wind stress values next to the coast on
                              the rectangular interpolation grid.
                                    Most ERA-5 data sets are provided on a regular rectangular lat-lon grid such as the
                              one shown here, interpolated from the model RGG grid, as described in Section 2. To obtain
                              wind stress fields that are not affected by the interpolation artifact described above, we
                              recommend using the interpolated vector wind speeds and then calculating the vector
                              wind stress from the wind speeds over water using a bulk algorithm such as [7]. This is the
                              approach adopted in our modeling of the eastern Pacific with the Regional Ocean Modeling
                              System (ROMS). The interpolation still affected the wind speeds at some near-land grid
                              points, but since the wind speeds were generally lower over land, it reduced the wind
                              speeds in a manner similar to the reduction by the land’s increased roughness. It will not
                              reverse the sign of the wind stress curl. As an example, Figure 14 shows the mean 10-year
                              July wind stress vectors over wind stress curl, as calculated within the ROMS system
                              from the interpolated ERA-5 vector wind speeds (interpolated to 1/12◦ ). A comparison to
                              Figure 1d indicates that the large regions of incorrect wind stress curl next to the coast in
                              Figure 1d is not present in Figure 14.
You can also read