Flow Characteristics and Salinity Patterns in Tidal Rivers Within the Northern Ten Thousand Islands, Southwest Florida, Water Years 2007-19

Page created by Sandra Hawkins
 
CONTINUE READING
Flow Characteristics and Salinity Patterns in Tidal Rivers Within the Northern Ten Thousand Islands, Southwest Florida, Water Years 2007-19
Prepared in cooperation with the U.S. Army Corps of Engineers

Flow Characteristics and Salinity Patterns in Tidal Rivers
Within the Northern Ten Thousand Islands, Southwest
Florida, Water Years 2007–19

Scientific Investigations Report 2021–5028

U.S. Department of the Interior
U.S. Geological Survey
Flow Characteristics and Salinity Patterns in Tidal Rivers Within the Northern Ten Thousand Islands, Southwest Florida, Water Years 2007-19
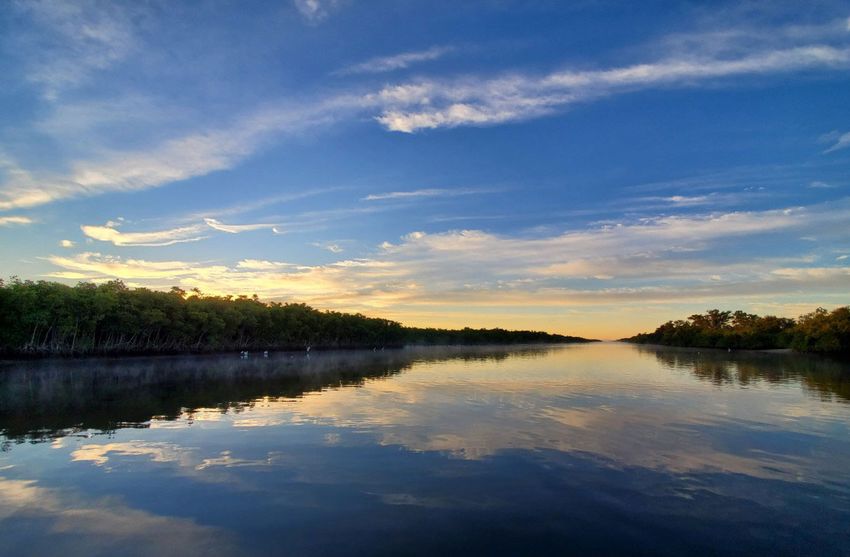
Cover. Faka Union Canal looking downstream (to the south). Photograph by Lars Soderqvist, U.S.
Geological Survey.
Flow Characteristics and Salinity Patterns in Tidal Rivers Within the Northern Ten Thousand Islands, Southwest Florida, Water Years 2007-19
Flow Characteristics and Salinity Patterns
in Tidal Rivers Within the Northern Ten
Thousand Islands, Southwest Florida,
Water Years 2007–19

By Amanda C. Booth and Travis M. Knight

Prepared in cooperation with the U.S. Army Corps of Engineers

Scientific Investigations Report 2021–5028

U.S. Department of the Interior
U.S. Geological Survey
U.S. Geological Survey, Reston, Virginia: 2021

For more information on the USGS—the Federal source for science about the Earth, its natural and living resources,
natural hazards, and the environment—visit https://www.usgs.gov or call 1–888–ASK–USGS.
For an overview of USGS information products, including maps, imagery, and publications, visit
https://store.usgs.gov/.

Any use of trade, firm, or product names is for descriptive purposes only and does not imply endorsement by the U.S.
Government.
Although this information product, for the most part, is in the public domain, it also may contain copyrighted materials
as noted in the text. Permission to reproduce copyrighted items must be secured from the copyright owner.

Suggested citation:
Booth, A.C., and Knight, T.M., 2021, Flow characteristics and salinity patterns in tidal rivers within the northern Ten
Thousand Islands, southwest Florida, water years 2007–19: U.S. Geological Survey Scientific Investigations Report
2021–5028, 21 p., https://doi.org/​10.3133/​sir20215028.

ISSN 2328-0328 (online)
iii

Acknowledgments
This project was partially funded by the Greater Everglades Priority Ecosystems Science (GEPES)
Program, which was a part of the Ecosystems Mission Area. The authors wish to thank Michael
Simmons with the U.S. Army Corps of Engineers for review of this report. The authors also wish
to thank Lars Soderqvist, Drew Milewski, Rachel Margalus, and Megan Montgomery of the U.S.
Geological Survey for their many hours of hard work in the field collecting the data presented in
this report and for computing and verifying flow and salinity data.
v

Contents
Acknowledgments����������������������������������������������������������������������������������������������������������������������������������������iii
Abstract�����������������������������������������������������������������������������������������������������������������������������������������������������������1
Introduction����������������������������������������������������������������������������������������������������������������������������������������������������1
     Purpose and Scope������������������������������������������������������������������������������������������������������������������������������4
     Description of Study Area�������������������������������������������������������������������������������������������������������������������5
Methods of Investigation������������������������������������������������������������������������������������������������������������������������������6
     Data Collection��������������������������������������������������������������������������������������������������������������������������������������6
     Data Analysis�����������������������������������������������������������������������������������������������������������������������������������������6
Annual and Monthly Variability and Trends in Rainfall����������������������������������������������������������������������������8
Flow Characteristics and Salinity Patterns in the Ten Thousand Islands������������������������������������������10
     Annual and Monthly Flow Characteristics of Tidal Rivers�����������������������������������������������������������10
     Trends in Flow��������������������������������������������������������������������������������������������������������������������������������������10
     Salinity Patterns and Trends in Tidal Rivers and Bays�����������������������������������������������������������������12
Summary�������������������������������������������������������������������������������������������������������������������������������������������������������19
References Cited�����������������������������������������������������������������������������������������������������������������������������������������19

Figures
         1.     Map showing the northern Ten Thousand Islands estuary study area�������������������������������2
         2.     Map showing U.S. Geological Survey streamflow and water-quality stations in
                the northern Ten Thousand Islands estuary����������������������������������������������������������������������������4
         3.     Photograph showing Faka Union weir, September 2009��������������������������������������������������������5
         4.     Photograph showing U.S. Geological Survey streamflow and water-quality
                station at Faka Union River, June 2018��������������������������������������������������������������������������������������8
         5.     Graph showing monthly and annual rainfall in the northern Ten Thousand
                Islands estuary, water years 2007–19, calculated using data obtained from the
                South Florida Water Management District rainfall stations, Dan House Prairie
                and Southern Golden Gate Estates��������������������������������������������������������������������������������������������9
         6.     Graphs showing annual flow at tidal tributaries, water years 2008 and 2011–19������������11
         7.     Graph showing flow contributed by Pumpkin River, Faka Union River, and East
                River, water years 2008, 2011, and 2014–19 and annual rainfall totals at Dan
                House Prairie�������������������������������������������������������������������������������������������������������������������������������12
         8.     Boxplots showing monthly flow data by station��������������������������������������������������������������������13
         9.     Graphs showing monthly rainfall at Dan House Prairie and flow at Pumpkin
                River, East River, and Faka Union River, water years 2007–19, and monthly
                rainfall at Dan House Prairie and flow at East River and Pumpkin River��������������������������14
       10.      Boxplots showing salinity data by station and water year��������������������������������������������������16
       11.      Graph showing monthly mean salinity values by station, July 2006–
                September 2019, Ten Thousand Islands estuary area����������������������������������������������������������17
vi

     Tables
           1.      Monitoring station names, station numbers, periods of water quality and flow
                   record, and percentages of monthly means estimated if insufficient data were
                   collected, northern Ten Thousand Islands estuary, Florida��������������������������������������������������7
           2.      Seasonal-Kendall trend analysis for rainfall by station���������������������������������������������������������9
           3.      Percentage of total monthly flow that was negative during water years 2008
                   and 2011–19 in the northern Ten Thousand Islands estuary�����������������������������������������������15
           4.      Trend analysis of rainfall-adjusted flow by station���������������������������������������������������������������15
           5.      Percentage of instantaneous salinity values greater than or equal to 35.0 parts
                   per thousand, water years 2007–08 and 2011–19, in the northern Ten Thousand
                   Islands estuary����������������������������������������������������������������������������������������������������������������������������17
           6.      Maximum and minimum monthly salinity means, water years 2007–08 and
                   2011–19, in the northern Ten Thousand Islands estuary������������������������������������������������������18
           7.      Trend analysis on rainfall-adjusted salinity by station���������������������������������������������������������18

     Conversion Factors
     U.S. customary units to International System of Units

                              Multiply                                        By                                       To obtain
                                                                             Length
      inch (in.)                                                       2.54                 centimeter (cm)
      foot (ft)                                                        0.3048               meter (m)
      mile (mi)                                                        1.609                kilometer (km)
                                                                              Area
      square mile (mi2)                                                2.590                square kilometer (km2)
                                                                            Volume
      acre-foot (acre-ft)                                              1,233                cubic meter (m3)
                                                                           Flow rate
      mile per hour (mi/h)                                             1.609                kilometer per hour (km/h)
      cubic foot per second (ft3/s)                                    0.02832              cubic meter per second (m3/s)
                                                                   Trend analysis slope
      cubic foot per second per year ([ft3/s]/yr)                      0.02832              cubic meter per second per year ([m3/s]/yr)
                                                                        Precipitation
      inch per year (in/yr)                                            2.54                 centimeter per year (cm/yr)

     Datum
     Vertical coordinate information is referenced to the National Geodetic Vertical Datum of 1929
     (NGVD 29).
     Horizontal coordinate information is referenced to the North American Datum of 1983 (NAD 83).
     Elevation, as used in this report, refers to distance above the vertical datum.
vii

Abbreviations
DANHP     Dan House Prairie rainfall station
FKSTRN    Fakahatchee Strand North rainfall station
FU4S_S    Faka Union Canal weir 4 spillway
NWIS      National Water Information System
ppt       parts per thousand
SFWMD     South Florida Water Management District
SGGE      Southern Golden Gate Estates
SGGEWX Southern Golden Gate Estates weather station
TTI       Ten Thousand Islands
USGS      U.S. Geological Survey
Flow Characteristics and Salinity Patterns in Tidal Rivers
Within the Northern Ten Thousand Islands, Southwest
Florida, Water Years 2007–19

By Amanda C. Booth and Travis M. Knight

                                                                    canals, which is not the case for Pumpkin and East Rivers.
Abstract                                                            East River was the second largest contributor, followed by
                                                                    Pumpkin River. East River is downstream of the Fakahatchee
     Freshwater flow to the Ten Thousand Islands (TTI)
                                                                    Stand, which is a larger contributing area than the current
estuary has been altered by the construction of the Tamiami
                                                                    contributing area for Pumpkin River. Monthly mean salinities
Trail and construction of features in the now defunct Southern
                                                                    were lowest at Faka Union River and East River, indicating
Golden Gate Estates development. This development included
                                                                    that they received a greater amount of freshwater than the sta-
four associated canals that combine into the Faka Union
                                                                    tions to the west. Negative trends in rainfall-adjusted salinity
Canal, which discharges into the TTI estuary. The Picayune
                                                                    monthly means were observed at all monitoring stations dur-
Strand Restoration Project (PSRP) was initiated in 2007 to
                                                                    ing the study period. Increased trends in flow and decreased
improve freshwater delivery to the TTI estuary by remov-
                                                                    trends in salinity are attributed to increases in flow from
ing hundreds of miles of roads, emplacing hundreds of canal
                                                                    upstream canals.
plugs, removing exotic vegetation, and constructing three
pump stations. Quantifying the tributary flows and salinity
patterns prior to, during, and after the restoration is essential
to assessing the effectiveness of upstream restoration efforts.     Introduction
The U.S. Geological Survey, in cooperation with U.S. Army
Corps of Engineers, initiated an ongoing study in 2006 to                 The Ten Thousand Islands (TTI) estuary of southwest
assess flow and salinity patterns in the TTI estuary. This is the   Florida (fig. 1) is part of the largest expanse of mangrove
second report by the U.S. Geological Survey describing flow         forest in the United States and provides valuable fish and wild-
characteristics and salinity patterns in the TTI area as part of    life habitat. The TTI estuary is home to large populations of
the PSRP. This report describes flow characteristics and salin-     wading birds including herons, egrets, Platalea ajaja (roseate
ity patterns for the monitoring stations at Faka Union River,       spoonbills), and Mycteria americana (wood storks). At least
Pumpkin River, and East River and includes an assessment of         200 species of fish inhabit the area (U.S. Fish and Wildlife
salinity data from the Faka Union Boundary and Blackwater           Service, 2008). More than 10 percent of the Trichechus
River water-quality stations for water years 2007–19. A water       manatus latirostris (Florida manatee) population uses the
year is defined as the 12-month period from October 1 for any       TTI estuary throughout the year (U.S. Fish and Wildlife
given year to September 30 of the following year.                   Service, 2008). The TTI serves as critical habitat, designated
     Annual and monthly variations in flow and salinity are         essential to the conservation of several threatened or endan-
often related to variations in rainfall with high and low annual    gered species, including the Florida manatee, the endangered
flows (and below average and above average salinities) typi-        Pristis pectinata (smalltooth sawfish) (Simpfendorfer and
cally occurring during years with high and low annual rainfall,     others, 2010), and Caretta (loggerhead turtle) (U.S. Army
respectively. Monthly flows typically begin increasing in           Corps of Engineers, 2020).
June and peak in September. Over the study period, positive               The TTI is home to extensive mangrove forests,
trends in rainfall-adjusted monthly flow were detected at Faka      seagrasses, and oyster reefs, which are all designated essential
Union River and East River, whereas no significant trend in         fish habitat (U.S. Army Corps of Engineers, 2020). Oyster
flow was detected at Pumpkin River. Faka Union River is the         reefs provide habitat for many species, filter nutrients and
largest contributor of freshwater to the TTI estuary, providing     particulates out of the water column, protect against coastal
over 80 percent of the annual freshwater inflow to the estuary.     erosion, sequester carbon, and are sentinels for environmen-
The Faka Union Canal is expected to be the largest contribu-        tal monitoring (Volety and others, 2014). Oysters tolerate
tor of freshwater because until the PSRP is completed, the          salinities between 0 and 42 parts per thousand (ppt), although
Faka Union Canal receives substantial drainage from multiple        the optimal salinities for growth range from 14 to 28 ppt
2   Flow and Salinity in Tidal Rivers, Ten Thousand Islands, Southwest Florida, Water Years 2007–19

                                          81˚40’                                                                                             81˚30’

                                                                                                                          FU4S_S
                                                                                                                    #

          26˚10’
                                                                                                                  75
                                                                                              f                                             S-488
                                                                                                                                                                                                                                  f
                                                                            SGGEWX                                                                    "                                                               FKSTRN

                                                                                              S-486       "                                S-487
                                                                                                                                  "

                                                                                                                                                    Merritt Canal
                                                                                                   Miller Canal

                                                                                                                       Faka Union Canal

                                                                                                                                                                        Prairie Canal
                                   951

                                                                                                  Southern Golden Gate Estates

                                                                                                                        an d
                                             41

                                                                                                                    ne S t r

                                                                                                                                                                                                S t r an d
                                                   TA
                                                      MIAM

                                                                                                                  Picay u
                                                           IT
                                                               RA
                                                                 IL

                                                                                                                                                                                              atchee
          26˚00’                                                                                                                                                                                          Figure 2 area
                                                                                     f

                                                                                                                                                                                            F ak ah
                                                                      COLLISEM
                                                                                                                                                                    f
                                                                                                                                                                    DANHP

                                                                                                                                          Faka
                                                                                                                                             #
                                                                                                                                                                                                                                 ¬
                                                                                                                                                                                                                                 29

                                                          92

                                                                                                                                                                                  41
                      Marco
                      Island
                                                                                                             Pumpkin
                                                                                                               Bay

                                                                      Ten
                                                                            Tho
                                                                               usa
                                                                                  nd
                                                                                       Isla
                                                                                           nds
                                                                                                                                                                                                             Ch
                                                                                                                                                                                                                 ok
                                                                                                                                                                                                                   olo
                                                                                                                                                                                                                      ske
                                          Cape                  GU                                                                                                                                                       eB
          25˚50’                         Romano                       LF                                                                                                                                                    ay
                                                                            OF
                                                                                  ME
                                                                                       XIC
                                                                                              O

                   Base from U.S. Geological Survey and Wildlife                                                  EXPLANATION                                                           0                    2                4 MILES
                   Service digital data, Albers Conical Equal Area
                                                                                               Fakahatchee Strand Preserve State Park                                                   0             2           4 KILOMETERS
                   North American Datum of 1983
                                                                                               Picayune Strand State Forest
                                  FLORIDA                                                      Collier-Seminole State Park aquatic boundary
                                                                                               Ten Thousand Islands National Wildlife Refuge
                                                                                                 aquatic boundary
                                                                                               Spreader canal
                                                                        FU4S_S       #         South Florida Water Management District flow
                                                                                                 station location and name
                                                                            S-486    "         Pump station location and name

                                       Study
                                                                        DANHP          f       Rainfall station location and name
                                        area

                   Figure 1. The northern Ten Thousand Islands estuary study area.
Introduction  3

(Shumway, 1996). Periods of increased salinity are known to              During 2008–10, flows to the estuary were computed
make oysters more susceptible to disease (Chu and Volety,          by the USGS for all of the bridges and culverts along the
1997). Maintaining the optimal salinity range is crucial for       Tamiami Trail between County Road 92 and State Road 29
maintaining oyster health. The environmental health and            (except for the Faka Union Canal) and by the South Florida
ecological functioning of the TTI estuary is dependent upon        Water Management District (SFWMD) at the Faka Union
the quality, quantity, timing, and distribution of freshwater      Canal. The Faka Union Canal accounted for more than
deliveries to the estuary.                                         half of the flow under the Tamiami Trail during this period
      Prior to human alteration of the upstream landscape, the     (58–62 percent, depending on the year). An average of
TTI estuary received its freshwater from sheet flow from the       9 percent of the flow under the Tamiami Trail occurred west of
Fakahatchee Strand and Picayune Strand watersheds through a        the Faka Union Canal and about a third of the flow occurred
natural course of sloughs, wetlands, marshes, and rivers. This     east of the Faka Union Canal (Booth and others, 2014).
historical freshwater sheet flow was altered by the construction         The goal of the Picayune Strand Restoration Project,
of U.S. Highway 41 (fig. 1), also known as the Tamiami Trail,      a Comprehensive Everglades Restoration Plan authorized
and a number of features relating to the development of the        by Congress in 2007, is to restore flows and hydroperiods
once-planned residential community of Southern Golden Gate         in the wetlands, while reducing freshwater point releases to
Estates (SGGE) (Light, 2006). The Tamiami Trail was com-           the estuary and continuing to provide existing levels of flood
pleted in 1928 (Light 2006), creating a blockage to the natural    protection (U.S. Army Corps of Engineers, 2008). The project
drainage of the Picayune and Fakahatchee Strands. A borrow         calls for the removal of 260 mi of roads, the emplacement
canal dug along the north side of the Tamiami Trail conveys        of 100 plugs within 48 mi of existing canals, the removal of
water under the road at 35 bridges and 16 culverts between         exotic vegetation, and the construction of three pump stations
County Road 92 and State Road 29. In 2006, nine new cul-           with downstream spreader canals to restore sheet flow through
verts were constructed under the Tamiami Trail to restore sheet    the area while maintaining flood control capacity for commu-
flow to the TTI estuary as part of the Tamiami Trail Culverts      nities to the north (U.S. Army Corps of Engineers, 2008).
Project (U.S. Army Corps of Engineers, 2008).                            The SFWMD plugged 7 mi of the Prairie Canal in
      A number of features were constructed during the 1960s       Fall of 2006 in an effort to expedite restoration efforts (U.S.
as part of the 86-square-mile SGGE development, includ-            Army Corps of Engineers, 2008) and removed 65 mi of road
ing the Faka Union Canal System. This system consists of           adjacent to the canal by the fall of 2007 (Baisden and Starnes,
four canals (Miller Canal, Faka Union Canal, Merritt Canal,        2019). The roads and logging trams east of the Merritt Canal
and Prairie Canal) that were excavated to drain the area for       were degraded or removed from 2006 to 2012. Removal of
the SGGE development (fig. 1). Several roads, with adjacent        the roads and logging trams between Merritt and Faka Union
drainage ditches, diverted sheet flow into the Faka Union          Canals began in 2010, and the majority were removed by
Canal System, accelerating drainage within the watershed           the end of 2012. Plugging of the Merritt Canal began in the
and reducing wetland inundation, aquifer recharge, and base        fall of 2014 (Chuirazzi and others, 2015), and 10 mi of the
flow into the estuaries. The Miller, Merritt, and Prairie Canals   Merritt Canal were plugged by June 2015 (South Florida
ultimately combine with the Faka Union Canal, which flows          Water Management District, 2015). The Merritt Pump
southward under U.S. Highway 41, the southern boundary             Station (S-488; fig. 1) was completed in September 2014
of the SGGE. Approximately 48 miles (mi) of canals were            and is capable of pumping 810 cubic feet per second (ft3/s)
created, and 270 mi of roads were constructed, prior to the        to provide water for restoration efforts and flood control to
economic failure of the now defunct SGGE (South Florida            the north (South Florida Water Management District, 2015).
Water Management District, 2015); the canals facilitated arti-     Road removal between Faka Union Canal and Miller Canal
ficially enhanced drainage and the roads impeded the natural       began in late 2011, and by mid-2014, the majority of the road
flow patterns within the SGGE. East River (fig. 2) is located      removal between these two canals was completed (Chuirazzi
downstream of the Fakahatchee Strand and, therefore, is not in     and others, 2015). The Faka Union Pump Station (S-487;
the direct area of influence from the SGGE development.            fig. 1) construction was completed during the summer of 2017,
      Salinity maps produced by the U.S. Geological Survey         and this station is capable of pumping 2,650 ft3/s. As part of
(USGS) during 2007–10 documented the patterns of altered           the S-487 construction project, 12 mi of canal were plugged
freshwater flows to the estuary (Soderqvist and Patino, 2010).     and 100 mi of roadway were removed (Baisden and Starnes,
During periods of increased rainfall, Faka Union Canal was a       2019). The construction of the Miller Canal Pump Station
point source of high flows of freshwater, as indicated by large    (S-486; fig. 1) was completed in May of 2019. As part of the
freshwater plumes in the estuary. In addition, higher salinities   S-486 construction project, an additional 13 mi of canal were
were often observed in the inner bays west of the Faka Union       plugged and 65 mi of roadway were removed (Baisden and
Canal, particularly Pumpkin Bay (fig. 2), compared to the          Starnes, 2019). The Faka Union and Miller canal pump sta-
inner bays east of the Faka Union Canal. Areas to the west of      tions are fully operational (as of 2017 and 2019, respectively);
Faka Union are more impacted by the drainage features of the       however, they are only operated during emergency events or
SGGE, as compared to areas to the east, which receive flows        for testing until the future southwest protection feature levee is
from the Fakahatchee Strand.                                       completed (M. Simmons, U.S. Army Corps of Engineers, oral
4   Flow and Salinity in Tidal Rivers, Ten Thousand Islands, Southwest Florida, Water Years 2007–19

                                                               81°35'                                                                                81°30'                                                                 81°25'

26°00'

                                         er
                                      Riv
                                    lm
                                  Pa

                                                Mud                                                                             Faka
                                                Bay
                                                                                                                                        #              41
                                                              r
                                                             Rive

                                                Blackwater

                                                                                r
                                                                             ive
                                                                #
                                                   River

                                                                            R
                                                                         ey

                                                                                                                                  Faka Union Canal

                                                                                                                                                                    r
                                                           er

                                                                                                                                                               Rive
                                                                        itn
                                                         at

                                                                                                          er
                                                                                                 Riv
                                                                        Wh
                                                       kw

                                                                                                                                                              nion
                                                     ac

                                                                                           kin

                                                                                                                                                                              iver
                                                   Bl

                                                                                         mp

                                                                                                                                                            aU

                                                                                                                                                                            eR
                                                                                       Pu
                                                                                            #

                                                                                                  Little Wood River

                                                                                                                                                        Fak

                                                                                                                                                                        tche
                                                                                  Pumpkin

                                                                                                                           er
                                                                                                                          Riv
                                                                                   River

                                                                                                                                                                     aha
                                                                                                                           od

                                                                                                                                                                  Fak
                                                                                                                        Wo
25°55'                                                                                                                      Faka
                                                                                                                            Union       #
                                                                                                                            River
                                                                                                                                                                                              r
                                                                                                                                                                                          Rive
                                                                                                                                                                                     Ea
                                                                                                                                                                                       st     #
                                                                                                                                                                                                  East

                                                                                                                                                                                                           iver
                                                                                                                                                                                                  River

                                                                                                                                                                                                          on R
                                                                                                                                                                                                         gus
                                                                                                                                                                 Fakahatchee Bay

                                                                                                                                                                                                      Fer
                                                                                                                Faka Union Boundary                                                                                    Chokoloskee
                GU                                                                                              near Panther Key                                                                                           Bay
                     LF
                                                                                                 #
                          OF                                             Faka Union Boundary X
                               ME
                                                                                                 #
                                   XIC                                   at Channel Marker 6
                                        O

         Base map from U.S. Geological Survey and Wildlife                                      EXPLANATION                                                                                       0               1          2 MILES
         Service digital data, Albers Conical Equal Area
         North American Datum of 1983                                         #      USGS discharge and water-quality station
                                                                                                                                                                                                  0        1          2 KILOMETERS
                                                                                     USGS water-quality station
                                                                              #
                                                                              X      USGS water-quality station (destroyed 2017)
                                                                              #
                                                                              #      SFWMD discharge station
                                                                         SFWMD       South Florida Water Management District
                                                                             USGS    U.S. Geological Survey

         Figure 2. U.S. Geological Survey streamflow and water-quality stations in the northern Ten Thousand Islands estuary.

commun., 2020). Future Picayune Strand Restoration Project                                                            This ongoing study is in cooperation with the U.S. Army
work will include construction of the southwest protection                                                            Corps of Engineers and was conducted as part of the Greater
feature levee to provide flood risk protection for the agri-                                                          Everglades Priority Ecosystems Science Program.
cultural lands to the southwest of the project (projected start
2021). Miller Boulevard and Tram Road are anticipated to be
removed by 2022. The east-west “stair-step” canal and the
                                                                                                                      Purpose and Scope
Faka Union Canal are anticipated to be plugged in 2021 and                                                                  The purpose of this report is to describe the flow
the Miller Canal will be plugged after the completion of the                                                          characteristics and salinity patterns within the northern parts
southwest protection feature (M. Simmons, U.S. Army Corps                                                             of the TTI estuary between water year 2007 and 2019, a period
of Engineers, oral commun., 2020).                                                                                    when many restoration activities occurred in the watershed.
     Quantifying the tributary flows and salinity patterns in                                                         This report expands upon the findings of a preceding report
the TTI estuary before and after the restoration measures just                                                        (Booth, 2016) that assessed flow characteristics and salinity
described is essential to accurately assess the effectiveness of                                                      patterns in the study area between 2007 and 2014. Blackwater
restoration efforts. To address this need, the USGS initiated a                                                       River flow data collection was discontinued in 2015 and there-
study in 2006 to monitor flow and salinity in the TTI estuary.                                                        fore, data for this site were not included in this analysis. All
Introduction  5

data presented within this report are grouped by water year,        variability of streamflow and salinity across these stations and
which is defined as October 1 of the previous calendar year to      includes a trend analysis of rainfall-adjusted streamflow and
September 30 of the current calendar year. For example, water       rainfall-adjusted salinity.
year 2019 is from October 1, 2018, to September 30, 2019.
      This report focuses on flow and salinity in tidal rivers
within the TTI National Wildlife Refuge and Collier-Seminole        Description of Study Area
State Park (fig. 1) and on how both variables are affected by
                                                                         The TTI estuary is a shallow, subtropical estuarine
upland restoration activities. Flow and salinity data (the latter
computed from continuous specific conductance measure-              system that consists of numerous bays separated from the Gulf
ments as described by Wagner and others [2006]) are pre-            of Mexico by many small mangrove islands and tidal passes.
sented and discussed for three USGS stations on the Faka            The TTI geomorphology can be attributed to oyster and
Union River, Pumpkin River, and East River (fig. 2). Salinity       vermetiform gastropod reefs that provided substrate for man-
data are also presented and discussed for two additional            grove settlement (Volety and others, 2009). Ten major rivers
USGS stations, Blackwater River and Faka Union Boundary             contribute freshwater to the northern TTI estuary (fig. 2). Flow
(fig. 2). Additional flow data are presented and discussed for      to these rivers is controlled by topography and canal inputs
SFWMD stations on Faka Union Canal and the Faka Union               (McCoy, 1972). Faka Union Canal flow is controlled by a
Canal weir 4 spillway (Faka and FU4S_S respectively; figs. 1        fixed crest weir (fig. 3) with an elevation of 2 feet (ft) above
and 2). Rainfall from three SFWMD stations were also used           the National Geodetic Vertical Datum of 1929 (South Florida
in this analysis, the Southern Golden Gate Estates weather          Water Management District, 2013) and accounts for the
station, Dan House Prairie station, and Fakahatchee Strand          majority of flow to the estuary. Local hydrology is affected by
North station (SGGEWX, DANHP, and FKSTRN; fig. 1).                  semidiurnal mixed tides with a range of approximately 3 ft.
Flow, water temperature, specific conductance, and salinity              Positive and negative flows occur at all stations. Positive
data collected by the USGS are available for download from          flow indicates flow to the Gulf of Mexico, and negative flow
the National Water Information System (NWIS) database               indicates reverse flow. For the purpose of this report, Faka
(U.S. Geological Survey, 2021). Rainfall and flow data from         Union River refers to the USGS flow station that measures
the SFWMD stations are available for download from the              flow downstream from the confluence of the Faka Union
DBHYDRO database (South Florida Water Management                    Canal and the Faka Union River. Flow at Faka Union River
District, 2020). This report describes the annual and monthly       can be negative even when the flows are positive at nearby

                 Figure 3. Faka Union weir, September 2009.
6   Flow and Salinity in Tidal Rivers, Ten Thousand Islands, Southwest Florida, Water Years 2007–19

rivers, potentially because of flow controlled by the weir.          DBHYDRO database interface for Faka Union Canal at the
Negative cumulative flows are likely caused by water moving          weir, and Faka Union Canal weir 4 spillway (South Florida
in with the flooding tide and not flowing out toward the Gulf        Water Management District, 2020) to provide additional
with the ebbing tide. During high tide, the water can breach         insights on flow into the study area. The Faka station is
the tributary banks and flood the tidal wetlands; when the tide      referred to as the Faka Union Canal throughout the report.
recedes, some of the water remains in the tidal wetlands.                  The Faka Union Boundary station was initially located
      The sea level rise trend is estimated at 0.122 inches          on channel marker 6. During Hurricane Irma in 2017, the sta-
per year (in/yr) with a confidence interval of plus or minus         tion was destroyed and rebuilt near Panther Key in November
0.017 in/yr, from 1965 to 2020 for Naples, Florida (National         of 2017, which is slightly upstream from the original loca-
Oceanic and Atmospheric Administration, 2021), which is              tion (fig. 2). For the purpose of this report, data from the two
located approximately 14 mi northwest of Marco Island. This          locations are combined and referred to as the Faka Union
is similar, within 0.039 in/yr, to trends observed along the         Boundary. Because the station was moved near the end of
west coast of Florida (National Oceanic and Atmospheric              the study period, a trend analysis was not completed for Faka
Administration, 2021).                                               Union Boundary, but these data were summarized to charac-
      The climate is subtropical with an average annual rainfall     terize monthly and annual variability.
of 54 inches (in.) (Chuirazzi and others, 2015). The majority              Specific conductance and temperature were monitored
of the rainfall occurs during June through October. Summer           at 15-minute intervals at all USGS stations (table 1) using
rainfall events are typically short, intense, and frequent. Winter   a YSI 600R, YSI 600XL, or Satlantic Seabird. Instruments
rainfall events are typically associated with weather fronts and     were quality assured using standard USGS guidelines out-
are longer, less intense, and not as frequent as summer rainfall     lined by Wagner and others (2006). Near-surface and near-
events (McCoy, 1972).                                                bottom salinity monitors were initially installed at all stations,
                                                                     with the exception of the Faka Union Boundary, to describe
                                                                     stratification. Near-surface salinity monitors were installed
Methods of Investigation                                             in floating mounts and recorded data at approximately 1 ft
                                                                     below the water surface. Near-surface salinity was discontin-
      Stage, flow, specific conductance, and temperature data        ued at all stations in 2011 because of minimal stratification
were collected at USGS sites and supplemented by flow and            observed in the water column. Near-bottom salinity monitors
rainfall data collected at SFWMD sites. Monthly mean flow            were installed at depths ranging from 4 to 8 ft below the water
and salinity values were computed from the data or estimated         surface. Water-quality monitoring data were processed using
if insufficient data were available. Flow and salinity data were     standard USGS methods (Wagner and others, 2006) at all
statistically analyzed for trends and for abrupt changes if          USGS stations.
trends were found to be statistically significant.                         Rainfall data were downloaded from the SFWMD
                                                                     DBHYDRO database (South Florida Water Management
                                                                     District, 2020) for three stations. Data from rainfall station
Data Collection                                                      DANHP, located within Fakahatchee Strand Preserve State
                                                                     Park (fig. 1), and rainfall station SGGEWX were used in
      Continuous measurements of stage and flow were measured        this analysis. Rainfall data consist of measurements from a
at several USGS river stations within the TTI estuary as part        rain gage augmented with radar-based rainfall data. Prior to
of this study (table 1; figs. 2 and 4). Stage data were collected    October 2007, rainfall data consist solely of data obtained
using shaft encoders or pressure sensors. Acoustic Doppler           from the rain gage, because data augmented with radar-based
velocity meters collected index velocity measurements.               data were not available. Missing data for May and June 2007
Manual measurements of flow were made over a wide range of           at DANHP were estimated to be zero based on data from a
conditions by hydrologic technicians approximately 6 days per        rainfall station about 13 mi north-northeast of DANHP—the
year using acoustic Doppler current profilers. The index veloc-
                                                                     Fakahatchee Strand North rainfall station (FKSTRN, fig. 1).
ity method, which uses the relation between the mean channel
velocity (as measured by the acoustic Doppler current profiler)
and the index velocity (as measured by the acoustic Doppler          Data Analysis
velocity meter), was used to compute flow, using standard
USGS methods (Levesque and Oberg, 2012). Data were tid-                   Monthly mean flow and salinity values were calculated
ally influenced at all monitoring stations, and therefore, flow      with Aquarius software using instantaneous values if no more
data were filtered with the Godin low-pass filter to remove          than 10 percent of the data for that month were missing. If
tidal frequencies according to USGS policy (Godin, 1972;             more than 10 percent of the data were missing, the monthly
U.S. Geological Survey, 2010).                                       data were estimated by first estimating the missing daily
      Data were summarized to mean daily values and stored           values using linear interpolation of observed data and then
in the NWIS database (U.S. Geological Survey, 2021).                 averaging these observed and estimated daily values for each
Additional flow data were obtained from the SFWMD                    month. Monthly mean flow data were converted to acre-feet
Table 1. Monitoring station names, station numbers, periods of water quality and flow record, and percentages of monthly means estimated if insufficient data were collected,
northern Ten Thousand Islands estuary, Florida.
[USGS, U.S. Geological Survey; --, not applicable; SFWMD, South Florida Water Management District; FU4S-S, Faka Union Canal weir 4 spillway; Faka, Faka Union Canal]

                                                                                                                             Percentage                                        Percentage
                                                                                                                              of monthly                                        of monthly
        Station name             Agency        USGS station number                    Water-quality record                                               Flow record
                                                                                                                            salinity means                                     flow means
                                                                                                                              estimated                                         estimated
 Blackwater River               USGS          255654081350200             May 16, 2007–September 30, 2008;                         4           May 16, 2007–September 30,          --
                                                                           July 8, 2010–present                                                 2008;
                                                                                                                                                July 8, 2010–October 19,
                                                                                                                                                2015
 Pumpkin River                  USGS          255534081324000             April 18, 2007–September 30, 2008;                       6           April 19, 2007–September 30,        9
                                                                            July 7, 2010–present                                                 2008;
                                                                                                                                                 July 7, 2010–present
 Faka Union River               USGS          255432081303900             June 30, 2006–September 30, 2008;                        4           June 30, 2006–September 30,         9
                                                                            May 11, 2010–present                                                 2008;
                                                                                                                                                 May 12, 2010– present
 Faka Union Boundary at         USGS          255123081321300             June 13, 2007–September 30, 2008; July 9,                --          --                                  --
   Channel Marker 6                                                         2010–May 1, 2012; July 30, 2015–
                                                                            September 10, 2017
 Faka Union Boundary near USGS                255138081321701             November 7, 2017–present                                 --          --                                  --
   Panther Key, Florida
 East River                     USGS          255327081275900             April 24, 2007–September 30, 2008;                       2           April 24, 2007 –September 30,       6
                                                                            April 23, 2010–present                                               2008;
                                                                                                                                                 April 23, 2010–May 1,
                                                                                                                                                 2012;
                                                                                                                                                 October 28, 2013–present
 FU4S_S                         SFWMD                     --                                    --                                 --          April 26, 2007–present              --
 Faka                           SFWMD                     --                                    --                                 --          April 21, 1986–present              --
                                                                                                                                                                                             Methods of Investigation   7
8   Flow and Salinity in Tidal Rivers, Ten Thousand Islands, Southwest Florida, Water Years 2007–19

                                                                   defined seasons as months to account for seasonal changes
                                                                   in rainfall. The Seasonal-Kendall test can be run on datasets
                                                                   with nonnormal distributions and is not sensitive to outliers.
                                                                   The test assumes no serial correlation is present in the data.
                                                                   Each dataset was tested for serial correlation using the rank
                                                                   version of the von Neumann test for autocorrelation within
                                                                   the EnvStats package.
                                                                         Exogenous variables represent natural phenomena that, in
                                                                   addition to time, can influence the response of time series data.
                                                                   Accounting for the explanatory value of exogenous variables
                                                                   on the response variable reduces the background variation
                                                                   of time series data and increases the ability of the trend test
                                                                   to discern meaningful temporal changes. Monthly rainfall
                                                                   totals were used as the exogenous variable for the analysis
                                                                   of both salinity and flow to reduce the influence of variations
                                                                   in rainfall on flow and salinity trends. A locally weighted
                                                                   smoothing (LOESS) curve of the response variable (flow or
                                                                   salinity) versus the exogenous variable (rainfall) was used to
                                                                   generate rainfall-adjusted flow and rainfall-adjusted salinity.
                                                                   The Seasonal-Kendall test was performed on the residuals
                                                                   of the LOESS curves for all available data from July 2006 to
                                                                   September 2008 and May 2010 to September 2019. DANHP
                                                                   data were used for rainfall for all analyses with the excep-
                                                                   tion of flow at FU4S_S, where rainfall data from SGGEWX
                                                                   were used. Trends in rainfall (July 2006 to September 2019)
                                                                   were also evaluated using the Seasonal-Kendall test without
                                                                   accounting for an exogenous variable.
                                                                         Pettitt’s test for change-point detection (Pettitt, 1979)
                                                                   was used to test for abrupt changes in the time series data for
                                                                   a given location if the Seasonal-Kendall test found a sig-
                                                                   nificant trend. The Pettitt test was run on salinity and flow
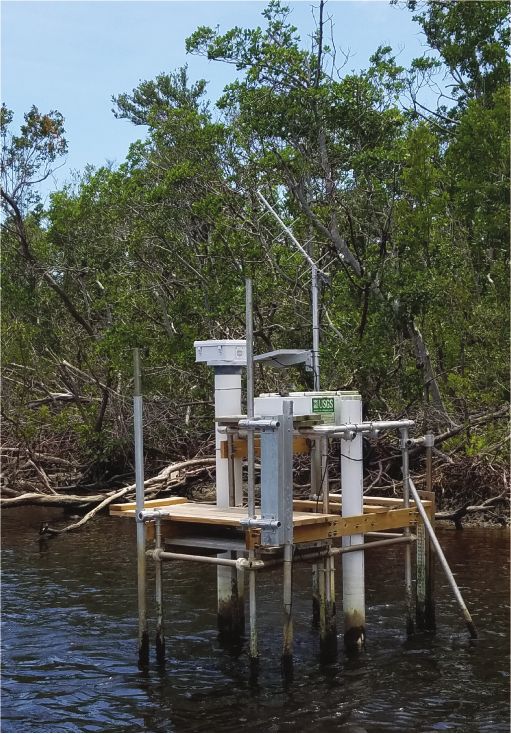
Figure 4. U.S. Geological Survey streamflow and water-quality      data from July 2006 to September 2008 and May 2010 to
station at Faka Union River, June 2018.                            September 2019 using the R package Trend (Pohlert, 2020).
                                                                   The result of the Pettitt test gives the first significant change in
                                                                   the time series being tested. The significance level was defined
and multiplied by the number of days in the month to compute       as α = 0.05 for all tests.
the cumulative volume of flow over each month; the sum
of monthly volumes was then used to calculate annual flow.
Annual and monthly flows, as well as monthly mean salinity
values, differ slightly from the calculations presented in Booth
                                                                   Annual and Monthly Variability and
and others (2014) because of rounding differences between          Trends in Rainfall
Excel software used previously and the Aquarius software
used in this current analysis. The relative percent differences         The average annual rainfall at DANHP for 2007–19
in annual flow between this report and the previous report         was 54.1 in. and at SGGEWX for 2008–19 was 63.1 in.
range from –0.68 percent (absolute difference 10 acre-feet) to     (South Florida Water Management District, 2020). The high-
3.03 percent (absolute difference of 6 acre-feet).                 est yearly rainfall occurred in water year 2017 (85.8 in. at
      Statistical analysis was conducted using R (R Core           DANHP and 89.0 in. at SGGEWX), and the lowest yearly
Team, 2020), and the EnvStats R package (Millard, 2013) was        rainfall was in 2011 (39.9 in. at DANHP and 47.4 in. at
used for the Seasonal-Kendall tests. The Seasonal-Kendall          SGGEWX) (fig. 5). The monthly mean rainfall, across all
test is a nonparametric test used to detect monotonic trends,      months, for the study period was 4.5 in. at DANHP and 5.3 in.
and it runs a Mann-Kendall trend test on each of the seasons       at SGGEWX. Monthly mean rainfall averaged less than 2 in.
defined (Helsel and others, 2020). The Seasonal-Kendall            during November–April at both stations. Typically, the highest
test within the EnvStats package indicates the direction of        rainfall amounts were observed during June–September. At
the trend based on the Kendall tau, the rate of change using       DANHP the highest monthly rainfall total during the study
the Theil-Sen slope estimate, and a comparison of seasonal         period was 22.6 in. for June 2017, followed by 21.2 in. for
slopes using the chi-square heterogeneity test. The analysis       September 2017. At SGGEWX the highest monthly rainfall
Annual and Monthly Variability and Trends in Rainfall   9

                        100
                                                                                   EXPLANATION
                                                                                                 October
                                                                                                 November
                                                                                                 December
                                                                                                 January
                         80                                                                      February
                                                                                                 March
                                                                                                 April
                                                                                                 May
                                                                                                 June
                                                                                                 July
                                                                                                 August
                                                                                                 September
                         60
  Rainfall, in inches

                         40

                         20

                          0
                                 2007 DANHP

                                                   2008 DANHP
                                                                2008 SGGEWX

                                                                              2009 DANHP
                                                                                           2009 SGGEWX

                                                                                                         2010 DANHP
                                                                                                                      2010 SGGEWX

                                                                                                                                     2011 DANHP
                                                                                                                                                  2011 SGGEWX

                                                                                                                                                                2012 DANHP
                                                                                                                                                                             2012 SGGEWX

                                                                                                                                                                                            2013 DANHP
                                                                                                                                                                                                         2013 SGGEWX

                                                                                                                                                                                                                       2014 DANHP
                                                                                                                                                                                                                                    2014 SGGEWX

                                                                                                                                                                                                                                                  2015 DANHP
                                                                                                                                                                                                                                                               2015 SGGEWX

                                                                                                                                                                                                                                                                             2016 DANHP
                                                                                                                                                                                                                                                                                          2016 SGGEWX

                                                                                                                                                                                                                                                                                                        2017 DANHP
                                                                                                                                                                                                                                                                                                                     2017 SGGEWX

                                                                                                                                                                                                                                                                                                                                   2018 DANHP
                                                                                                                                                                                                                                                                                                                                                2018 SGGEWX

                                                                                                                                                                                                                                                                                                                                                              2019 DANHP
                                                                                                                                                                                                                                                                                                                                                                           2019 SGGEWX
                                                                                                                                                                Water year and station name

                              Figure 5. Monthly and annual rainfall in the northern Ten Thousand Islands estuary, water years 2007–19, calculated
                              using data obtained from the South Florida Water Management District rainfall stations, Dan House Prairie (DANHP)
                              and Southern Golden Gate Estates (SGGEWX).

total during the study period was 25.8 in. for September 2017,                                                                                                                                trend in monthly rainfall totals at DANHP from July 2006
followed by 20.1 in. for June 2017. September 2017 rainfall                                                                                                                                   to September 2019 and at SGGEWX from October 2007 to
data were influenced by Hurricane Irma. June 2017 rainfall                                                                                                                                    September 2019 (table 2). There was also no significant dif-
data were influenced by an area of low pressure in the Gulf of                                                                                                                                ference in the trends between the months at either rain gage,
Mexico (National Oceanic and Atmospheric Administration                                                                                                                                       based on the chi-square p-values (table 2).
and National Weather Service, 2017). The 2016 water                                                                                                                                                Two named tropical systems affected the area during the
year was unique in that 12.6 in. of rain were measured at                                                                                                                                     study period after making their initial landfall in the Florida
DANHP and 12.1 in. of rain were measured at SGGEWX in                                                                                                                                         Keys. Tropical Storm Fay made landfall at Cape Romano,
January. Excluding 2016, the average rainfall in January for                                                                                                                                  Florida, shortly before 5 a.m. on August 19, 2008, with
the study period was 1.3 and 1.4 in., respectively, at these                                                                                                                                  maximum sustained winds of 60 miles per hour (National
sites. The Seasonal-Kendall test indicated that there was no                                                                                                                                  Oceanic and Atmospheric Administration, 2008). DANHP

                                              Table 2. Seasonal-Kendall trend analysis for rainfall by station.
                                              [DANHP, Dan House Prairie rainfall station; SGGEWX, Southern Golden Gate Estates weather station]

                                                                                                                                                                                            Trend                                                                                         Seasonal p-value
                                                                 Station                                                            Trend                                                                                                         Tau
                                                                                                                                                                                           p-value                                                                                             (chi)
                                               DANHP                                                          No trend                                                                     0.732                                                  0.024                                                 0.778
                                               SGGEWX                                                         No trend                                                                     0.096                                                  0.107                                                 0.531
10   Flow and Salinity in Tidal Rivers, Ten Thousand Islands, Southwest Florida, Water Years 2007–19

recorded 2.8 in. of rain on August 18 and 2.9 in. of rain on       Pumpkin River were observed during August and September.
August 19 (South Florida Water Management District, 2020).         The high monthly flows in August and September 2017 can
Hurricane Irma made landfall near Marco Island, Fla., as           be attributed to the large amount of rainfall between June
a category 3 with winds of 115 miles per hour (Cangialosi          and August (54.4 in. for 3 months). An additional 21.2 in.
and others, 2017). DANHP recorded 1.5 in. of rain on               fell in the month of September and can be partially attrib-
September 9, 2017, and 12.6 in. of rain on September 10            uted to Hurricane Irma in 2017. Increases in monthly flows
(South Florida Water Management District, 2020). Rainfall          corresponded with increases in monthly rainfall (fig. 9).
from both storms substantially affected the area by increasing           The percentage of monthly flows that were negative
flows and decreasing salinities.                                   varied widely between years and stations, ranging from 0 to
                                                                   58 percent (table 3). For a given site, variation among years
                                                                   was as high as 50 percent. For a given year, variation among
                                                                   sites was also as high as 50 percent. Total monthly flows were
Flow Characteristics and Salinity                                  negative during 19, 29, and 31 percent of the study period for
Patterns in the Ten Thousand Islands                               Faka Union, East, and Pumpkin Rivers, respectively.

      Faka Union River was found to be the largest contributor
of freshwater to the TTI estuary, followed by East River and       Trends in Flow
Pumpkin River. This observation was to be expected because
                                                                         Positive trends in rainfall-adjusted flow were found at
the restoration is not complete, and most of the Picayune
                                                                   four of the stations, and no trend was observed at Pumpkin
Strand State Forest and Northern Golden Gate Estates drains
                                                                   River (table 4). The monthly slopes for each river were not
into the Faka Union Canal. East River receives the majority of
                                                                   significantly different at any of the monitoring stations, based
its flow from the Fakahatchee Strand, which is less anthropo-
                                                                   on the chi-square heterogeneity test p-value. The trend analy-
genically influenced compared to the Picayune Strand (fig. 1).
                                                                   sis slope of 15.02 cubic feet per second per year ([ft3/s]/yr)
Most sites showed positive trends in rainfall-adjusted monthly
                                                                   for the USGS Faka Union River station is slightly higher than
flow, and all sites showed negative trends in rainfall-adjusted
                                                                   the 14.19-(ft3/s)/yr slope for the Faka Union Canal SFWMD
monthly salinity. Salinities varied widely, were affected by
                                                                   station, indicating that in addition to the canal inputs, the
freshwater inputs, and generally were higher at stations in the
                                                                   Faka Union River contributes to the total flow registered at
western part of the study area than in the eastern part.
                                                                   the USGS Faka Union River station. The confidence intervals
                                                                   for the trend analysis slope at Faka Union Canal and Faka
Annual and Monthly Flow Characteristics of                         Union River overlap, indicating that the slope for both stations
Tidal Rivers                                                       may be equivalent. The increase in flow at East River was
                                                                   2.73 (ft3/s)/yr. Increases in flow at Faka Union and East Rivers
      Annual and monthly flow characteristics were calculated      may be due to an increase in flow into the study area from
for three tidal rivers, Faka Union River, Pumpkin River, and       canals upstream. FU4S_S is located on the Faka Union Canal
East River. Annual flow was highest at Faka Union River and        north of I–75 and provides insight about water entering the
Pumpkin River in 2017 and at East River in 2016 (fig. 6).          study area. The flow trend was positive for FU4S_S, indicat-
Annual flow was lowest in 2011 at Pumpkin and East Rivers          ing that increased flows downstream could be attributed to an
(no data were recorded in 2012 and 2013 at East River) and         increase in canal flows upstream. The trend slope at FU4S_S
lowest in 2015 at Faka Union River.                                was not calculated because of the number of zero-flow
      Comparison of flow at East River, Faka Union River, and      periods at the station. Increased flows to the study area from
Pumpkin River showed that Faka Union River accounted for           canals upstream are likely distributed through the Faka Union
83–95 percent of the monitored flow, depending on the year,        Canal or to the east of it. No increased flow was expected
over the study period (fig. 7). During the years with the lowest   at Pumpkin River, because any increase would be funneled
rainfall (2008 and 2011), flow contribution percentages for        toward the Faka Union Canal.
East River were lowest and those for Faka Union were high-               The results from the Pettitt test show a significant
est. Pumpkin River contributions varied minimally throughout       change in flow at Faka Union River and Faka Union Canal
the study period, ranging from 0 to 2 percent.                     in August 2015, coinciding with the initial operations
      Monthly flows at the three tidal river stations vary over    of the upstream pump, S-488, as well as the plugging of
the course of a year (figs. 8 and 9A). On average, flows peak      Merritt Canal. The Pettitt test is not presented for East River
in September at all three stations. East River and Faka Union      because of the large period when data were not collected
River have similar seasonal patterns, with the lowest flows        in 2012 and 2013. While the Pettitt test was not run at
occurring in April and May. The seasonal pattern of flows at       FU4S_S because of the large periods of zero flow, the mean
Pumpkin River is less consistent, and some of the lowest flows     flow for FU4S_S from April 2007 through July 2015 was
observed occurred during June and October. Similar to the          5.1 ft3/s, compared to a mean of 18.1 ft3/s for August 2015
Faka Union River and East River, the highest monthly flows at      to September 2019.
Flow Characteristics and Salinity Patterns in the Ten Thousand Islands   11

                                      A
                              8,000
                                                                                                              7,078
                              7,000

                              6,000
                                                                                                                        5,046
Annual flow, in acre-feet
                                                                        4,909
                              5,000

                              4,000
                                          3,091                                                      3,115
                              3,000
                                                             2,324                                                                2,459

                              2,000
                                                                                 1,472     1,366
                              1,000
                                                    –208
                                 0

                            –1,000
                                          2008      2011      2012      2013      2014     2015      2016      2017      2018      2019

                                      B
                            600,000
                                                                                                              545,285

                            500,000
                                                                                                    449,482
Annual flow, in acre-feet

                            400,000                                                                                     386,518
                                                                       359,141

                            300,000
                                                             265,877
                                                                                                                                  219,088
                            200,000
                                      172,869
                                                   137,822
                                                                                 111,734
                            100,000                                                        85,424

                                 0
                                          2008      2011      2012      2013      2014     2015      2016      2017      2018      2019

                                      C
                             70,000
                                                                                                    65,105

                             60,000
                                                                                                              56,050

                             50,000
Annual flow, in acre-feet

                             40,000                                                                                     36,734

                             30,000
                                                                                                                                  22,502
                                                                                 20,598
                             20,000                                                        16,583
                                          13,297
                             10,000                 6,993

                                 0
                                          2008      2011      2012      2013      2014     2015      2016      2017      2018      2019
                                                                                  Water year

                                      Figure 6. Annual flow at tidal tributaries, water years 2008 and
                                      2011–19: A, Pumpkin River, B, Faka Union River, and C, East River.
                                      No data were collected in 2012 and 2013 at East River.
12   Flow and Salinity in Tidal Rivers, Ten Thousand Islands, Southwest Florida, Water Years 2007–19

                                                           800,000                                                                                          100
                                                                               EXPLANATION
                                                                                                                                                            90
                                                           700,000               East River
                                                                                 Faka Union River                                                           80
                                                           600,000               Pumpkin River*

                                                                                                                                                                  Annual total rainfall, in inches
                         Annual total flow, in acre-feet
                                                                                 Rainfall                                                                   70

                                                           500,000
                                                                                                                                                            60

                                                           400,000                                                                                          50

                                                                                                                                                            40
                                                           300,000

                                                                                                                                                            30
                                                           200,000
                                                                                                                                                            20

                                                           100,000
                                                                                                                                                            10

                                                                0                                                                                           0
                                                                        2008         2011         2014        2015         2016        2017   2018   2019
                                                                                                                Water year
                                                                     *Annual total flow at Pumpkin River for 2011 is -200 acre feet,
                                                                      but is not visible on the graph because of scale

                                                                 Figure 7. Flow contributed by Pumpkin River, Faka Union River,
                                                                 and East River, water years 2008, 2011, and 2014–19 and annual
                                                                 rainfall totals at Dan House Prairie (DANHP).

Salinity Patterns and Trends in Tidal Rivers and                                                                       estuarine environment, which is an environment critical in the
                                                                                                                       life stages of many marine organisms. The highest percent-
Bays
                                                                                                                       age of instantaneous salinities greater than or equal to 35 ppt
      Annual and instantaneous salinities varied widely                                                                occurred in 2008 at Faka Union Boundary, 2011 at East River
between sites and years, and these patterns were typically                                                             and Pumpkin River, and 2017 at Blackwater River and Faka
related to proximity in time and space to freshwater inputs.                                                           Union River (table 5). The lowest percentage of salinities
Salinity tended to be highest at Faka Union Boundary com-                                                              equal to or greater than 35 ppt occurred in 2016 at Pumpkin
pared to the other stations because of its proximity to the Gulf                                                       River and Blackwater River (0.2 and 2.3 percent of the year,
of Mexico. At all stations, annual mean salinities were highest                                                        respectively). Instantaneous salinities were less than 35 ppt
in 2011, corresponding with the lowest annual rainfall total                                                           during all of 2016 at East River, Faka Union River, and Faka
during the study period (figs. 5 and 10). Annual mean salinities                                                       Union Boundary (table 5). Although 2016 did not correspond
were lowest in 2016 at all stations, coinciding with the fourth                                                        with the highest rainfall totals, it was an above average year
highest annual mean rainfall across the study period. Monthly                                                          for rainfall with 12.6 in. recorded in January.
rainfall in 2016 did not follow the typical seasonal pattern,                                                                The timing of monthly minimum and maximum salini-
with 12.6 in. of rain occurring in January, over five times the                                                        ties was similar across stations, with strong seasonal patterns
monthly average for January during the study. The maximum                                                              related to rainfall and streamflow. The lowest monthly mean
and minimum instantaneous salinities did not occur during the                                                          salinities occurred at Faka Union River and East River (fig. 11,
same years as the maximum and minimum annual mean salini-                                                              table 6) indicating they received a greater amount of freshwa-
ties. Instantaneous salinity varied widely throughout the years                                                        ter than the other sites. The minimum monthly mean at both
during this study (fig. 10). With the exception of East River,                                                         sites occurred in September 2017. The Faka Union Boundary
all of the instantaneous maximum salinity values occurred                                                              does not have data for September 2017, because the station
in 2008 and ranged from 41.2 to 43.4 ppt. The instantaneous                                                            was destroyed by Hurricane Irma. Monthly mean salinity at
maximum for East River was also 41.2 ppt but occurred in                                                               Faka Union Boundary was lowest during the previous month,
2013. The lowest instantaneous salinity values at each station                                                         August 2017. The maximum monthly salinity occurred in
occurred in 2017 and ranged from 0.2 to 1.6 ppt.                                                                       May 2008 for all stations except East River (May 2011).
      The monitoring sites west of the Faka Union canal had                                                                  Rainfall-adjusted monthly means for salinity had
the greatest percentages of salinities equal to or greater than                                                        negative trends for all stations during the study period. The
35 ppt, which indicates a seawater environment. When salini-                                                           slopes were not statistically different between months, based
ties are consistently at 35 ppt, the area does not function as an                                                      on the chi-square heterogeneity test at any of the monitoring
Flow Characteristics and Salinity Patterns in the Ten Thousand Islands   13

                               A
                       3,000

                       2,500

                       2,000
Flow, in acre-feet

                       1,500

                       1,000

                        500

                          0

                       -500
                                   Jan.    Feb.    Mar.    Apr.       May     June       July   Aug.        Sept.      Oct.    Nov.   Dec.
                               B
                     200,000

                     150,000
Flow, in acre-feet

                     100,000

                      50,000

                          0

                     -50,000
                                   Jan.    Feb.    Mar.    Apr.       May     June       July   Aug.        Sept.      Oct.    Nov.   Dec.
                               C
                      20,000

                      15,000
Flow, in acre-feet

                      10,000

                       5,000

                          0

                      -5,000
                                   Jan.    Feb.    Mar.    Apr.       May     June       July   Aug.        Sept.      Oct.    Nov.   Dec.
                                                                                 Month
                                                                                                       EXPLANATION
                                                                                                       Instantaneous minimum
                                                                                                         and maximum
                                                                                                       Maximum value
                                                                                                       3rd quartile
                                                                                                       Median
                                                                                                       1st quartile
                                                                                                       Minimum value
                                                                                                       Monthly mean

                               Figure 8. Monthly flow data by station. A, Pumpkin River, B, Faka Union River, and C, East
                               River.
14   Flow and Salinity in Tidal Rivers, Ten Thousand Islands, Southwest Florida, Water Years 2007–19

                                                                                              A
                                                            180,000

                                                                                                                                    EXPLANATION
                                                                                                                                       East River
                                                                                                                                       Faka Union River
                                                                                                                                       Pumpkin River
                                                            140,000
                       Monthly flow volume, in acre-feet

                                                            100,000

                                                                    60,000

                                                                    20,000

                                                              -20,000
                                                                                              2007   2008   2009   2010      2011   2012   2013     2014   2015   2016   2017   2018   2019

                                                                                              B
                                                                                         25

                                                                                                      EXPLANATION
                                                                                                            DANHP rainfall

                                                                                         20
                                                           Monthly rainfall, in inches

                                                                                         15

                                                                                         10

                                                                                          5

                                                                                          0
                                                                                              2007   2008   2009   2010      2011   2012   2013     2014   2015   2016   2017   2018   2019
                                                                                                                                       Water year

                                                                                          Figure 9. A, Monthly rainfall at Dan House Prairie (DANHP) and
                                                                                          flow at Pumpkin River, East River, and Faka Union River, water
                                                                                          years 2007–19. B, Monthly rainfall at DANHP and flow at East River
                                                                                          and Pumpkin River.
Flow Characteristics and Salinity Patterns in the Ten Thousand Islands   15

                                          Table 3. Percentage of total monthly flow that was negative
                                          during water years 2008 and 2011–19 in the northern Ten
                                          Thousand Islands estuary.
                                          [--, no data collected during this period]

                                                                                         Faka Union
                                                                  Pumpkin River                             East River
                                             Water year                                  River (per-
                                                                    (percent)                               (percent)
                                                                                            cent)
                                                 2008                    8                      50                58
                                                 2011                   50                       0                50
                                                 2012                    0                       0                --
                                                 2013                   25                       0                --
                                                 2014                   25                      42                 8
                                                 2015                   25                      42                17
                                                 2016                   42                       0                 8
                                                 2017                   50                       0                42
                                                 2018                    0                      25                25
                                                 2019                   50                      17                17

Table 4. Trend analysis of rainfall-adjusted flow by station.
[FU4S_S, Faka Union Canal weir 4 spillway]

                                              Trend                                     Confidence interval            Seasonal p-     Pettitt     Change
    Station name               Trend                        Tau        Slope
                                             p-value                                    Lower             Upper         value (chi)   p-value     detected
 Pumpkin River              None              0.062        0.110         0.24           −0.03              0.51           0.01          (1)          ( 1)
 FU4S_S                     Positive          0.018        0.166         (2)              (2)              (2)            0.609         (2)          ( 2)
 Faka Union Canal           Positive          0.000        0.248       14.19              7.18            21.97           0.968        0.048     Aug. 2015
 Faka Union River           Positive          0.000        0.256       15.02              7.31            25.54           0.989        0.003     Aug. 2015
 East River                 Positive          0.000        0.346        2.73              1.43             3.72           0.97          (3)          ( 3)
  1The   Pettitt test was not run for Pumpkin River data because no change was detected.
  2The   slope and Pettitt test were not run for FU4S_S data because of the large periods of zero flow.
  3The   Pettitt test was not run for East River data because of the extended period when data were not collected in 2012 and 2013.

stations. The slope of the rainfall-adjusted trend ranged from                         the initial operations of the Merritt Pump Station as well as
−0.331 ppt per year at Blackwater River to −0.515 ppt per year                         the plugging of Merritt Canal. The trend at Pumpkin River
at East River (table 7). The overlapping confidence intervals                          is proposed to be associated with increases in flow at Faka
for the annual slope indicate the overall magnitude of change                          Union River, East River, and (or) unmonitored tributaries
is similar among stations. Slopes were slightly more negative                          in addition to tidal mixing in the area, as the trend analysis
at East River and Faka Union River than other sites and had                            showed no increase in flows at Pumpkin River. The May 2013
increasing trends in streamflow over this time.                                        change timeframe at Faka Union River (p-value = 0.045)
      The Pettitt test indicates that the trends at East River and                     does not have a clear association with activities related to
Pumpkin River were due to an abrupt change in August 2015                              restoration efforts.
(table 7). The August 2015 change period corresponds with
16   Flow and Salinity in Tidal Rivers, Ten Thousand Islands, Southwest Florida, Water Years 2007–19

                                              A                                                                                                   B
                                         45                                                                                                  45

                                         40                                                                                                  40
       Salinity, in parts per thousand

                                                                                                           Salinity, in parts per thousand
                                         35                                                                                                  35

                                         30                                                                                                  30

                                         25                                                                                                  25

                                         20                                                                                                  20

                                         15                                                                                                  15

                                         10                                                                                                  10

                                          5                                                                                                   5

                                          0                                                                                                   0
                                                  2008 2011 2012 2013 2014 2015 2016 2017 2018 2019                                               2008 2011 2012 2013 2014 2015 2016 2017 2018 2019

                                              C                                                                                                   D
                                         45                                                                                                  45

                                         40                                                                                                  40
       Salinity, in parts per thousand

                                                                                                           Salinity, in parts per thousand
                                         35                                                                                                  35

                                         30                                                                                                  30

                                         25                                                                                                  25

                                         20                                                                                                  20

                                         15                                                                                                  15

                                         10                                                                                                  10

                                          5                                                                                                   5

                                          0                                                                                                   0
                                                  2007 2008 2011 2012 2013 2014 2015 2016 2017 2018 2019                                              2008   2011     2016     2017   2018   2019
                                                                                                                                                                          Year
                                              E
                                         45

                                         40
       Salinity, in parts per thousand

                                         35                                                                                                                         EXPLANATION
                                                                                                                                                                    Instantaneous minimum
                                         30                                                                                                                           and maximum
                                                                                                                                                                    Maximum value
                                         25                                                                                                                         3rd quartile
                                                                                                                                                                    Median
                                         20                                                                                                                         1st quartile
                                                                                                                                                                    Minimum value
                                         15
                                                                                                                                                                    Annual mean
                                         10

                                          5

                                          0
                                                  2008 2011 2012 2013 2014 2015 2016 2017 2018 2019
                                                                          Year

                                              Figure 10. Salinity data by station and water year. A, Blackwater River, B, Pumpkin River, C, Faka Union
                                              River, D, Faka Union Boundary, and E, Blackwater River. The data for 2018 and 2019 at Faka Union Boundary
                                              are from Faka Union Boundary at Panther Key.
You can also read