Homeland Security Report of the International Ice Patrol in the North Atlantic - United States Coast Guard - US Coast Guard Navigation Center
←
→
Page content transcription
If your browser does not render page correctly, please read the page content below
3          Homeland United States
           Security Coast Guard

    Report of the
    International Ice Patrol
    in the North Atlantic

    2009 Season
    Bulletin No. 95
    CG-188-64
3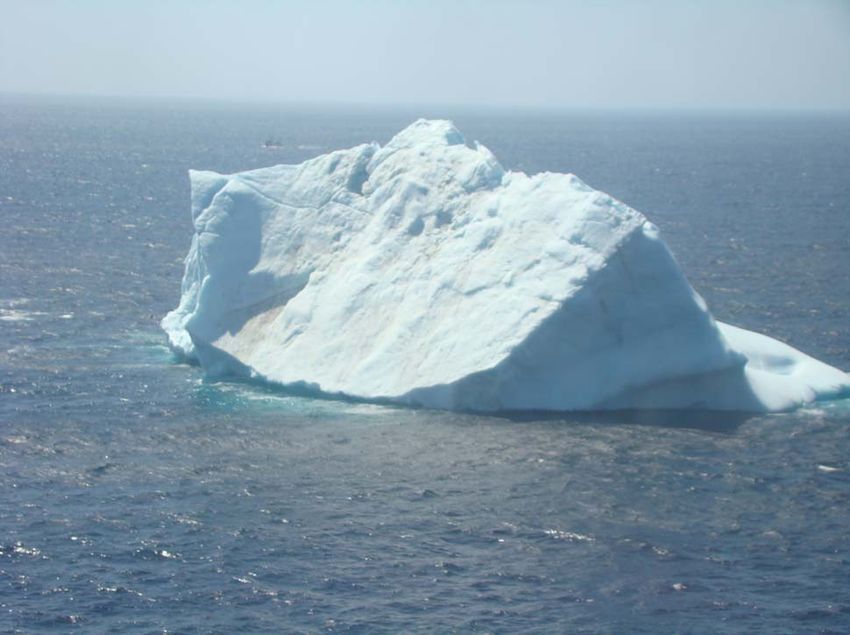
International Ice Patrol
2009 Annual Report
Contents
Abbreviations and Acronyms .........................................................................................2
Introduction ......................................................................................................................4
Summary of Operations ..................................................................................................5
Iceberg Reconnaissance and Oceanographic Operations .........................................11
Ice and Environmental Conditions ...............................................................................18
Monthly Sea-Ice Charts .................................................................................................32
Biweekly Iceberg Charts................................................................................................40
Acknowledgements .......................................................................................................54
Appendix A: Nations Supporting International Ice Patrol .........................................55
Appendix B: Ship Reports for Ice Year 2009 ..............................................................56
Appendix C: Aerial Iceberg Reconnaissance Platforms (2008-2009) .......................62
Appendix D: Commercial Reconnaissance Study .....................................................65
To order past IIP Annual Reports use the form provided inside the back cover
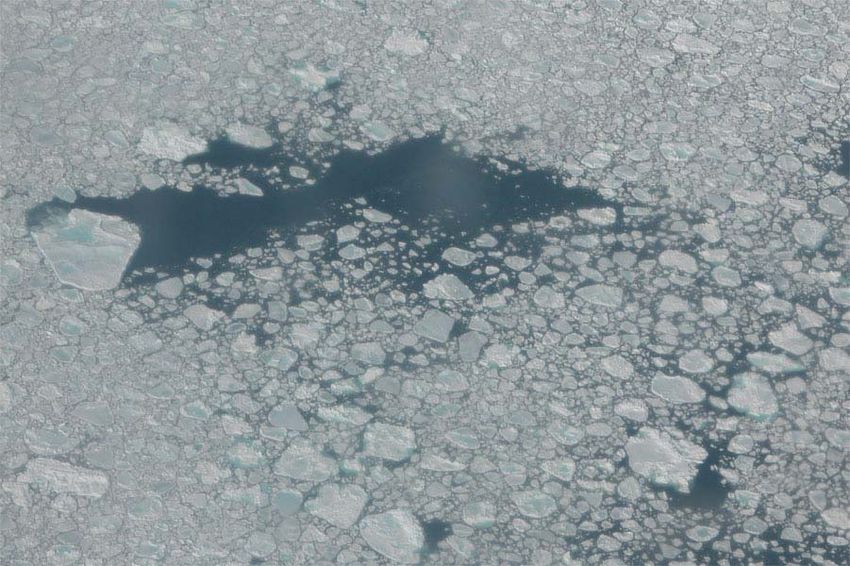
Cover Photograph: An iceberg visually detected in May 2009 during
IRD 7. For the first time in over 20 years IIP conducted primarily visual
iceberg reconnaissance.
1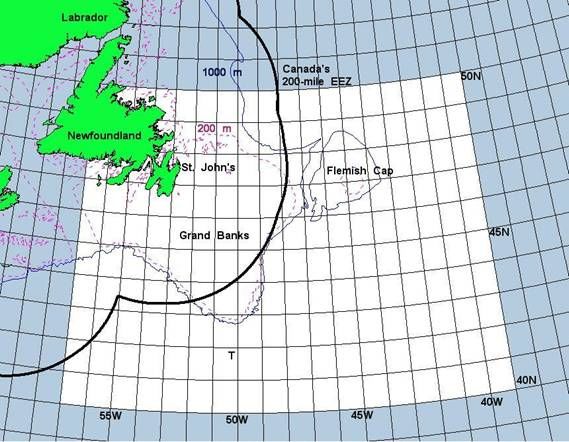
Abbreviations and Acronyms

AIS        Automated Information System
AOR        Area of Responsibility
BAPS       iceBerg Analysis and Prediction System
C-130J     Non-missionized C-130 long-range reconnaissance aircraft
CALIB      Compact Air Launched Ice Beacon
CAMSLANT   Communications Area Master Station atLANTic
CCG        Canadian Coast Guard
CIS        Canadian Ice Service
D1         First Coast Guard District
DDH        callsign for Hamburg Germany
DDK        callsign for Pinneberg Germany
ELTA       Brand name of Radar System equipped on HC-130J
FLAR       Forward-Looking Airborne Radar
GMES       Global Monitoring for Environment and Security
HC-130J    Missionized C-130 long-range reconnaissance aircraft
HF         High Frequency
HMCS       Her Majesty’s Canadian Ship
IIP        International Ice Patrol
INMARSAT   INternational MARitime SATellite (also Inmarsat)
IRD        Ice Reconnaissance Detachment
KT         Knot
LAKI       Limit of All Known Ice
M          Meter
MB         Millibar
MCTS       Marine Communications and Traffic Service
M/V        Motor Vessel
NAFO       Northwest Atlantic Fisheries Organization
NAIS       North American Ice Service
NAO        North Atlantic Oscillation
NIC        National Ice Center
NIK        callsign for CAMSLANT
NM         Nautical Mile
NMF        callsign for USCG Communications Station Boston
NTIS       National Technical Information Service
NWS        National Weather Service
OPCEN      Operations Center
PAL        Provincial Aerospace Limited

2
Abbreviations and Acronyms (continued)

RADAR       RAdio Detection And Ranging (also radar)
RMS         Royal Mail Steamer
SME         Subject Matter Expert
SOLAS       Safety Of Life At Sea
SLAR        Side-Looking Airborne Radar
VON         callsign for MCTS St. John’s
WOCE        World Ocean Circulation Experiment

                                                       3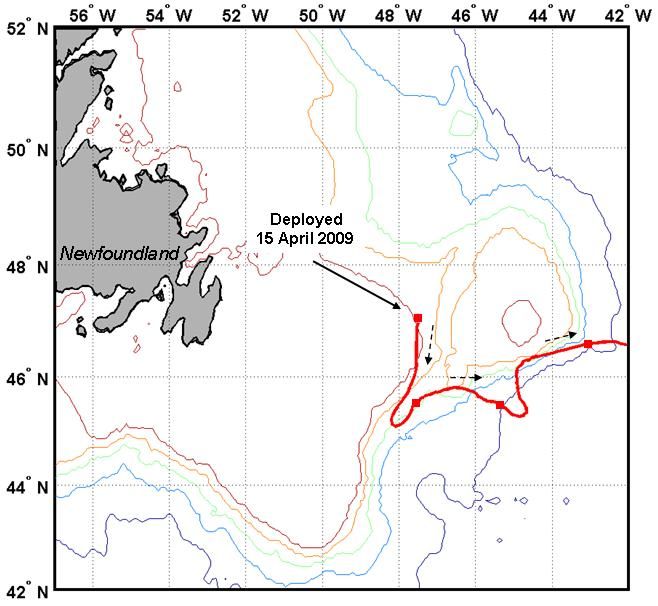
Introduction

        This is the 95th annual report of the International Ice Patrol (IIP). IIP was under the
operational control of Commander, U.S. Coast Guard Atlantic Area until May 31, 2009 when it
shifted to Commander, U.S. Coast Guard First District. The report contains information on IIP
operations, environmental conditions, and iceberg conditions in the North Atlantic during 2009.
The Ice Patrol was formed after the RMS Titanic sank on 15 April 1912. Since 1913, except for
periods of World War, Ice Patrol has monitored the iceberg danger on and near the Grand Banks
of Newfoundland and has broadcasted the Limit of All Known Ice (LAKI) to mariners. The
activities and responsibilities of IIP are delineated in U.S. Code, Title 46, Section 738, and the
International Convention for the Safety of Life at Sea (SOLAS), 1974 under 17 signatory nations.
        The International Ice Patrol conducted aerial reconnaissance from St. John’s,
Newfoundland to search for icebergs in the southeastern, southern, and southwestern regions of
the Grand Banks. In addition to IIP reconnaissance data, Ice Patrol received iceberg reports from
other aircraft and mariners in the North Atlantic. At the Operations Center in New London,
Connecticut, personnel analyzed iceberg and environmental data and used the iceBerg Analysis
and Prediction System (BAPS) computer model to predict iceberg drift and deterioration. Based
on the model’s prediction, IIP produced the ice chart and text bulletin. In addition to these routine
broadcasts, IIP responded to individual requests for iceberg information.
        VADM Robert J. Papp, Jr. was Commander, U. S. Coast Guard Atlantic Area. When IIP
transitioned to the First Coast Guard District in May, RADM Dale G. Gable was the First District
Commander. In July 2009, RADM Joe L. Nimmich relieved RADM Gable. CDR Scott D.
Rogerson was Commander, International Ice Patrol.
        For more information about the International Ice Patrol, including historical and current ice
bulletins and charts, visit our website at www.uscg-iip.org.

4
Summary of Operations

        The International Ice Patrol (IIP)         IIP’s AOR. These reports were generated by
monitors iceberg danger near the Grand Banks       various land, sea, air, and space platforms
of Newfoundland from 15 February to 01 July        including: merchant ships and Canadian Coast
as mandated by SOLAS.           This period is     Guard vessels operating within or near the
regarded as the Ice Season and is defined as       Grand      Banks     of    Newfoundland,       IIP
such because the Grand Banks are normally free     reconnaissance flights, commercial aerial
of icebergs from August through January.           reconnaissance contracted by the Canadian Ice
Although the Ice Season normally extends from      Service (CIS) and provided by Provincial
February through July, IIP reporting services      Aerospace Limited (PAL), and satellite data
will commence whenever iceberg populations         processed by the USCG Intelligence
pose a threat to the primary shipping routes       Coordination Center (ICC).
between Europe and North America and will                  Of the 1,730 information reports
continue until the threat has passed. Weekly       received by IIP, 437 reports relayed ice
products will commence the first Friday            information identifying 17,354 individual
following 15 February and continue until ice       objects to include icebergs, growlers, and/or
conditions are severe enough to necessitate        stationary radar targets. Even though 17,354
transmission of daily products, or until the       individual objects were reported to IIP, only
season end. Distinct from the “Ice Season,” the    8,254 objects were merged (added, deleted or
“Ice Year” is marked from October 1st of the       re-sighted) by IIP to the iceberg drift and
previous year until September 30th of the          deterioration model known as BAPS. The
current year.                                      disparity between the number of reported and
        In 2009, IIP actively monitored the        merged objects illustrates two important points
iceberg danger to transatlantic shipping in its    regarding IIP operations. Each ice information
Area of Responsibility (AOR), defined as the       report is judged against several factors
region bounded by 40°N, 50°N, 39°W, and            concerning accuracy and timeliness to ensure
57°W (Figure 1). IIP opened the season and         that only the most reliable information is used
began issuing weekly products on Friday, 20        to generate IIP products. In addition, CIS, a
February just days after moving its office space   strong partner of IIP in conducting the North
from Groton, CT to New London, CT. Ice             Atlantic Ice Patrol, merged an additional 4,839
conditions were light throughout February and      icebergs, bergy bits, growlers, and radar targets
early March. However, by mid- March, a             to BAPS. Under the current tenets of the
significant iceberg distribution was tracked       partnership, CIS agrees to merge icebergs and
south of 50°N prompting the transition to daily    radar targets detected north of 50°N and/or west
products on 16 March. IIP’s ice products were      of 55°W.
distributed daily at 1200Z until 28 July, the              In total from both organizations (IIP and
final day of the 2009 Ice Season.                  CIS), there were 13,093 objects merged to
        During the 2009 Ice Year, IIP’s            BAPS throughout the 2009 Ice Year,
Operations Center in New London, Connecticut       representing 6,216 distinct icebergs, bergy bits,
received, analyzed, and processed 1,730            growlers, and radar targets. Approximately
information reports concerning oceanographic,      2,318 distinct objects were sighted, detected, or
atmospheric, and/or ice conditions throughout      predicted to have drifted into IIP’s AOR.

                                                                                                   5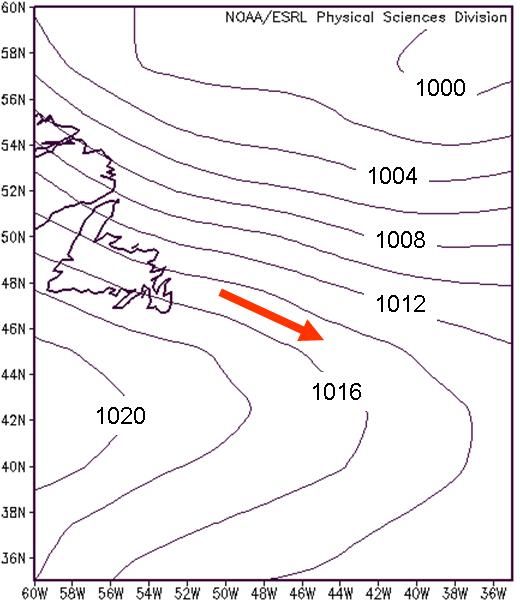
Figure 1. IIP’s Operating Area. T indicates the location of Titanic’s sinking.

                                                           as well. Figure 2, Column 1 provides the
             Information Reports                           breakdown of the sources for all information
                                                           reports received during the 2009 Ice Year.
       A critical factor contributing to IIP’s
successful history is the support received from                                 Ice Reports
the maritime community. This influence is
measured by the sheer volume of voluntary                          In 2009, 440 (25%) of the 1,730
information reports IIP receives from merchant             information reports received by IIP contained
vessels each year. These reports are sent in               data on icebergs or stationary radar targets.
response to a long-standing IIP request for                Commercial reconnaissance was responsible for
weather conditions, sea surface temperatures,              the greatest number with 195 (44%) ice reports.
and ice sightings from any vessel transiting               Merchant ships tallied the second highest
within or near the Grand Banks of                          number with 114 (26%) ice reports. IIP aerial
Newfoundland. Receiving on scene and up-to-                reconnaissance flights provided 59 (14%) ice
date information helps ensure the accuracy of              reports including 53 flight messages and 6 in-
IIP products.                                              flight iceberg reports.         The Canadian
        All ships that provided reports                    Government, including Canadian Coast Guard
 including weather, sea surface temperature,               vessels, Canadian Forces aircraft, and the
 ice, and/or stationary radar target reports               Canadian Ice Service combined to deliver 58
 during the 2009 Ice Year are listed in                    (13%) ice reports. Various other sources,
 Appendix B.                                               including USCG ICC, scientific research
       Although the majority of reports were               vessels, and even one commercial trans-Atlantic
received from merchant vessels, IIP received               flight combined to relay the remaining 14 (3%)
valuable information from several other sources            ice reports. The breakdown by reporting source
6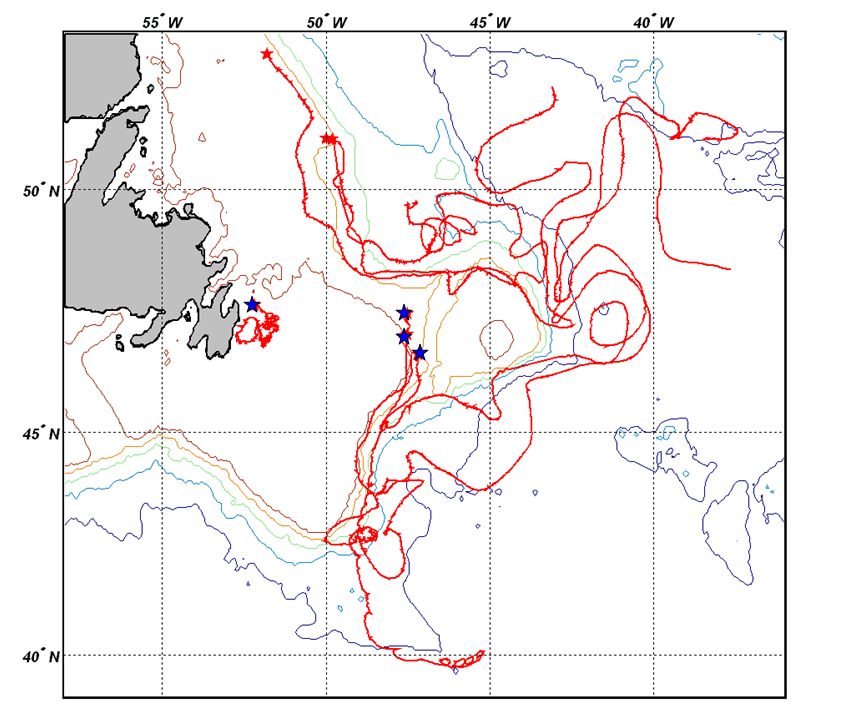
of all ice reports is illustrated in Figure 2, to BAPS. Rounding out the largest remaining
Column 2.                                        shares, IIP reconnaissance flights and the
                                                 various platforms representing the Canadian
                Merged Targets                   Government accounted for 22% and 2% of the
                                                 updates to the iceberg drift and deterioration
        All ice reports received at the IIP model, respectively. The distribution of objects
Operations Center are evaluated for accuracy entered into BAPS by reporting source is
and viability to determine if the reported displayed in the Figure 2, Column 3.
information will be merged into IIP’s iceberg
drift and deterioration model. Several factors              LAKI Iceberg Sightings
come into play during this evaluation, including
atmospheric and oceanographic conditions,                In order to meet SOLAS mandates, IIP
recent reconnaissance in the area, method of develops a Limit of All Known Ice (LAKI) in
detection, and any other amplifying information order to inform the mariner of the southern,
relayed with the ice report. This standard is eastern, southeastern, and southwestern limit of
applied to all ice reports, even IIP’s own the iceberg population. During the 2009 Ice
reconnaissance, to ensure that accurate ice Season, IIP began creating and distributing the
products are being broadcast to the maritime LAKI to the mariner with the commencement
community.                                       of daily products on 16 March. On this date, IIP
        Throughout the 2009 Ice Year, there was tracking 89 icebergs south of 48°N, the
were 13,093 updates to BAPS. CIS efforts latitude that marks the nominal northern extent
produced 4,839 updates while IIP’s resulted in of the trans-Atlantic shipping lanes. The LAKI
8,254. This number includes additions of new is of critical importance because it defines the
objects (icebergs, bergy bits, growlers and southern,          eastern,    southeastern,     and
stationary radar targets), updates to existing southwestern boundary for ice-free ship
objects in the model with information from new navigation. As a result, the majority of IIP’s
observations, and deletions of objects from the reconnaissance missions focus on this
model based on recent reconnaissance or boundary.               In 2009, IIP flight messages
predicted deterioration.                         accounted for 63% of all icebergs used to set
        Commercial reconnaissance conducted the LAKI. A breakdown of information reports
by Provincial Aerospace Limited (PAL) had the processed by IIP is shown in Figure 2.
largest role, accounting for 74% of the updates

    Figure 2. Distribution of information reports processed by IIP by reporting source during the 2009 Ice Year.

                                                                                                                   7
Products and Broadcasts                     Army Weather Information Network) web site.
                                                     JAAWIN is sponsored by the U.S. Department
                                                     of Defense and provides various operational
        IIP issued a weekly ice chart and            weather and oceanographic products to users at
bulletin each Friday from 20 February to 13          all security levels, including the standard internet
March stating that IIP was monitoring iceberg        user. The results were encouraging. Ninety
conditions, but was not yet issuing daily            percent of the users identified by the analysis
products. The transition to daily products           were military, and the remaining 10% were
occurred on 16 March when significant iceberg        government, education, standard web users, and
populations south of 48°N threatened the trans-      foreign. The analysis also counted the total
Atlantic shipping lanes.         Daily products      number of hits received on the ice bulletin page.
containing LAKI data valid for 1200Z as well         The site received four hits in March, 26 hits in
as sea ice, iceberg distribution, and radar target   April and 26 hits in May, for a total of 56 hits.
information continued until the season was           Although exact users can not be identified or
closed on 28 July.                                   surveyed, the number of hits on the JAAWIN
        The weekly ice chart also numerically        web site during the evaluation period validates
displayed the current iceberg population             its use as a means of disseminating IIP ice
density in each one degree of latitude by one        information.
degree of longitude square. This was a
significant change from the ice charts of
previous seasons and a break from two decades                      Safety Broadcasts
of IIP tradition. These changes addressed
customer feedback and made IIP’s ice chart                   Any report of an iceberg or stationary
similar to the charts produced by NAIS partner       radar target near or beyond the published LAKI
CIS. Charts from previous seasons used               challenges the accuracy of IIP products and is a
iceberg symbols rather than numbers and              potential threat to safe navigation. When such a
displayed an Area of Many Bergs.                     report is received, IIP transmits an unscheduled
        In 2009, IIP transmitted 135 scheduled       safety broadcast to mariners to report the
ice bulletins and 10 revised bulletins via           location and type of object (iceberg or radar
SafetyNET. All scheduled bulletins reached           target) sighted or detected. During the 2009 Ice
SafetyNET on time, on or prior to 1200Z. The         Season, IIP sent eight unscheduled safety
on-time delivery percentage for Ice Charts was       broadcasts for six reports of icebergs and two
96.79%. Ice Charts are scheduled to be               reports of sea ice outside the published LAKI.
broadcast three times daily at 0438Z, 1600Z,                 The information published in IIP’s ice
and 1810Z.                                           chart and bulletin is intended to be valid for a
        Note: Information concerning product         24-hour period, defined as 1200Z of the current
format and distribution methods can be found         day through 1200Z the following day. Ice
in IIP’s annual Announcement of Services, on         reports requiring a safety broadcast also have the
IIP’s website, www.uscg-iip.org, or in NGA           potential to impact IIP’s published products. If
Publication 117.                                     the object reported is in a position that requires a
                                                     modification of the ice products and if time
                                                     allows the modifications to be made prior to the
      JAAWIN Hit Counter Analysis
                                                     scheduled broadcast, IIP’s currently published
                                                     products will be revised and retransmitted.
        During the 2009 Ice Season, IIP                      Seven of the eight reports requiring a
conducted a three-month analysis to determine        safety broadcast during the 2009 Ice Season
the type and number of viewers of the daily ice      required a revision of the LAKI. In one other
bulletin on the JAAWIN (Joint Air Force and          instance, a typographic error was discovered in

8
the LAKI published in the daily ice bulletin. 100%
As a result of these revisions, the LAKI 99%
accuracy for the 2009 Ice Season fell to 95%.
98%
97%
(Figure 3).
LAKI Accuracy
96%
95%
94%
Historical Perspective 93%
92%
91%
To determine the severity of the ice 90%
2001 2002 2003 2004 2005 2006 2007 2008 2009
season, IIP uses two traditional measurements. YEAR
The first is season length, measured in the Figure 3. Recent historical distribution of LAKI
number of days daily products are issued. The accuracy as measured by the number of revisions to the
second measurement is the number of icebergs LAKI based on ice reported outside the limit. (Note: Due
to extremely light ice conditions no LAKI was produced in
crossing south of 48°N. This number includes 2005 and 2006)
icebergs initially sighted or detected south of
48°N as well as those originally sighted or only in the 50th percentile based on season
detected further north that drifted south, as length, the 2009 Ice Season climbed into the top
modeled by BAPS. ten as the eighth most severe when judged
The 2009 Ice Season lasted 135 days against iceberg populations south of 48°N during
with 1,204 icebergs (not including bergy bits the same timeframe (Figure 4, Blue Columns).
or growlers) sighted, detected, and/or modeled The total number of icebergs detected
to have drifted south of 48°N. The season during the 2009 Ice Season was nearly 50%
length for 2009 places it near the 50th higher than the modern seasonal average (1983-
percentile when compared to the last 26 years 2008) of 829 icebergs. However, the 1,204
(Figure 4, Red Columns). This timeframe icebergs detected or drifted south of 48°N in
encompasses IIP’s modern reconnaissance era 2009 was over 2.5 times the overall seasonal
when aerial reconnaissance using radar- average of 476 icebergs measured against
equipped aircraft became standard. Although iceberg records dating back to 1900.
Figure 4. 1983-2009 Season Severity Chart – Ice Season length is measured by the number of days IIP issued daily
products. (Note: Daily products were not transmitted in 1999, 2005, and 2006 due to very light ice conditions) The
number of icebergs south of 48N does not include bergy bits or growlers.
9Canadian Support
As they do every year, the Canadian
Government generously supported IIP during
2009. CIS shared valuable reconnaissance data,
including iceberg and information reports from
Canadian Coast Guard and Canadian Forces
assets, critical environmental data from the
Canadian Meteorological Center, and most
importantly, their own sea ice and iceberg
expertise. The synchronized iceberg-modeling
database, now in its fourth year of operation,
continued to ensure that all ice information
received by IIP or CIS was quickly merged and
accurately reflected on both organizations’ ice
products.
IIP also appreciated the critical support
from PAL who continued to share valuable ice
observation data throughout the 2009 Ice
Season. Their reconnaissance flights routinely
covered the interior portions of the Grand
Banks of Newfoundland surrounding and in
support of commercial oil operations. Their
reconnaissance efforts in this area not only
provided critical information to IIP’s
Operations Center, but also allowed IIP’s
reconnaissance to focus on other important
regions within the IIP AOR.
IIP thanks C-CORE for continuing to
provide iceberg data to IIP during the 2009 Ice
Season and for their ongoing efforts to improve
the ice detection algorithms designed for
satellite iceberg reconnaissance. IIP looks
forward to working with C-CORE in 2010 to
assess the new capabilities of RADARSAT-2.
10Iceberg Reconnaissance and Oceanographic Operations
Ice Reconnaissance Detachment
Deployed Iceberg Transit Logistics Flight
IRD
Days Patrols Flights Flights Hours
The Ice Reconnaissance Detachment PRE 10 2 *4 2 41.4
(IRD) is a sub-unit under Commander, 1 6 3 *2 0 31.7
International Ice Patrol which is partnered with 2 9 4 2 0 39.7
Coast Guard Air Station Elizabeth City 3 8 2 *2 0 25.9
(ECAS). 4 9 3 *2 0 32.8
5 9 5 *2 0 50
During the 2009 Ice Season, 14 IRDs
6 8 4 *2 0 43.6
deployed to observe and report icebergs, sea
7 9 6 *2 0 54.8
ice, and oceanographic conditions on and near 8 8 5 2 0 45.2
the Grand Banks of Newfoundland. All 9 6 3 *2 1 43.6
observations were transmitted to the IIP 10 9 5 2 0 43.5
Operations Center in New London, CT where 11 8 5 2 0 45
they were entered into the iceBerg Analysis and 12 6 2 2 0 24.5
Prediction System, processed, and distributed to 13 Cancelled
mariners operating in IIP’s Area of 14 Cancelled
Responsibility as described in the Summary of POST 3 0 2 0 10
Operations chapter. TOTAL 108 49 30 3 531.7
The Pre-Season IRD departed on 04 Table 1. 2009 IRD summary (* denotes a transit flight
February to conduct official meetings with IIP of which a portion of the flight included an IIP or NAFO
patrol; Iceberg patrols for IRD 8 included one test flight.
partners in Elizabeth City, North Carolina and Flight hours include patrol, logistics, and transit hours).
St. John’s, Newfoundland and to determine the
early season iceberg distribution. During the
Aerial Iceberg Reconnaissance
Pre-Season IRD, a moderate iceberg
distribution was detected. As a result, all
subsequent IRDs were conducted as scheduled Due to the consistently inclement
with the exception of IRDs 13 and 14 which environmental conditions in IIP’s AOR,
were cancelled due to a light iceberg detecting and classifying targets is a perpetual
distribution at the end of the season. The Post- challenge for IIP IRDs. It is for this reason that
Season IRD was conducted from 04-06 August, the use of radar has become critical to IIP
concluding 2009 IIP deployments to Canada. operations. In times of reduced visibility, IIP
Throughout the 2009 Ice Season, IRDs relies heavily on the detection and classification
operated out of IIP’s forward operating base in capability of radar as the primary means of
St. John’s, NL for a total of 108 days. 2009 had conducting IIP iceberg reconnaissance. In no-
a total of 82 flights, including 49 iceberg visibility conditions, the radar’s imaging
reconnaissance flights (including one ELTA test capability must be relied upon as the primary
flight), 17 dedicated transit flights, nine mean of classifying targets. A detailed
combination transit/ Northwest Atlantic description of IIP’s reconnaissance strategy is
Fisheries Organization (NAFO) flights, four provided on IIP’s web site at http://www.uscg-
combination transit/iceberg reconnaissance iip.org in the FAQ section.
flights, and three logistics flights. A summary Coast Guard aircraft provided the
of 2009 IRD flight operations is provided in primary means of detecting icebergs in the
Table 1. vicinity of the Grand Banks in 2009. All 2009
11aerial iceberg reconnaissance operations were availability of fully functioning HC-130Js
conducted using HC-130J (missionized) and throughout the 2009 Ice Season. Because of
C-130J (non-missionized) long-range this, IIP conducted a large percentage of visual
reconnaissance aircraft provided by ECAS. The only patrols during the 2009 season compared
HC-130J aircraft were equipped with the to the previous four years when no visual only
ELTA-2022 360° X-Band Radar and APN-241 patrols were required (Table 2). When
Weather Radar, and the C-130J aircraft were interpreting the data in Table 2, note that 2005
equipped with only the APN-241 Weather and 2006 were extremely light ice years
Radar. compared to 2007-2009.
2009 marked a significant transition in
Ice Patrol reconnaissance aircraft and sensor Year
Radar and Visual Radar Only Visual Only
Patrol Total Patrol Total Patrol Total
capabilities. IIP successfully implemented the
HC-130J and C-130J aircraft with associated 2005 15 2 0
sensors into IRD iceberg reconnaissance 2006 17 0 0
operations and discontinued the use of the
SLAR/FLAR equipped HC-130H aircraft. IIP 2007 38 2 0
continued to use an Automated Information 2008 35 2 0
System (AIS) receiver as an integrated
2009 17 0 36
component of the HC-130J mission system to
assist in target discrimination. Table 2. IIP Radar and Visual Patrol Comparison.
Ice Patrol reconnaissance successfully
implemented the new aircraft and sensors When available, the 360° coverage
despite many complications, including the provided by the ELTA Radar allowed IIP to use
retrofitting of the C-130J aircraft with the new 20 NM track spacing operating the radar in the
mission systems and various technical problems 30 NM range to achieve >200% radar coverage
associated with the new system. These (Figure 5) on each patrol, regardless of
complications contributed to the limited visibility.
ELTA Radar Coverage
St. John’s, Newfoundland
20 nm
track Shaded area indicates ELTA Radar Coverage
spacing
30 nm
20 nm
20 nm
track 10 nm
spacing
10 nm
20 nm
30 nm
20 nm Track spacing provides > 200% coverage of OPAREA
Figure 5. IIP Radar Reconnaissance Plan in 2009.
12IIP utilized 20 NM track spacing upon a radar image does not present distinguishing
recommendation of the Coast Guard Office of features, IIP classifies the contact as a radar
Aviation Forces (CG-711) following the testing target (R/T) in hopes of being able to identify it
of the ELTA radar in September 2008. When on a subsequent pass or another patrol.
visual only patrols were conducted, 10 NM Figure 7 presents the number and types
track spacing was utilized in accordance with of targets that IRDs detected during the 2009
IIP Standard Operating Procedures to ensure Ice Year.
that no targets were missed when operating
without a functioning ELTA-2022 radar. Year
Total Track Miles Flown Total Area Coverage
(nautical miles) (square miles)
The 20 NM track spacing used with the
ELTA-2022 radar provided only 66% of the 2007 52,977 3,178,626
coverage that was provided by the HC-130H
2008 53,690 3,221,370
with SLAR/FLAR combination. This radar
combination effectively conducted patrols with 2009 80,677 1,883,778
30 NM track spacing. Table 3 shows a three- Table 3. Three Year Track Mile / Area Coverage
year comparison of annual totals of track miles Comparison.
and area coverage. This data shows a drastic
increase in total track miles flown and a Year
Total Track Miles With Total Track Miles Without
Visibility (nautical miles) Visibility (nautical miles)
corresponding drastic decrease in total area
covered associated with patrols conducted with 2005 7,059 12,398
reduced track spacing.
2006 7,679 10,452
As a result of the reduced patrol altitude
required for ELTA operations (~1000-5500 feet 2007 10,066 42,911
compared to SLAR/FLAR operations at ~5500- 2008 19,490 34,200
8000 feet) combined with the increased number
of visual only patrols, the number of patrol 2009 56,071 24,606
miles with visibility encountered in IIP’s AOR Table 4. Five Year Track Mile Visibility Comparison.
during 2009 was much greater than in years
past (Table 4).
2009 IRD Target Summary
In 2009, IRDs detected a total of 1,070
icebergs. Visual surveillance detected 72% of
the icebergs. The remaining icebergs were
identified using radar only (14%) and using
both radar and visual surveillance (14%). Figure 6. Breakdown of icebergs by detection source.
Figure 6 shows the breakdown of the detection
sources for icebergs.
The Grand Banks are a productive
fishing ground frequented by fishing vessels,
ranging from 20 to over 70 meters in length.
Determining whether an ambiguous radar
contact is an iceberg or a stationary vessel is
particularly difficult with small targets. These
contacts often present similar radar returns and Figure 7. Breakdown of targets detected by IRDs in
cannot easily be differentiated. Therefore, when 2009.
13The Grand Banks region continues to be Radar Testing and Evaluation
rapidly developed for its oil reserves with new
exploration conducted daily and many prospects During the 2009 Ice Season, IIP
of future exploration in the region. In conducted additional testing of the HC-130J
November 1997, Hibernia, a gravity-based oil- long-range reconnaissance aircraft equipped
production platform, was set in position with the ELTA-2022. Testing was conducted in
approximately 150 NM offshore on the concert with normal operations throughout the
northeastern portion of the Grand Banks. In season and during one dedicated test flight
addition to Hibernia, other drilling platforms— conducted during IRD 8. Future testing is still
including GSF Grand Banks, Terra Nova, Sea necessary to further refine the ELTA-2022’s
Rose, and Henry Goodrich—are routinely on capability to detect and identify small icebergs
the Grand Banks. Consequently, this escalated in IIP’s AOR at different altitudes under normal
drilling has increased air and surface traffic in operating conditions. Additional information
IIP’s AOR, further complicating target regarding this year’s test and a brief summary
identification. However, this difficulty is offset of the CG-711 test report from September 2008
by the information reports this traffic provides. are provided as Appendix C to this report.
Reports from ships, aircraft, and drilling
platforms greatly aid IIP in the creation of a 2009 Flight Hours
Limit of All Known Ice (LAKI) that is as
accurate and reliable as possible. During the 2009 Ice Season, IIP
conducted 49 iceberg reconnaissance sorties,
Northwest Atlantic Fisheries three logistics flights, one test sortie, and 30
Organization Support transit flights from ECAS to and from St.
John’s. Of the 30 transit flights, three included
IIP began providing support to the iceberg patrols, and eight included D1 NAFO
Northwest Atlantic Fisheries Organization patrols. Figure 8 shows IIP’s flight hour
(NAFO) through D1 during the 2009 Ice breakdown for 2009.
Season. This new partnership was formed in
conjunction with IIP’s transition of operational
control from Coast Guard Atlantic Area to the
First Coast Guard District on 31 May 2009. IIP
IRDs collect position information of sighted
fishing vessels during routine reconnaissance
flights and provide this information to D1 via
the IIP OPCEN the following day. Table 5
provides a summary of the support provided to
NAFO in 2009 including total patrol hours for
flights where NAFO information was collected. Figure 8. 2009 Flight Hours.
Month Fishing Vessels Detected Patrol Hours
Figure 9 shows a comparison of the
breakdown of the flight hours used for the last
May 90 82.6 six ice seasons. Although the overall flight
June 33 66.3 hours for the 2009 Ice Season were only
slightly more than those used in 2008, a much
July 41 54.6
greater percentage of hours were utilized for
Total 164 203.5 reconnaissance patrols. In 2009, 347 flight
Table 5. Fishing vessels sighted during May-July 2009. hours were used for actual ice reconnaissance
14flights compared to 244 flight hours in 2008. Commercial Reconnaissance Study
The 10 NM track spacing required for visual
only patrols combined with the significant In 2009, IIP completed a commercial
iceberg population south of 48°N explains this reconnaissance study analyzing the availability
increase in patrol hours. In 2008, significant and feasibility of using commercial aircraft to
time was devoted to testing of both the ELTA- supplement future IIP operations and reduce
2022 radar and the SELEX Seaspray radar. In IIP’s dependence on USCG aircraft. A detailed
2009, only one dedicated test flight was report was provided to IIP by Potomac
conducted. Finally, the transition from the HC- Management Group (PMG), the USCG
130H to the HC-130J proved to be a significant Research and Development Center (RDC)
improvement in the reliability of IIP’s government contractor hired to conduct the
reconnaissance platform. The decreased need study. A summary of the findings are provided
for logistics flights in response to aircraft in Appendix D of this report. It has not yet
maintenance issues is a result of this increased been determined how soon dedicated
reliability. Figure 10 compares flight hours to commercial reconnaissance aircraft may be
the number of icebergs south of 48°N since incorporated into IIP operations.
2000.
Satellite Iceberg Reconnaissance
All 2009 satellite iceberg
reconnaissance operations were conducted in
cooperation with the USCG Intelligence
Coordination Center (ICC), located in Suitland,
MD. This is a change from previous years
where IIP is now working directly with the ICC
for satellite support rather than sending requests
to National Ice Center (NIC) personnel who in
turn made a request to ICC personnel. ICC is
now placing orders, analyzing received images,
and working on the development of processes to
Figure 9. Summary of flight hours (2004-2009). conduct satellite reconnaissance for IIP. Coast
Guard personnel stationed at the NIC, who
previously served as a liaison between IIP and
the ICC in years past, are now focused on
providing increased ice analysis support to the
NIC for other Coast Guard ice operations.
In 2009, IIP, NIC, and ICC continued
the development and implementation of
Standard Operating Procedures (SOP) for
conducting satellite iceberg reconnaissance and
ambiguous target identification. These SOP
identify the new procedures for coordinating
directly with ICC. The transfer of the USCG
petty officer billet located at the NIC from
Figure 10. Flight hours versus icebergs south of 48°N
USCG headquarters to IIP mentioned in the
(2000-2009).
2008 IIP Annual Report did not happen as
15desired due to the redefined focus for that Environmental Conditions
position at the NIC.
IIP continued cooperation with C-CORE Environmental conditions in IIP’s AOR
in the analysis and verification of iceberg permitted adequate visibility (≥10 NM) for
detections using RADARSAT II satellite visual-only reconnaissance 69.5% of the time
imagery. This was done through the use of during the 2009 Ice Season. For the remaining
coincident IIP reconnaissance flights with roughly 30%, IIP relied heavily on the ELTA-
ordered satellite swaths in IIP’s AOR during the 2022 radar to detect and classify targets in low-
2009 Ice Season. C-CORE is affiliated with visibility conditions, such as low cloud decks
Memorial University in St. John’s, NL and has and fog.
been working in cooperation with IIP since
2003.
Oceanographic Operations
IIP will continue to evaluate satellite
information provided by C-CORE during the
2010 Ice Season. IIP may also pursue In 2009, IIP air-deployed three World
partnerships with other satellite providers to Ocean Circulation Experiment (WOCE) drifting
further develop reliable satellite reconnaissance buoys from USCG C-130J and HC-130J aircraft
capabilities. and coordinated the deployment of four WOCE
A breakdown of 2009 satellite iceberg drifting buoys from Canadian Coast Guard
reconnaissance is provided in Table 6. Only (CCG) vessels. These buoys were deployed on
ICC iceberg reports were merged into BAPS. the Grand Banks of Newfoundland and in the
RADARSAT II iceberg data provided by inshore and offshore branches of the
C-CORE is currently being evaluated for Labrador Current. The WOCE drifting buoys,
accuracy and has not yet been approved for drogued at a depth of 15 or 50 meters, provided
operational use and incorporation into BAPS. near real time ocean-current information that
was used to modify the historical-current
ICC C-CORE database within BAPS. Figure 11 shows 2005-
Number of acquisition requests 13 26
2009 air and ship WOCE drifting buoy
deployments.
Number of iceberg messages provided 1 30
Number of messages merged into BAPS 1 0 All seven WOCE drifting buoys
Table 6. 2009 Satellite Iceberg Reconnaissance. functioned properly and transmitted
oceanographic data for sufficient durations,
12
11
Commemorative Wreath Deployments
10 9 9
7
In conjunction with reconnaissance 8
Buoys
operations, IIP air-deployed several wreaths in 6
5
2009 to commemorate both the tragic sinking of
the RMS Titanic as well as those lost in the 4
execution of the Greenland Patrol during 2
WWII. Three wreaths commemorating the 97th
anniversary of the sinking of the RMS Titanic 0
2005 2006 2007 2008 2009
in 1912 were deployed on IRD5, and one
wreath honoring the Greenland Patrol was Air Ship
deployed on IRD9. Figure 11. WOCE Buoy deployments (2005-2009).
16ranging from two to nine months. Air-deployed Detailed WOCE drifter information is provided
WOCE drifting buoys are purchased by IIP and in IIP’s 2009 WOCE Buoy Drift Track Atlas,
prepared and deployed through cooperative available upon request from IIP.
efforts by IIP and ECAS personnel. Buoy In August 2009, IIP assisted Coast
deployments are conducted in conjunction with Guard District Seventeen (D17), Air Station
IRD iceberg reconnaissance operations when Kodiak, the National Oceanic and Atmospheric
flying patrols near desired drop locations. Administration (NOAA), and representatives
Ship-deployed WOCE drifting buoys from the international science community with
are purchased and prepared by IIP personnel the first deployment of a WOCE drifting buoy
and deployed by vessels of opportunity, usually in the Arctic Ocean north of Barrow, Alaska.
CCG vessels operating out of St. John’s, NL. With assistance from partners at Coast Guard
As part of a volunteer operation, these vesselsof Air Station Elizabeth City, IIP provided the
opportunity deploy WOCE drifter buoys at deployment package, including parachute and
locations requested by IIP. The ship rigging, and IIP subject matter expert to oversee
deployments save IIP significant amounts of and assist with the deployment. This successful
time and money while strengthening deployment represents the beginning of further
international partnerships. cooperation between IIP and the international
Figure 12 depicts composite drift tracks science community to prepare for and safely
for the WOCE drifting buoys deployed in 2009. deploy additional buoys in the region.
Figure 12. Composite buoy tracks. Red stars represent drop locations of air-deployed buoys. Blue stars
represent ship-deployed buoys.
17Ice and Environmental Conditions
This section describes the progression of
Introduction the ice year and the accompanying
environmental conditions. The following
The 2009 Ice Season marked one of the
month-by-month narrative begins as sea ice
busiest years in International Ice Patrol (IIP)
began forming along the Labrador coast in
history. Between February and July, 2009, 1204
December 2008 and concludes on 28 July 2009
icebergs drifted into the transatlantic shipping
when Ice Patrol sent its final daily ice chart and
lanes making 2009 the 11th most severe ice
bulletin to mariners. The narrative draws from
year in IIP’s iceberg-count records, which
several sources, including the Seasonal
extend back to 1900. Unusually extensive and
Summary for Eastern Canada, Winter 2008-
persistent sea ice near the Grand Banks in 2009
2009 (Canadian Ice Service, 2009a); sea-ice
protected the icebergs from deterioration,
analyses provided by the Canadian Ice Service
increased the hazard to navigation for North
(CIS) and the U. S. National Ice Center (NIC);
Atlantic mariners, and made detecting icebergs
sea surface temperature anomaly plots provided
more difficult for IIP reconnaissance flights.
Figure 13. Grand Banks of Newfoundland.
18by the National Oceanic and Atmospheric • beginning a faster-than-normal retreat
Administration’s National Weather Service during the last week of March.
(NOAA/NWS, 2009a); and, finally, summaries
of the iceberg data collected by Ice Patrol and From 10-23 October 2008, CIS conducted a
CIS. The plots on pages 40 to 53 document the census of the iceberg population off Baffin
Limits of All Known Ice (LAKI) twice a month Island’s southern coast. It was based on
(the 15th and last day of each month) for the approximately 30 images each from RadarSat-1
period during which Ice Patrol provided daily and Envisat (Desjardins, 2008). The resulting
warnings to mariners in 2009. In addition, the iceberg count was 217, the second lowest CIS
LAKI for the first (16 March) and last (28 July) fall iceberg count in the nine years of the
daily iceberg warnings are presented. survey’s history. Based on the satellite-
The progress of the 2009 Ice Year observed population of offshore icebergs and
(October 2008 through September 2009) is the estimated travel time toward the shipping
compared to sea-ice and iceberg observations lanes, Desjardins (2008) predicted an early
from the historical record. The sea-ice historical March opening date for the 2009 iceberg season
data are derived from the Sea Ice Climatic (defined as the date that IIP starts providing
Atlas, East Coast of Canada, 1971-2000 (CIS, daily warnings to mariners).
2001), which provides a 30-year median of ice
concentration at seven-day intervals for the December 2008
period from 26 November through 16 July.
Historical iceberg information is derived from In early December, sea ice began
Viekman and Baumer (1995), who present forming in the bays along Labrador’s coast. By
LAKI climatology from mid-March to 30 July mid-month, about a week later than normal, the
based on 21 years of Ice Patrol observations southern edge of the main pack moved south of
from 1975 through 1995. They provide the Cape Chidley, Labrador’s northernmost point.
extreme, 25th percentile, median, 75th percentile,
Colder-than-normal air temperatures in
and minimum LAKIs for the period. The 25th Labrador throughout December promoted
and 75th percentiles indicate that, respectively,vigorous sea-ice development along the
25% and 75% of the LAKI were more extensive Labrador coast. The mean monthly air
than those historical positions. Finally, the temperatures at Cartwright, Goose Bay and
average number of icebergs estimated to have Nain, Labrador were 1.4°C to 2.9°C below
drifted south of 48°N for each month was normal (Environment Canada, 2009a and
calculated using 109 years (1900 through 2008) 2009b). Near normal sea surface temperature
of Ice Patrol records (IIP, 2009). conditions persisted along the Labrador coast
throughout the month (NOAA/NWS, 2009a).
Pre-season Predictions Throughout December, the southern ice edge
continued its southward movement, and by
The pre-season sea-ice forecast for east month’s end, it arrived at the northern reaches
Newfoundland waters (CIS, 2008), which was of the Strait of Belle Isle.
issued on 4 December 2008, predicted a slightly
delayed advance and faster-than-normal retreat January 2009
of sea ice in 2009, with the southern ice edge:
The first half of January was much warmer than
• arriving at St. Anthony (Figure 13) by the normal in Newfoundland and southern
end of the first week of 2009, Labrador, which slowed southward sea ice
• reaching 48° N, its southernmost 2009 expansion somewhat. By mid-January, the
extent, in early March, and southern ice edge reached the latitude of St.
Anthony, about a week later than the preseason
19forecast. During the second half of January, vicinity of the Strait of Belle Isle prompted the
there was a dramatic reversal of the air Canadian Coast Guard (CCG) to recommend
temperatures in northern Newfoundland and that the strait not be used by transatlantic
southern Labrador, with both St. Anthony and shipping after 23 January. Despite weather
Goose Bay experiencing much lower-than- conditions that favored sea-ice expansion, by
normal air temperatures. Sea ice continued to month’s end, ice concentration was well below
push southward in east Newfoundland waters. normal (Figure 14).
Shortly after mid-month, ice conditions in the
Figure 14. Departure of sea ice from normal on 26 Jan 2009. Map Courtesy of the Canadian Ice Service.
January was an extraordinarily stormy Newfoundland and lingered off the central
month in the North Atlantic Ocean, with 12 Labrador coast for three days bringing storm-
storms with winds that reached hurricane force force onshore winds that compressed the ice
(Bancroft, 2009). Most of the storms along the Labrador coast. The impact of this
originating near the U. S. and Canadian east storm appears to have been short lived, as by
coasts in January 2009 moved generally from month’s end, the offshore extent of the sea ice
southwest to northeast, which carried the storms along the Labrador coast returned to normal.
into the central Atlantic south of Greenland. On 28 January, an iceberg reconnaissance flight
The exception was an early January (2-5 conducted by Provincial Aerospace Ltd. (PAL)
January) storm that moved north of under CIS sponsorship, found 34 icebergs
20within the sea ice off the central Labrador coast. During the second half of the month, the
The areas east of the sea ice edge were not southern ice edge wavered between Cape
searched. Bonavista and Baccalieu Island, about 50 NM
In January 2009, no icebergs passed north of its normal position. Meanwhile, the
south of 48°N. The 1900-2008 mean for the eastern ice edge was significantly compressed
month is three. by strong onshore winds during the passage of
two strong storms, one on 15 February and the
February 2009 other on 19 February.
IIP’s preseason ice reconnaissance
Throughout February warmer-than- detachment (IRD) deployed to Newfoundland
normal conditions dominated Labrador and on 6 –12 February. Two preseason IRD flights
Newfoundland. The average temperature and several by PAL located a large population
anomaly for the month ranged from +2.9°C in of icebergs and radar targets south of 52°N
St. John’s to +4.3°C in Cartwright. (Figure 15), most within the sea ice. It was
Stormy and warmer-than-normal air becoming clear that 2009 would be an active
temperatures slowed the progress of the iceberg season and that IIP would soon begin
southern ice edge in early February. By 12 providing daily warnings to mariners. As a
February the southern ice edge was at the result, IIP deployed its first regular-season IRD
latitude of Cape Bonavista, about 30 NM north on 20 February.
of its normal position, while the eastern limit During the month, no icebergs passed
was about 30 NM farther east of Cape south of 48°N. The 1900-2008 mean for
Bonavista than normal. February is 14.
Figure 15. Iceberg distribution on 2 March 2009. The numbers indicate the number of icebergs and radar targets
within a 1° of latitude by 1° of longitude bin. Chart Courtesy of the Canadian Ice Service.
21The early March meteorological
March 2009 conditions favored the southeastward
movement (red arrow on Figure 17) of the ice
Labrador was colder than normal during
edge over the period 9 – 19 March. The ice was
March, with Goose Bay and Nain reporting
also being driven southward by the offshore
monthly mean air temperatures 1.9°C and 2.4°C
branch of the Labrador Current. The heavy ice
below normal, respectively. Newfoundland
conditions forced the suspension of operations
observed near-normal temperatures during the
on the GSF GRAND BANKS, a semi-
month.
submersible drill rig, which was conducting
For the first 10 days of March, the
exploratory drilling a short distance from the
southern ice edge remained north of 48°N, advancing ice. The platform was towed to
which is about 60 NM north of its normal safety.
position. The eastern ice edge was about 170 The southern sea ice edge remained near
NM east of Cape Bonavista, near its normal its southernmost position for the year until
position. Over the following two weeks, the ice month’s end, after which it began to retreat.
edge moved over 200 NM to the southeast Early in the month of March, a series of
(Figure 16) reaching its maximum southward reconnaissance flights by IIP and PAL (under
position for the year, 45°-10’N, on 24 March. CIS and oil-company sponsorship) documented
a large population of icebergs immediately
north of 48°N. Shortly thereafter, PAL began
conducting nearly daily reconnaissance in the
Figure 16. Sea ice concentration on 24 Mar 2009. Figure 17. Mean sea-level pressure for 9 March to 19
Chart courtesy of the Canadian Ice Service. March 2009. Plot courtesy of NOAA Earth System
Research Laboratory, Physical Sciences Division.
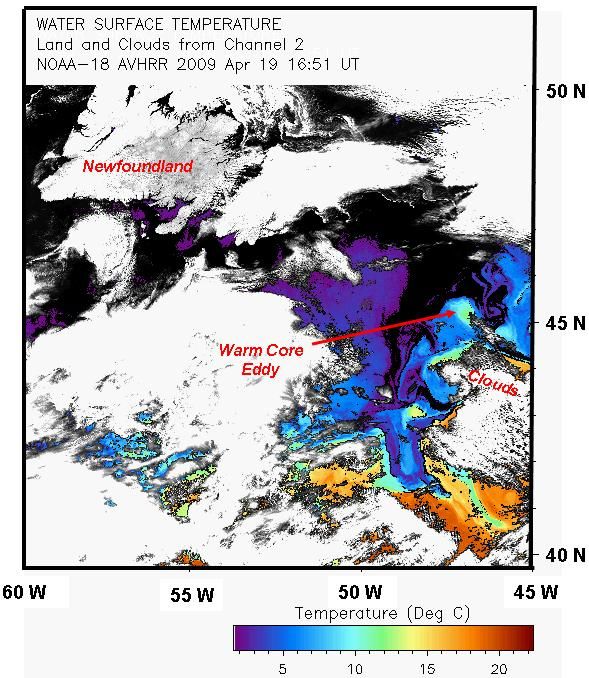
22vicinity of the oil platforms on the northeastern Pass, where it remained until early May. Its Grand Banks. By mid-month, many icebergs clockwise circulation had a significant impact had advanced south of 48°N and had become a on the flow of the offshore branch of the significant threat to the safety of transatlantic Labrador Current, and thus the distribution of mariners. Consequently, IIP began providing icebergs for more than a month. Figure 18, a daily iceberg warnings on 16 March, about a sea surface temperature image from 19 April, week later than the pre-season forecast. shows cold (
Figure 18. Advanced Very High Resolution Radiometer image of the Grand Banks on 19 April 2009 showing a
     warm core eddy at approximately 45°N, 47°W. Image provided by the Ocean Remote Sensing Group, Johns
     Hopkins University Applied Physics Laboratory.

24
Figure 19. Trajectory of IIP drifting buoy 90635 (drogue centered at 50 m) deployed in Flemish
Pass on 15 April 2009 by CCGS Cygnus. Squares mark the drifter positions at 10-day intervals.
May 2009 ice destruction accelerated. By month’s end, the
southern ice edge had retreated to 50°N,
Southern Labrador experienced near- although the ice concentration south of 52°N
normal air temperatures in May, while eastern was generally less than 3/10. The greatly
Newfoundland was warmer than normal. St. reduced ice concentrations in the Strait of Belle
Anthony and St. John’s recorded 1.3°C and Isle allowed the CCG to recommend the use of
2.4°C, respectively, above-normal temperatures the Strait for transatlantic crossings on 27 May.
for the month. A series of CIS-sponsored PAL flights
In May, the warming ocean began on 11 and 12 May found over 500 icebergs
taking a toll on sea ice concentration in east between 49°N and 56°N, most within the sea
Newfoundland waters, although the southern ice. It was clear from the survey flights that the
and eastern extent remained far greater than coming disappearance of sea ice would leave
normal. The southern ice edge lingered near behind a large iceberg population that would
48°N throughout the first half of the month, remain a threat to safe navigation for some time
while the eastern ice edge remained in the to come.
northern reaches of Flemish Pass. At mid- In mid-month, the southern LAKI was near
month, the retreat was more than three weeks 42°N, which is about the 25th percentile, and the
behind normal. During the second half of May, eastern LAKI was east of 40°W, which is close
25to the extreme for the date. During the second defined by a single iceberg that was estimated
half of May, the southern and eastern LAKI to have melted the following day, bringing the
retreated about 90 NM as the warming sea eastern LAKI westward five degrees of
temperature increased the rate of iceberg longitude, about 200 NM.
destruction. This left the southern LAKI north In June, Ice Patrol estimated that 180
of its median position and the eastern LAKI icebergs passed south of 48°N, over twice the
near the median at month’s end. At the end of 1900-2008 mean of 85.
May, IIP was tracking over 300 icebergs,
growlers, and radar targets south of 48°N. July 2009
In May, 450 icebergs passed south of 48°N,
far greater than the 1900-2008 mean of 147. Rapidly warming ocean temperatures
(Figure 20) hastened sea ice destruction along
the Labrador coast in early July. By mid-month,
June 2009
about a week ahead of normal, the last
In June, warmer-than-normal conditions significant concentration of sea ice left the
prevailed in Newfoundland and southern Labrador coast, exposing the large upstream
Labrador. The monthly mean air temperature in iceberg population along the coast to increased
Cartwright was 1.9°C above normal, while St. deterioration.
John’s was 1.2°C above. Meanwhile, farther south, much
Early in the month, the southern ice warmer-than-normal sea temperatures in east
edge continued a slow northward retreat that Newfoundland waters fueled a steady decline in
was two to three weeks behind the normal pace. the number of icebergs. In mid-July, IIP was
By mid-month, the southern edge was 30 NM tracking 10 icebergs, growlers and radar targets
north of the eastern entrance to Strait of Belle south of 48°N. The southern LAKI was at 45°-
Isle. The pace of the retreat increased in the 15’N and the eastern LAKI 45°W, both near the
second half of June. By month’s end, about one median for the date.
week later than normal, the southern ice edge Ice Patrol’s last 2009 Ice
moved north of Hamilton Inlet. Reconnaissance Detachment returned from
There was a large and widely distributed Newfoundland on 27 July after verifying that
iceberg population in the shipping lanes in early the iceberg population had been reduced to a
June. By mid-month, IIP was tracking 262 small number of icebergs that would soon melt.
icebergs, growlers, and radar targets south of Ice Patrol broadcast its last daily iceberg
48°N. The southern LAKI was at the 25th warning to mariners on 28 July.
percentile while the eastern LAKI was at 39°- Twenty-one icebergs passed south of
15’W, near the extreme for the date. There was 48°N in July, the 1900-2008 mean for the
also a large iceberg population between 48°N month is 30.
and 52°N, the area that had recently become
free of sea ice. With the sea ice gone from east
Newfoundland waters and the seasonal
warming of ocean waters taking hold, the
second half of June saw a dramatic reduction in
the number of icebergs. On 30 June, IIP was
tracking 86 icebergs, growlers, and radar targets
south of 48°N. Despite the small number of
icebergs, the southern and eastern LAKI were at
the median and extreme positions, respectively.
The eastern LAKI on 30 June was being
26Figure 20. Mean sea surface temperature anomaly for July 2009 in degrees C.
Plot courtesy of NOAA/NWS (2009a).
severity index (SSI) proposed by Futch and
Discussion Murphy (2003). It takes into account three
major severity indicators: number of icebergs
Classifying the severity of the 2009
iceberg season using the traditional measures of estimated to have passed south of 48°N, length
the number of icebergs estimated to have passed of season, and average area enclosed by LAKI.
All three indicators, which are weighted
south of 48°N and season length in days gives
equally, are normalized to the mean over the
mixed results. According solely to the iceberg
period 1983 - 2009. Finally, the normalized
count, 2009 falls well into the extreme category
contributions of each are summed. From the
(> 600 icebergs), but the 135-day season length
perspective of the mariner, the SSI is more
(defined as the number of days IIP provided
useful than simply using the number of icebergs
daily iceberg warnings to mariners) places it
that entered the shipping lanes during the
toward the middle of the average severity class
season. In addition to the iceberg count, it takes
(105-180 days).
into account, how long the iceberg danger was
The most balanced measure of the
present and the areal extent of the iceberg
severity of an iceberg season is the season
danger.
27SEASON SEVERITY Index (SSI)
6.00
5.40 5.46
5.06
5.00 4.98
4.27
4.00 4.09 3.67
4.24 3.84 3.90 3.61
3.47 3.26
3.25
3.00 2.63 2.93 3.06
2.84
2.60
2.00 1.68
2.11 1.94
1.51
1.00 1.17
0.03 0.01
0.00 0.00
09
07
97
99
01
05
03
87
89
93
95
85
91
83
20
20
20
19
19
20
20
19
19
19
19
19
19
19
Figure 21. Iceberg season severity index (SSI) for the modern IIP reconnaissance era (1983-2009) based on Futch
and Murphy (2003).
The period 1983 – 2009 was selected for was -0.40 (Hurrell, 2009). This value is
this analysis primarily because it is a calculated using the difference in normalized
homogeneous period for IIP’s airborne sea-level atmospheric pressure between Lisbon,
reconnaissance. Over the period, IIP relied on Portugal and Stykkisholmur/Reykjavik, Iceland.
airborne radar reconnaissance, which allows The NAO, the dominant pattern of
patrols to be conducted over a wider range of winter atmospheric variability in the North
weather conditions than the previous airborne Atlantic, fluctuates between positive and
visual patrols or the ship-board reconnaissance negative phases. The positive phase is
that preceded it. associated with meteorological conditions that
Although there are too few data in the favor the movement of icebergs into the
27-year record for a detailed statistical analysis, shipping lanes. These include strong and
the SSI values in Figure 21 seem to fall into persistent northwest winds along the Labrador
three simple bins: 0 - 2 (7 years), 2 – 4 (13 coast, which bring colder-than-normal air
years), and 4 – 6 (7 years). The severe iceberg temperatures and greater-than-normal sea-ice
seasons in the mid-1980s and mid-1990s are extent off Labrador and Newfoundland. In
clearly shown, as are recent light iceberg addition, the persistent northwest winds
seasons. The 3.61 SSI for the 2009 season promote southward iceberg movement.
suggests that, overall, the season was on the Warmer-than-normal conditions and less
upper end of the moderate scale rather than extensive sea ice off the Labrador coast are
extreme. associated with the negative NAO phase. The -
Understanding the conditions that lead a 0.40 NAO Index in 2009 suggests neutral
large number of icebergs entering the shipping conditions that neither favor the movement of
lanes presents its own set of complexities. The icebergs to the Grand Banks nor inhibit them.
winter 2009 (December 2008 through March The mean sea level pressure for the 1
2009) North Atlantic Oscillation (NAO) Index December 2008 – 31 March 2009 period
28You can also read