Hydrodynamical backflow in X-shaped radio galaxy PKS 2014 55
←
→
Page content transcription
If your browser does not render page correctly, please read the page content below
MNRAS 495, 1271–1283 (2020)                                                                                                    doi:10.1093/mnras/staa1240
Advance Access publication 2020 May 7

Hydrodynamical backflow in X-shaped radio galaxy PKS 2014−55

W. D. Cotton,1,2‹ K. Thorat,3 J. J. Condon,1‹ B. S. Frank,2,4,5 G. I. G. Józsa,2,6,7
S. V. White ,6 R. Deane ,3 N. Oozeer ,2,8 M. Atemkeng,9 L. Bester,2,6 B. Fanaroff,2
R. S. Kupa,2,6 O. M. Smirnov,2,6 T. Mauch,2 V. Krishnan2 and F. Camilo2
1 National Radio Astronomy Observatory, 520 Edgemont Road, Charlottesville, VA 22903, USA
2 South African Radio Astronomy Observatory, 2 Fir St, Black River Park, Observatory 7925, South Africa
3 Department of Physics, University of Pretoria, Private Bag X20, Hatfield 0028, South Africa
4 Department of Astronomy, University of Cape Town, Private Bag X3, Rondebosch 7701, South Africa

                                                                                                                                                               Downloaded from https://academic.oup.com/mnras/article/495/1/1271/5831730 by guest on 30 September 2020
5 Inter-University Institute for Data-Intensive Astronomy, Department of Astronomy, University of Cape Town, Private Bag X3,

Rondebosch 7701, South Africa
6 Department of Physics and Electronics, Rhodes University, PO Box 94, Grahamstown 6140, South Africa
7 Argelander-Institut für Astronomie, Auf dem Hügel 71, D-53121 Bonn, Germany
8 African Institute for Mathematical Sciences, 6 Melrose Road, Muizenberg 7945, South Africa
9 Department of Mathematics, Rhodes University, PO Box 94, Grahamstown 6140, South Africa

Accepted 2020 April 29. Received 2020 April 29; in original form 2020 February 21

                                        ABSTRACT
                                        We present MeerKAT 1.28 GHz total-intensity, polarization, and spectral-index images
                                        covering the giant (projected length l ≈ 1.57 Mpc) X-shaped radio source PKS 2014−55 with
                                        an unprecedented combination of brightness sensitivity and angular resolution. They show
                                        the clear ‘double boomerang’ morphology of hydrodynamical backflows from the straight
                                        main jets deflected by the large and oblique hot-gas halo of the host galaxy PGC 064440.
                                        The magnetic field orientation in PKS 2014−55 follows the flow lines from the jets through
                                        the secondary wings. The radio source is embedded in faint (Tb ≈ 0.5 K) cocoons having the
                                        uniform brightness temperature and sharp outer edges characteristic of subsonic expansion into
                                        the ambient intragroup medium. The position angle of the much smaller (l ∼ 25 kpc) restarted
                                        central source is within 5◦ of the main jets, ruling out models that invoke jet re-orientation
                                        or two independent jets. Compression and turbulence in the backflows probably produce the
                                        irregular and low polarization bright region behind the apex of each boomerang as well as
                                        several features in the flow with bright heads and dark tails.
                                        Key words: hydrodynamics – ISM: individual objects: PGC 064440 – galaxies: active –
                                        galaxies: jets – radio continuum: galaxies – radio lines: galaxies.

                                                                                 (2) the superposition of two independent linear jets produced
1 I N T RO D U C T I O N
                                                                                 by two SMBHs residing in the same host galaxy (Lal & Rao
Most luminous and extended radio sources have a pair of collinear                2005), or (3) hydrodynamical backflows from the overpressured
jets thought to be aligned with the spin axis of the supermassive                main jets deflected by the ellipsoidal hot interstellar medium
black hole (SMBH) in the nucleus of the host galaxy (Blandford                   (ISM) of the host galaxy (e.g. Leahy & Williams 1984; Worrall,
& Znajek 1977). However, 3–10 per cent are X-shaped radio                        Birkinshaw & Cameron 1995; Capetti et al. 2002; Saripalli et al.
galaxies (XRGs) defined by having a second set of jets or ‘wings’                2008).
misaligned with the first (Leahy & Williams 1984; Joshi et al.                      Fig. 1 is a reproduction of the prescient fig. 6a in Leahy &
2019). The three main models for XRGs invoke (1) a sudden                        Williams (1984) illustrating the hydrodynamical backflow model.
or continuous reorientation of the nuclear SMBH spin axis (e.g.                  The nuclear SMBH (×) emits two collinear radio jets (large
Ekers et al. 1978; Klein et al. 1995; Dennett-Thorpe et al. 2002),               horizontal arrows) ending in hotspots (black dots). Hydrodynamical
                                                                                 backflows from the ends of the jets (small horizontal arrows)
                                                                                 initially preserve the axial symmetry of the jets. The axial symmetry
   E-mail: bcotton@nrao.edu (WDC); jcondon@nrao.edu (JJC)                       is broken by the oblique hot ISM of the host galaxy (thin elliptical

C The Author(s) 2020.

Published by Oxford University Press on behalf of The Royal Astronomical Society. This is an Open Access article distributed under the terms of the Creative
Commons Attribution License (http://creativecommons.org/licenses/by/4.0/), which permits unrestricted reuse, distribution, and reproduction in any medium,
provided the original work is properly cited.
1272 W. D. Cotton et al.
2.1 Continuum flagging and calibration
The (u, v) data were converted from the archive format to AIPS
format using MeerKAT’s KATDAL package.1 The initial radio-
frequency interference (RFI) flagging followed that by Mauch et al.
(2020). We trimmed 144 channels from each end of the bandpass
and merged the 3808 remaining spectral channels into eight spectral
windows. Subsequent editing and calibration used the OBIT package
(Cotton 2008).2 In each calibration step, deviant solutions were
detected and flagged along with the corresponding (u, v) data. The
Figure 1. This reproduction of fig. 6(a) in Leahy & Williams (1984) shows
the main features of the hydrodynamical backflow model for XRGs.
gain/bandpass/flux-density calibrator is essentially unpolarized, so
the approximation XX = YY is valid. Standard structural and spectral
models for PKS B1934−638 and 3C 138 were used as appropriate.
contours) deflecting the backflows in opposite directions (bent
Downloaded from https://academic.oup.com/mnras/article/495/1/1271/5831730 by guest on 30 September 2020
Our flux-density scale is based on the Reynolds (1994) polynomial
arrows) and producing a radio source (heavy bent contours) with fit for the spectrum of PKS B1934−638:
only inversion symmetry about the nucleus. Although the radio ν
source may resemble a true XRG in low-resolution images, its log(S) = −30.7667 + 26.4908 log
MHz
actual shape is more like a double boomerang. ν 2 ν 3
In this paper, we present and analyse new 1.28 GHz images of − 7.0977 log + 0.605 334 log , (1)
the giant XRG PKS 2014−55 (Saripalli et al. 2008; Saripalli & MHz MHz
Subrahmanyan 2009) based on data from the recently completed where S is the flux density in Jy and ν is the frequency.
64-element MeerKAT array of the South African Radio Astronomy The main flagging and calibration steps were:
Observatory (SARAO) in the Northern Cape of South Africa. We
(i) Fixed flagging: Frequency ranges known to contain strong,
show that the morphology, spectrum, and magnetic field structure
persistent RFI were flagged. Projected baselines shorter than the
of this source are very consistent with the hydrodynamical model
13.5-m dish diameter were flagged to eliminate shadowing.
and are inconsistent with other proposed models for X shaped
(ii) Hanning smoothing: The spectral channels were Hanning
sources. The central component of PKS 2014−55 = PKS 2014−558
smoothed (channel weights 1/4, 1/2, 1/4) to reduce possible
= PKS J2018−556 (Wright & Otrupcek 1990) is identified by
Gibbs ringing from strong narrow band RFI. This doubled the
position coincidence with the mv ≈ 15.5 Seyfert II elliptical galaxy
effective channel bandwidth.
PGC 064440 (Paturel et al. 1989). PGC 064440 has heliocentric
(iii) Initial flagging: Running medians in time and frequency
redshift zh = 0.060 629 and velocity v h = 18176 ± 45 km s−1 (Jones
were compared with the data to reveal variable and/or narrow band
et al. 2009); corrected to the cosmic microwave background (CMB)
RFI for flagging.
frame (Fixsen et al. 1996) z = 0.060 252 and v = 18063 ± 46 km s−1 .
(iv) Initial X–Y phase calibration: Cross-hand phase correc-
All absolute quantities in this paper were calculated for a CDM
tions were determined from the noise diode calibration signals
universe with H0 = 70 km s−1 Mpc−1 and m = 0.3 using equations
injected into each data stream at the beginning of the observing
in Condon & Matthews (2018). Thus PGC 064440 is at comoving
session.
distance DC ≈ 254 Mpc, (bolometric) luminosity distance DL
(v) Delay calibration: Residual group delays were determined
≈ 270 Mpc, and angular diameter distance DA ≈ 240 Mpc so
from PKS B1934−638.
1 arcmin ≈ 70 kpc.
(vi) Bandpass calibration: Amplitude and phase correction
The radio observations and data reduction are described in Sec-
spectra were determined from PKS B1934−638.
tion 2, and the resulting images are presented in Section 3. Section 4
(vii) Amplitude and phase calibration: Complex gain solutions
discusses the morphology of the radio source and its host galaxy.
for PKS B1934−638 were determined and applied to the target field.
The data are interpreted with the asymmetric hydrodynamical model
(viii) Flagging of calibrated data: Flagging operations for
in Section 5. Our results are summarized in Section 6.
which calibrated data are needed were done.
(ix) Repeat: Flags from the steps (i)–(viii) were kept and the
calibration steps (iv)–(viii) were repeated.
2 O B S E RVAT I O N S A N D DATA R E D U C T I O N
(x) Polarization calibration: After a further averaging of two
The XRG PKS 2014−55 and its unpolarized gain/bandpass/flux- spectral channels, instrumental polarization was determined from
density calibrator PKS B1934−638 were observed by MeerKAT the unpolarized calibrator PKS B1934−638; solutions were ob-
for 9.7 h on 2019 October 11 using 55 of the 64 13.5-m diameter tained in 14.2-MHz blocks. The cross-hand delay and phase were
antennas in the array. One 10 min scan on the polarization calibrator determined from the polarized calibrator 3C 138. All polarization
3C 138 was also included. Additional information about MeerKAT calibration parameters, including feed orientation, were determined
and its specifications can be found in Jonas et al. (2016), Camilo jointly in a non-linear least squares solution using all calibrators.
et al. (2018), and Mauch et al. (2020). The maximum baseline length
Finally, the calibrated (u, v) data were averaged in time to reduce
used was nearly 8 km, giving θ ≈ 7 . 4 full width at half-maximum
their volume. The averaging times were subject to the baseline-
(FWHM) resolution at ν = 1.28 GHz. All four correlations XX, YY,
dependent constraint that averaging reduce the amplitudes by
XY, and YX of the orthogonal linearly polarized feeds were divided
≤1 per cent inside the circle of radius ρ = 1.◦ 2 centred on the
into 4096 spectral channels of width 0.208 984 MHz. The 856 MHz
target, and they never exceeded 30 s.
total bandpass centred on 1.284 GHz includes the 1.420 GHz H I line
near the z = 0.06 host galaxy PGC 064440 redshifted to 1.34 GHz,
where the channel width is v ≈ 47 km s−1 . The averaging time 1 https://libraries.io/github/ska-sa/katdal
was 8 s. 2 http://www.cv.nrao.edu/∼bcotton/Obit.html
MNRAS 495, 1271–1283 (2020)Hydrodynamical backflow in PKS 2014−55 1273
2.2 Continuum imaging process described above. After the continuum subtraction using
CASA’s UVCONTSUB task to fit a polynomial to the visibility spectra,
The continuum imaging used the OBIT task MFIMAGE, which was
we used CASA’s TCLEAN task with the widefield gridder performing
described in more detail by Cotton et al. (2018). The non-coplanar
1000 CLEAN iterations per channel. A Briggs weighting with
array in our extended synthesis was corrected by covering the
robust = 0.5 was used to optimize the shape of the dirty beam
imaged sky with small tangential facets out to radius ρ = 1.◦ 2
while minimizing sensitivity loss. We measured the image noise to
and placing additional facets on outlying sources stronger than
be σ ∼ 125 μJy beam−1 . The FWHM resolution in the H I cube is
S ≈ 6 mJy from the 843 MHz SUMSS catalogue (Mauch et al.
θ = 19 . 2 × 17 . 6.
2003). Variations of sky brightness and antenna gain across our wide
bandpass were accommodated by dividing the observed spectrum
into 34 frequency bins having ∼2 per cent fractional bandwidths.
The frequency bins were imaged independently and CLEANed 3 T H E R A D I O I M AG E S
jointly. Three iterations of phase self-calibration were applied. The
Downloaded from https://academic.oup.com/mnras/article/495/1/1271/5831730 by guest on 30 September 2020
CLEAN window was mostly generated automatically, but with 3.1 Total intensity continuum
some manual assistance to cover all of the extended emission.
UnCLEANed flux from the very extended radio source
The multiresolution Stokes I CLEAN used 1032 004 components,
PKS 2014−55 and background sources in the primary beam,
a 3 per cent loop gain, and included 3.394 Jy of total flux density
combined with the lack of projected baselines shorter than the
after CLEANing to a depth of 15 μJy beam−1 . Spectra were least-
13.5-m antenna diameter, left a wide but very shallow negative
squares fitted in each pixel using frequency bin weights inversely
‘bowl’ in the total-intensity image. We used the AIPS task IMEAN to
proportional to the square of the image-plane rms noise.
measure the mode of the intensity distribution of pixels in source-
Stokes Q and U were imaged out to a radius ρ = 1.◦ 0 and
free areas near PKS 2014−55; it is −4.6 ± 1.0 μJy beam−1 . To fill
CLEANed for 50 000 components to a depth of 28 μJy beam−1
in the bowl, we added 4.6 μJy beam−1 to the image zero level. We
in Stokes Q and 15 μJy beam−1 in Stokes U. Rotation measures
divided this image by the circularized 67 arcmin FWHM primary
(RMs) and electric-vector polarization angles (EVPAs) corrected
beam attenuation pattern specified by Mauch et al. (2020) equations
to zero wavelength for each pixel were derived by a search in RM
(3) and (4) to yield the final ‘sky’ image shown in Fig. 2. The actual
space, essentially taking the peak of the rotation measure synthesis
primary beam is slightly elliptical with axial ratio a/b ≈ 1.04 and
function Brentjens & de Bruyn (2005). The RM that gave the
rotates with parallactic angle on the sky. However, the maximum
highest polarized
intensity in the average RM-corrected value of
attenuation error introduced by our circular approximation is a
the P = Q2 + U 2 was taken as the RM, the peak average P
negligible1274 W. D. Cotton et al.
Downloaded from https://academic.oup.com/mnras/article/495/1/1271/5831730 by guest on 30 September 2020
Figure 2. This 1.28 GHz MeerKAT ‘sky’ image of PKS 2014−55 was restored with a θ1/2 ≈ 7 . 4 ≈ 8.6 kpc FWHM Gaussian beam, corrected for the
−4.6 ± 1.0 μJy beam−1 bowl, and divided by the primary attenuation pattern. The rms noise plus confusion is σ = 3.5 ± 0.2 μJy beam−1 = 48 ± 3 mK. The
logarithmic grey scale spans 0.006–6 mJy beam−1 (grey-scale bar at top) to reveal the extremely faint (Tb ∼ 0.5 K) radio cocoons most conspicuous on the
east side of the northern arm and on the west side of the southern arm. The bright central region is completely saturated, but it is accurately represented by the
contour map in Fig. 3.
MNRAS 495, 1271–1283 (2020)Hydrodynamical backflow in PKS 2014−55 1275
-55 39 05 The fractional polarization is high (30–50 per cent) over most
of the main lobes indicating very organized magnetic fields. In the
10 secondary lobes, the fractional polarization approaches 80 per cent
15 indicating very little scatter in the magnetic field orientations.
On the other hand, the brighter Stokes I regions at the apexes
20 of the ‘boomerangs’ typically have around 15 per cent fractional
Declination (J2000)
polarization indicating a more tangled magnetic field structure.
25
30 3.3 Continuum spectral index
35 The spectral-index image is given in Fig. 6. The spectrum in the
lobes is steep everywhere, flattening somewhat near the bright
40
regions inside the apexes of the ‘boomerangs’ and becoming very
Downloaded from https://academic.oup.com/mnras/article/495/1/1271/5831730 by guest on 30 September 2020
45 steep in the cocoons and near the ends of the secondary lobes. We
hesitate to provide quantitative estimates of the spectral-index errors
50 because they are largely systematic, caused by limited sampling near
55
the centre of the (u, v) plane. Further analysis of the spectral index
is being developed for a subsequent paper.
20 18 04 03 02 01 00 17 59
Right Ascension (J2000)
4 T H E R A D I O S O U R C E P K S 2 0 1 4 −5 5 A N D I T S
Figure 3. The bright central region of PKS 2014−55 at 1.28 GHz HOST GALAXY PGC 064440
is represented by contours at 1 mJy beam−1 × 20 , 21 , 22 , . . . , 27 . The
cross marks the accurate position J2000 α = 20h 18m 01.s 286, δ = 4.1 The radio source PKS 2014−55
−55◦ 39 31. 59 (Skrutskie et al. 2006) of the near-infrared source 2MASX
The S = 2.36 Jy radio source with spectral index α ≈ −0.8 has
J201801.27−553931.5 identified with PGC 064440.
spectral luminosity Lν ≈ 2.0 × 1025 W Hz−1 at ν = 1.28 GHz
Table 1. The positions, 1.28 GHz flux densities, deconvolved major and in the source frame. Such luminous sources (Ledlow & Owen
minor diameters between half-maximum points, and major-axis position 1996) usually have FR II morphologies (Fanaroff & Riley 1974)
angles of Gaussian fits to the central region of PKS 2014−55. characterized by narrow jets leading to hotspots in edge-brightened
lobes. PKS 2014−55 does not (Fig. 2); its long, filamentary, and
J2000 S φM × φm PA diffuse main ‘jets’ are only decaying relics of activity that ceased
(arcsec × millions of years ago. Saripalli & Subrahmanyan (2009) found
α δ (mJy) arcsec) (deg) several examples of XRGs lacking hotspots at the ends of their relic
jets and noted that the current lack of hotspots cannot be used to
20h 18m 00 s.84 −55◦ 39 22 . 9 88 5.2 × 1.4 159
20h 18m 01 s.2 −55◦ 39 31 32 ± 6 0×0 ... rule out backflows from earlier jets that have since decayed.
20h 18m 01 s.74 −55◦ 39 38 . 5 211 5.4 × 1.1 154 The current spectral brightnesses of the relic jets are only
Tb ∼ 14 K, so their minimum-energy magnetic field strengths Bmin
(e.g. Pacholczyk 1970; Worrall & Birkinshaw 2006) are low. For
Saripalli et al. (2008) imaged the central region of PKS 2014−55 electrons emitting at their critical frequencies from ν1 = 107 to
with sub-arcsec resolution and found five nearly collinear radio ν2 = 1010 Hz, proton/electron energy ratio κ, and source line-of-
components: a central core, an inner double source, and an outer sight depth d,
double source. The position angles of their inner and outer dou- 2/7
bles are +150◦ and +156◦ , respectively. Thus each long, narrow Bmin Tb ν(1 + z) 2−α kpc
≈ 0.57 (1 + κ)2/7
Gaussian component in Table 1 is a blend of two relatively compact μG K GHz d
sources. The Saripalli et al. (2008) radio core has a fairly flat (α > (2)
−0.5) spectrum above ν = 1.28 GHz, so it is probably synchrotron
in convenient astronomical units. Even for a line-of-sight depth
self-absorbed and completely unresolved.
d = 100 kpc and a high proton/electron energy ratio κ = 2000, the
magnetic field strength is only Bmin ∼ 3 μG and the correspond-
3.2 Polarization ing synchrotron lifetime τ ∼ c12 B −3/2 ∼ 1.3 × 10¹⁶ s ∼ 4 × 10⁸ yr
(Pacholczyk 1970) is very long. The energy density of the CMB at
The rotation measure in front of PKS 2014−55 is shown in Fig. 4. z = 0.06 is the same as that of a B ∼ 3.7 μG magnetic field, so
It is RM ∼ 40 rad m−2 and varies by only a few rad m−2 across the inverse–Compton (IC) scattering off the CMB reduces the radiative
source, so it may originate primarily in our Galaxy. lifetimes in the relic jets to τ ∼ 2 × 10⁸ yr. The spectral steepening
Polarization ‘B’ vectors at zero wavelength parallel to the at the ends of the wings visible in Fig. 6 indicate ages τ 108 yr.
magnetic field orientation in the emitting region are plotted as short This result is typical of giant radio galaxies (Ishwara-Chandra &
line segments in Fig. 5. The lengths of the vectors are proportional to Saikia 1999). The minimum relativistic pressure
the fractional polarization. The magnetic vectors are nearly parallel 2
13Bmin
to the main jets, as in most FR II (Fanaroff & Riley 1974) sources Pmin = (3)
(Bridle et al. 1994). In contrast, the magnetic vectors are usually 72π
perpendicular to the jets in FR I sources (Bridle & Perley 1984). in most of PKS 2014−55 is Pmin ∼ 10−14 (1 + κ)4/7 dyne cm−2 .
Fig. 5 shows that the magnetic field B closely follows the apparent At DA ≈ 240 Mpc, 1 arcsec ≈ 1.164 kpc and the largest angular
flow around the bends in PKS 2014−55. extent φ ≈ 22. 5 of PKS 2014−55 implies a projected overall
MNRAS 495, 1271–1283 (2020)1276 W. D. Cotton et al.
Downloaded from https://academic.oup.com/mnras/article/495/1/1271/5831730 by guest on 30 September 2020
Figure 4. This image shows the rotation measure RM on a grey scale. The scale bar at the top has units rad m−2 . Total-intensity contours are plotted at
brightnesses 100 μJy beam−1 × 20 , 21 , 22 , . . . . The θ1/2 ≈ 7 . 4 restoring beam half-power circle is shown in the small box in the lower left corner.
length l ≈ 1.57 Mpc. This is more than twice the traditional of PKS 2014−55 easily satisfy this criterion: their total projected
minimum size defining a giant radio source, l ≈ 1 Mpc for H0 extent is φ ≈ 14. 0 or l ≈ 0.98 Mpc. The two long arms have
= 50 km s−1 Mpc−1 (Willis, Strom & Wilson 1974), or l ≈ nearly equal projected lengths (11. 7 and 10. 8 for the NW and
0.7 Mpc for H0 = 70 km s−1 Mpc−1 . Even the backflow wings SE arms, respectively) and flux densities (1.033 and 1.025 Jy),
MNRAS 495, 1271–1283 (2020)Hydrodynamical backflow in PKS 2014−55 1277
Downloaded from https://academic.oup.com/mnras/article/495/1/1271/5831730 by guest on 30 September 2020
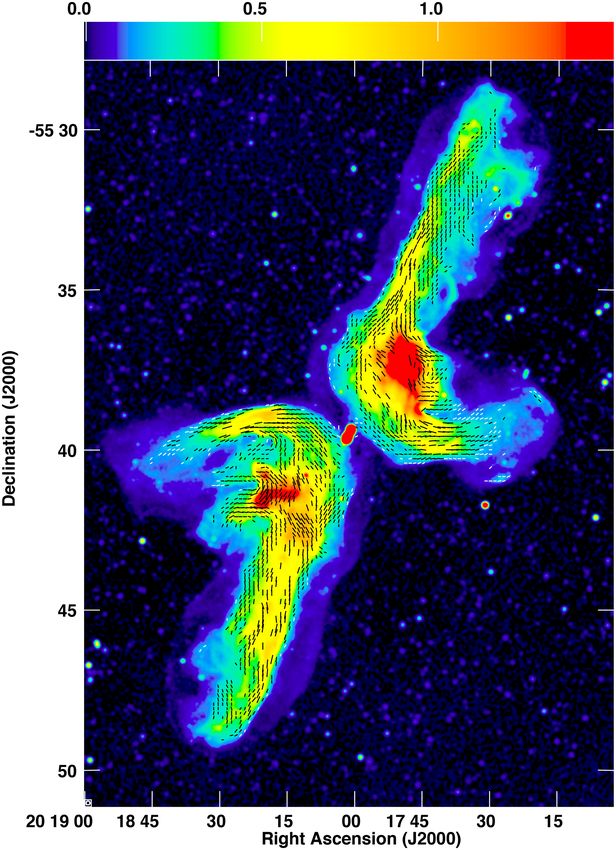
Figure 5. The black and white lines are parallel to B and have length 1 arcsec per P = 4.2 per cent fractional polarization. The colour bar gives the linear
total-intensity scale between −0.005 and 1.5 mJy beam−1 . The θ1/2 ≈ 7 . 4 restoring beam half-power circle is shown in the small box in the lower left corner.
so they show no evidence for relativistic time delays or flux PGC 064440 is not in a cluster environment rich enough to have
boosting. a significant intracluster medium. Malarecki et al. (2015) made a
PKS 2014−55 extends far beyond the virial radius of its host spectroscopic study of the Mpc-scale environments for a sample
galaxy and directly probes the ambient intergalactic medium (IGM). of low-redshift giant radio galaxies including PKS 2014−55. The
MNRAS 495, 1271–1283 (2020)1278 W. D. Cotton et al.
Downloaded from https://academic.oup.com/mnras/article/495/1/1271/5831730 by guest on 30 September 2020
Figure 6. The grey scale image shows the spectral index α with values given by the scale bar at the top. The white contours mark total intensities
0.5 mJy beam−1 × 20 , 21/2 , 21 . . . . The 15 arcsec half-power circle is drawn inside the small box at the lower right.
number density of galaxies more luminous than −19.49 mag in a The faint radio cocoons in Fig. 7 are defined by their fairly
cylinder of 1 Mpc radius and 24 Mpc length along the line-of-sight constant brightness temperatures Tb ∼ 0.5 K between sharp inner
centred on PKS 2014−55 is only n ∼ 0.066 Mpc−3 , a typical density and outer boundaries. Fig. 6 shows that they have the steep spectra
in galaxy groups and poor clusters, but a factor of 10 lower than in produced by radiative losses, so, like the relic jets, they too may be
galaxy clusters. relics of even earlier activity. Inserting Tb = 0.5 K, ν = 1.28 GHz,
MNRAS 495, 1271–1283 (2020)Hydrodynamical backflow in PKS 2014−55 1279
Downloaded from https://academic.oup.com/mnras/article/495/1/1271/5831730 by guest on 30 September 2020
Figure 7. Portions of the cocoons surrounding the northern (left-hand panel) and the southern relic jets (right-hand panel) are shown with contours at
Tb = 0.25 K × 1, 2, 3, . . . , 10 to emphasize their sharp inner and outer boundaries. The average brightness temperature in the cocoons is Tb ∼ 0.5 K. The
logarithmic grey scale spans −0.12 K = −0.008 mJy beam−1 (black) to +20 K = +1.46 mJy beam−1 (white) as indicated by the scale bar at the top.
and line-of-sight depth d = 100 kpc into equation (2) yields In the limit Pe Pc , inserting Pc = Pmin into equation (4) predicts
Bmin ≈ 0.15(1 + κ)2/7 μG in the cocoon of PKS 2014−55. The that the cocoon boundary should be expanding into the surrounding
corresponding magnetic energy density is UB ∼ 1.0 × 10⁻¹⁵ (1 + medium with speeds between v ⊥ ∼ 200(1 + κ)2/7 (IGrM) and v ⊥ ∼
κ)4/7 erg cm−3 and the minimum relativistic pressure in the cocoons 700(1 + κ)2/7 km s−1 (IGM). These expansion speeds are subsonic
is Pmin ∼ 1.3 × 10⁻¹⁵ (1 + κ)4/7 dyne cm−2 . These low-pressure in the radio cocoons, allowing the cocoons enough time to reach
cocoons are exceptionally sensitive barometers for measuring the pressure equilibrium (Begelman, Blandford & Rees 1984) and attain
pressure of the intragroup medium (IGrM) or the IGM (Malarecki their constant brightness temperatures. The PKS 2014−55 cocoons
et al. 2013). are l⊥ ≈ 50 kpc wide, so the expansion time-scales τ ≡ l⊥ /v ⊥ of
If the pressure Pe in the external medium is less than the cocoon the cocoons are 70(1 + κ)−2/7 τ (Myr) 250(1 + κ)−2/7 .
pressure Pc , the cocoon should expand laterally with speed v ⊥ at The energy density of the CMB surrounding PKS 2014−55 at z =
which the ram pressure balances the cocoon overpressure 0.06 is UCMB = 5.3 × 10⁻¹³ erg cm−3 . It is larger than the magnetic
energy density in the cocoon even in the unlikely event (Beck &
Pc − Pe 1/2 Krause 2005) that κ > mp /me ∼ 2000. The ratio of IC losses to
v⊥ = , (4)
ρe synchrotron losses is UCMB /UB , so the radiative lifetimes ∼ 100 Myr
where ρ e is the external mass density. The IGM may contain half of relativistic electrons in the cocoons are strongly limited by IC
of all baryons and b ≈ 0.046, so a lower limit to the external mass scattering off the CMB, not by synchrotron radiation.
density at redshift z = 0.06 is the mean baryonic IGM density
b 3H02 (1 + z)3 4.2 The host galaxy PGC 064440
ρe ≈ 2.5 × 10⁻³¹ g cm−3 . (5)
2 8π G The total stellar mass M∗ of PGC 064440 can be estimated
For a primordial abundance of fully ionized H and He, the mean photometrically from its λ = 2.17 μm absolute magnitude MK using
mass per particle is μe ≈ 0.6mp ≈ 1.0 × 10⁻²⁴ g and the particle den- the empirical relation (Cappellari 2013)
sity is ne = ρ e /μe ≈ 2.5 × 10⁻⁷ cm−3 . PGC 064440 is in a poor group
log10 (M∗ /M ) ≈ 10.58 − 0.44(MK + 23) . (6)
of galaxies, where the IGrM particle density is ∼10× as high and
the temperature range is 106 K < T < 107 K (Stocke et al. 2019), The 2MASX apparent magnitude of PGC 064440 is mK = 11.64, the
so the external particle pressure Pe = nkT ≈ 10−15 dyne cm−2 . distance modulus is 32.16, and the K correction is K ≈ 6.0log10 (1
Even if κ = 0, the minimum cocoon pressure is comparable with + z) ≈ −0.15 mag (Kochanek et al. 2001), so MK ≈ −25.37 and
the external pressure. Higher κ or non-equipartition magnetic fields the total mass of stars inside the photometric radius r ∼ 34 kpc is
would only increase the cocoon pressure. log10 (M∗ /M ) ≈ 11.6.
MNRAS 495, 1271–1283 (2020)1280 W. D. Cotton et al.
-55 39 05
10
15
20
Declination (J2000)
25
30
35
40
Downloaded from https://academic.oup.com/mnras/article/495/1/1271/5831730 by guest on 30 September 2020
45
50
55
20 18 04 03 02 01 00 17 59
Right Ascension (J2000)
Figure 8. The DES DR1 r-band optical image of PGC064440 reveals a Figure 9. The DES r-band brightness contours are shown at 16 electrons ×
faint dust lane just north-west of the nucleus. 1, 2, 4, 8, 16, 32, 64, 128, and 256. The 10 arcsec × 1. 3 ellipse in PA ≈
20◦ at the centre represents the dust lane as a tilted ring, only the northwestern
The mid-infrared source WISEA J201801.29−553931.5 (Wright near side of which is visible in absorption.
et al. 2010) coincides with PGC 064440. Its mid-infrared colours
Table 2. Best-fitting ellipses for the dust lane and outer brightness
(W2 − W3) = +3.066 and (W1 − W2) = +1.256 are typical of
contours of PGC 064440.
Seyfert galaxies and far from the colours of elliptical galaxies whose
mid-infrared emission is dominated by stellar photospheres (Jarrett
φM × φm PA cos −1 (φ m /φ M )
et al. 2011). This mid-infrared evidence for circumnuclear dust (arcsec ×
heated by an active galactic nucleus (AGN) is supported by the Ellipse arcsec) (deg) (deg)
presence of a heavily obscured (column density log [NH (cm−2 )]
= 23.51 ± 0.14) hard X-ray source at the centre of PKS 2014−55 Dust ring 10 × 1.3 +20 82
(Panessa et al. 2016) and the absence of broad optical emission lines. First r contour 42 × 27 +9 50
Third r contour 20 × 14 +10 46
Star formation may also contribute to the mid-infrared emission
Ks total 57.8 × 41.6 +15 44
from PGC 064440.
PGC 064440 is a Seyfert II galaxy with very strong high-
ionization ([O III]/H β ∼ 13) emission lines (Simpson et al. 1996). Backflows from extended radio jets can be treated as fluid
Many powerful radio galaxies have extended emission-line regions flows because their magnetic fields are strong enough that even
(EELRs) with radii 100 kpc. Tadhunter, Fosbury & Quinn (1989) ultrarelativistic protons and electrons have Larmor radii much
observed the [O III]λ5007 line of PGC 064440 with a long slit in smaller than the jet radius. Magnetic lines of force are frozen into
PA = 192◦ nearly parallel to the continuum major axis and found the jet fluid, so velocity shear across the jet tends to align the
emission extending ∼11 kpc on both sides of the nucleus with magnetic field along the jet, and jet growth can increase the frozen-
the linear velocity field of a constant-density enclosed mass and in magnetic field strength to near equipartition. Many astrophysical
maximum rotation velocity |Vmax | ≈ 280 km s−1 relative to the jets are stable enough to survive bending, as demonstrated by the
nucleus, indicating a total mass M ∼ 2 × 10¹¹ M within ∼11 kpc bent tails of radio galaxies moving through dense gas in massive
of the nucleus. galaxy clusters.
5 T H E H Y D RO DY N A M I C A L BAC K F L OW 5.1 Backflow geometry
MODEL
A faint dust lane extending ∼10 arcsec (∼ 12 kpc) is just visible in
The extended radio jets of most high-luminosity sources are the DES DR1 (Abbott et al. 2018) r-band image of PGC 064440
linear and inversion symmetric about their host galaxies. Leahy (Fig. 8). Fig. 9 is the corresponding r-band brightness contour
& Williams (1984) noted that opposing axisymmetric backflows plot. The narrow inner ellipse represents the tilted circular ring
could form a fat disc expanding laterally where they encountered that overlaps the dust lane, of which only the near half is visible
the hot ISM of their host galaxy, but a misaligned ellipsoidal hot in absorption. The two larger ellipses are fits to the first and third
gas halo could break the axial symmetry and bend the backflows in brightness contours in Fig. 9. The parameters of these ellipses and
opposite directions away from the ellipsoid major axis to produce the 2MASS Ks ‘total’ isophotal ellipse are listed in Table 2. The
the secondary arms or ‘wings’ of XRGs (Fig. 1). Saripalli & isophotal ellipticities ≡ 1 − (φ m /φ M ) are in the range 0.28 < <
Subrahmanyan (2009) found that XRGs lacking FR II hotspots 0.36. They indicate that PGC 064440 is an oblate ellipsoid whose
often contain inner doubles, indicating restarted jets along the same equatorial position angle is PA = 15◦ ± 5◦ and whose projected
axis, and they proposed that the wings are asymmetric backflows. polar axis is at PA = 105◦ ± 5◦ . If the dust lane is an equatorial
MNRAS 495, 1271–1283 (2020)Hydrodynamical backflow in PKS 2014−55 1281
Figure 11. The bright bent ‘head’ and long dark ‘tail’ in this continuum
Downloaded from https://academic.oup.com/mnras/article/495/1/1271/5831730 by guest on 30 September 2020
image suggest blockage of the backflow by an obstacle of size ∼10 kpc.
The contour levels are 200 μJy beam−1 × 1, 2, 3, . . . , 8.
The biggest challenge to the hydrodynamical backflow model
presented by PKS 2014−55 is the need to deflect both of its very
wide (observed width ∼ 150 kpc, which we treat as a cylinder of
radius r ∼ 75 kpc) backflows cleanly in opposite directions without
splitting them. This requires that the hot ISM have both a high
ellipticity and a large semimajor axis l. Capetti et al. (2002) found
that XRG host galaxies in a small sample all have > 0.17, a
criterion easily satisfied by PGC 064440, while only three in their
Figure 10. The straight line segment centred on PGC 064440 is 1.57 Mpc reference sample of 15 3C FR II galaxies have ≥ 0.3, the ellipticity
long at the PA = 154◦ of the line connecting the two inner radio lobes. of PGC 064440.
The ISM of PGC 064440 is represented by an ellipse having an l = 250 kpc When they encounter the hot halo ISM of the host galaxy,
semimajor axis at the same PA = 15◦ and ellipticity = 0.3 as the distribution backflows initially parallel to the main jets are deflected towards the
of stellar mass traced by the Ks isophote (Table 2). The angle between the most negative pressure gradient. The ellipse in Fig. 10 represents
jet and the major axis of the ellipse is = 15◦ + (180−154)◦ = 41◦ . an isobaric contour, so backflows bend away from the directions in
which the angle between the backflow and the constant-pressure
contour of the ellipse is1282 W. D. Cotton et al.
there are three weaker examples in the eastern backflow near reobserved the dumbbell galaxy NGC 326 with the Low-Frequency
J2000 α = 20h 18m 18. 9, δ = −55◦ 39 45 , α = 20h 18m 22. 3, δ = Array (LOFAR) at 144 MHz and found faint, extended radio
−55◦ 39 35 , and α = 20h 18m 22. 3, δ = −55◦ 41 04 . The appar- morphological evidence for hydrodynamical effects related to an
ent width of the dark tails is slightly larger than the 7 . 4 resolution ongoing group or cluster merger. Although their result does not rule
of the radio image. The corresponding linear diameter ∼10 kpc out the spin-flip model for NGC 326, we endorse their caution not
is comparable with the size of cold H I discs in spiral galaxies. to infer jet reorientation in XRGs lacking deep and detailed radio
However, we detected no H I line emission and found no visible images.
galaxies on the DES images downstream of the heads. Furthermore, The new MeerKAT continuum image also revealed faint (Tb ∼
10 kpc is much smaller than the 2r ∼ 150 kpc diameter of the 0.5 K) low-pressure (Pmin ∼ 10−14 dyne cm−2 ) cocoons with sharp
backflows. The line-of-sight depth of the backflows from such wide edges and the nearly constant brightness characteristic of subsonic
axially symmetric jets should be 10 kpc, so a 10 kpc obstacle (in the cocoons) expansion into the surrounding intragroup medium
could not reduce the backflow brightness by the observed amount probed by the giant source PKS 2014−55. This pressure assumes
shown in Fig. 11, which is more than a factor of two. κ = 40. The pressure in the cocoons could range from Pmin ∼
Downloaded from https://academic.oup.com/mnras/article/495/1/1271/5831730 by guest on 30 September 2020
The dark tail in Fig. 11 cannot be attributed to free–free absorption 10−15 dyne cm−2 if κ = 0 to Pmin ∼ 10−13 dyne cm−2 if κ = 2000.
in an intervening ionized cloud with kinetic temperature T 104 K
because an absorber with optical depth τ emits with brightness
temperature Tb = T[1 − exp (− τ )], and the 1.28 GHz brightness AC K N OW L E D G E M E N T S
temperature Tb ∼ 2 K of the tail implies τ < 10−3 .
The MeerKAT telescope is operated by the South African Radio
Fig. 10 shows that the dark tails appear in the downstream sides
Astronomy Observatory which is a facility of the National Research
of both backflows near the deflecting halo boundary indicated
Foundation, an agency of the Department of Science and Innovation.
by the ellipse. It also shows two matching bright regions, one
The National Radio Astronomy Observatory is a facility of the Na-
just inside the apex of each ‘boomerang’. These bright regions
tional Science Foundation, operated under a cooperative agreement
are probably not traditional FR II hotspots because they are not
by Associated Universities, Inc. This research has made use of the
in the radio jets and they do not have the usual edge-brightened
NASA/IPAC Extragalactic Database (NED), which is funded by the
morphology. We suggest that the bright regions indicate compres-
National Aeronautics and Space Administration and operated by
sion and turbulence where backflow material is piling up inside
the California Institute of Technology. This research uses services
the apex. Turbulence on scales smaller than our θ1/2 = 7 . 4 beam
or data provided by the National Optical Astronomy Observatory
could explain the low observed polarized intensity in the brighter
(NOAO) Data Lab. The NOAO is operated by the Association
northwestern region (Fig. 5). We suspect that the matched sets of
of Universities for Research in Astronomy (AURA), Inc. under
dark tails are simply hydrodynamical features downstream of the
a cooperative agreement with the National Science Foundation. K.
bright regions, and do not actually indicate the presence of external
Thorat acknowledges support from the Inter-University Institute for
obstructions.
Data Intensive Astronomy (IDIA). The financial assistance of the
South African Radio Astronomy Observatory (SARAO) towards
6 S U M M A RY this research is hereby acknowledged (http://www.ska.ac.za).
We thank the anonymous referee for numerous valuable sugges-
The hydrodynamical backflow model for PKS 2014−55 is sup-
tions to improve our manuscript.
ported by the following evidence:
(i) The observed ‘double boomerang’ radio morphology is ex-
pected for backflows from a pair of collinear jets redirected by the REFERENCES
oblique hot ISM of the host galaxy. Both the magnetic fields and
Abbott T. M. C. et al., 2018, ApJS, 239, 18
the total-intensity ridges follow the continuously bending flow lines.
Beck R., Krause M., 2005, Astron. Nachr., 326, 414
Two matching bright regions inside the boomerang apexes suggest
Begelman M. C., Blandford R. D., Rees M. J., 1984, Rev. Mod. Phys., 56,
compression and turbulence where backflow material is piling up. 255
Bright heads and dark tails appear between both bright regions and Blandford R. D., Znajek R. L., 1977, MNRAS, 179, 433
their backflow wings. They appear to be features in the flow, not Brentjens M. A., de Bruyn A. G., 2005, A&A, 441, 1217
signs of obstruction by the ISM of nearby galaxies. Bridle A. H., Perley R. A., 1984, ARA&A, 22, 319
(ii) AGN activity in PKS 2014−55 has recently restarted (Fig. 3) Bridle A. H., Hough D. H., Lonsdale C. J., Burns J. O., Laing R. A., 1994,
with the reborn jets in the same direction (Fig. 10) as the main lobe. AJ, 108, 766
Thus, the secondary wings are very unlikely to be the result of a Camilo F. et al., 2018, ApJ, 856, 180
change in the orientation of the spin axis of the SMBH. Capetti A., Zamfir S., Rossi P., Bodo G., Zanni C., Massaglia S., 2002,
A&A, 394, 39
(iii) The virial halo of the host galaxy PGC 064440 is large
Cappellari M., 2013, ApJ, 778, L2
enough and has the correct position angle to cleanly deflect
Condon J. J., Matthews A. M., 2018, PASP, 130, 073001
backflows from the wide main jets in the direction observed. Cotton W. D., 2008, PASP, 120, 439
The unique combination of high surface-brightness sensitivity Cotton W. D. et al., 2018, ApJ, 856, 67
Dennett-Thorpe J., Scheuer P. A. G., Laing R. A., Bridle A. H., Pooley G.
(σ ≈ 48 mK), high angular resolution (θ1/2 ≈ 7 . 4), and dense (u,
G., Reich W., 2002, MNRAS, 330, 609
v)-plane coverage of our new MeerKAT continuum image makes
Ekers R. D., Fanti R., Lari C., Parma P., 1978, Nature, 276, 588
the very extended radio source PKS 2014−55 the best example Fanaroff B. L., Riley J. M., 1974, MNRAS, 167, 31P
of an XRG produced by hydrodynamical backflows from a jet Fixsen D. J., Cheng E. S., Gales J. M., Mather J. C., Shafer R. A., Wright
with fixed orientation. The prototypical XRG NGC 326 has been E. L., 1996, ApJ, 473, 576
cited as evidence for jet reorientation following an SMBH–SMBH Hardcastle M. J. et al., 2019, MNRAS, 488, 3416
merger (Merritt & Ekers 2002). However, Hardcastle et al. (2019) Hindson L. et al., 2014, MNRAS, 445, 330
MNRAS 495, 1271–1283 (2020)Hydrodynamical backflow in PKS 2014−55 1283
Hodges-Kluck E. J., Reynolds C. S., Cheung C. C., Miller M. C., 2010, ApJ, Willis A. G., Strom R. G., Wilson A. S., 1974, Nature, 250, 625
710, 1205 Worrall D. M., Birkinshaw M., 2006, Multiwavelength Evidence of the
Ishwara-Chandra C. H., Saikia D. J., 1999, MNRAS, 309, 100 Physical Processes in Radio Jets, Lect. Notes Phys. 693. Springer-Verlag
Jarrett T. H. et al., 2011, ApJ, 735, 112 Berlin Heidelberg, New York, p. 39
Jonas J. et al., 2016, in Taylor R. et al., eds, Proc. Sci., The MeerKAT Radio Worrall D. M., Birkinshaw M., Cameron R. A., 1995, ApJ, 449, 93
Telescope. SISSA, Trieste, PoS(MeerKAT2016)001 Wright A., Otrupcek R., 1990, PKS Catalog, Australia Telescope National
Jones D. H. et al., 2009, MNRAS, 399, 683 Facillity. Epping, NSW, Australia
Joshi R. et al., 2019, ApJ, 887, 266 Wright E. L. et al., 2010, AJ, 140, 1868
Klein U., Mack K.-H., Gregorini L., Parma P., 1995, A&A, 303, 427
Kochanek C. S. et al., 2001, ApJ, 560, 566
Lal D. V., Rao A. P., 2005, MNRAS, 356, 232 APPENDIX: MINIMUM SIZE OF THE
Leahy J. P., Williams A. G., 1984, MNRAS, 210, 929 DEFLECTING HALO
Ledlow M. J., Owen F. N., 1996, AJ, 112, 9
Malarecki J. M., Staveley-Smith L., Saripalli L., Subrahmanyan R., Jones In the coordinate system with x parallel to the major axis and y
Downloaded from https://academic.oup.com/mnras/article/495/1/1271/5831730 by guest on 30 September 2020
D. H., Duffy A. R., Rioja M., 2013, MNRAS, 432, 200 parallel to the minor axis, the equation of the deflecting ellipse with
Malarecki J. M., Jones D. H., Saripalli L., Staveley-Smith L., Subrahmanyan semimajor axis l and ellipticity is
R., 2015, MNRAS, 449, 955 2
y
Mauch T., Murphy T., Buttery H. J., Curran J., Hunstead R. W., Piestrzynski x2 + = l2 (A1)
B., Robertson J. G., Sadler E. M., 2003, MNRAS, 342, 1117 1−
Mauch T. et al., 2020, ApJ, 888, 61 and tangents to the ellipse have slopes
McMullin J. P., Waters B., Schiebel D., Young W., Golap K., 2007, ASP
Conf. Ser. Vol. 376, Astronomical Data Analysis Software and Systems dy x
= −(1 − )2 . (A2)
XVI. Astron. Soc. Pac., San Francisco, p. 127 dx y
Merritt D., Ekers R. D., 2002, Science, 297, 1310
Pacholczyk A. G., 1970, Radio astrophysics. Nonthermal Processes in If is the angle between the backflow and the x axis, the equation
Galactic and Extragalactic Sources. W. H. Freeman and Company, San of the outermost backflow of radius r is
Francisco r
y = x tan − (A3)
Panessa F. et al., 2016, MNRAS, 461, 3153 cos
Paturel G., Fouque P., Bottinelli L., Gouguenheim L., 1989, A&AS, 80, 299 and the initial slope of the backflow is tan . At the point (xi , yi )
Reynolds J. E., 1994, ATNF Memo, AT/39.3/040 where it intersects the ellipse at a 90◦ angle, the slope of the ellipse
Saripalli L., Subrahmanyan R., 2009, ApJ, 695, 156 is −(tan )−1 and
Saripalli L., Subrahmanyan R., Laskar T., Koekemoer A., 2008, Proc. Sci.,
yi
052, 130 = (1 − )2 tan . (A4)
Shull J. M., 2014, ApJ, 784, 142 xi
Simpson C., Ward M., Clements D. L., Rawlings S., 1996, MNRAS, 281, The point (xi , yi ) must also satisfy equation (A1) so
509
Skrutskie M. F. et al., 2006, AJ, 131, 1163 xi = l[1 + (1 − )2 tan2 ]−1/2 . (A5)
Stocke J. T., Keeney B. A., Danforth C. W., Oppenheimer B. D., Pratt C. T.,
Berlind A. A., Impey C., Jannuzi B., 2019, ApJS, 240, 15
Tadhunter C. N., Fosbury R. A. E., Quinn P. J., 1989, MNRAS, 240, 225
Wechsler R. H., Tinker J. L., 2018, ARA&A, 56, 435 This paper has been typeset from a TEX/LATEX file prepared by the author.
MNRAS 495, 1271–1283 (2020)You can also read