Impact of Pinnipeds on Chinook Salmon - Nate Pamplin, Dr. Scott Pearson, and Dr. Joe Anderson - WDFW
←
→
Page content transcription
If your browser does not render page correctly, please read the page content below
Impact of Pinnipeds on
   Chinook Salmon
 Nate Pamplin, Dr. Scott Pearson, and
         Dr. Joe Anderson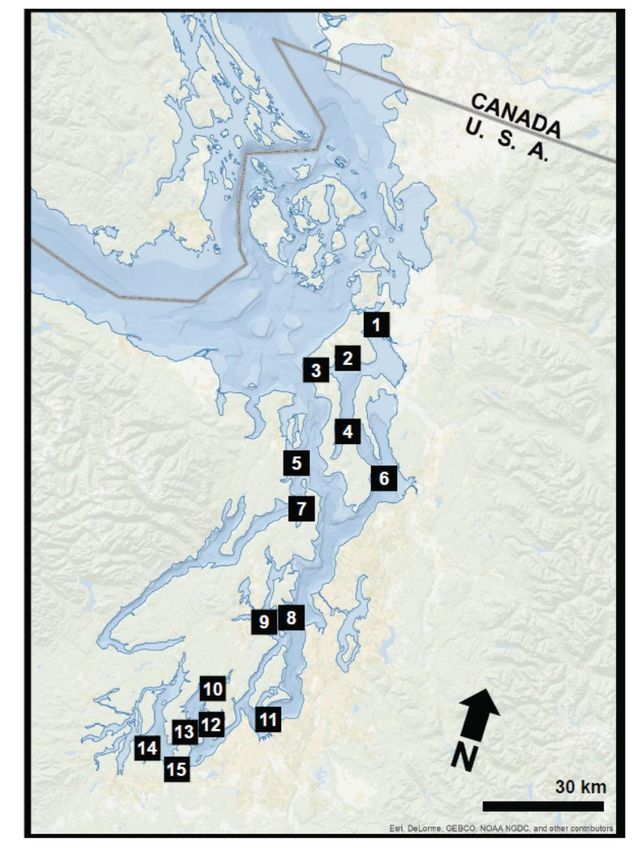
Acknowledgments
Collaboration and research            Funding
• Ben Nelson                          • Long Live the Kings and Salish
• Steve Jeffries                        Sea Marine Survival Project
• Nisqually Indian Tribe              • Washington State General Fund
• Squaxin Island Tribe                • Dingell-Johnson Sportfish
• Austen Thomas                         Restoration Act Funds
• Bill Walker                         • U.S. Navy
• Monique Lance                       • Salmon Recovery Funding Board
• The countless WDFW and tribal       • WRIA 8 & 9 Cooperative
  biologists responsible for salmon     Watershed Management Grant
  population monitoring                 program
• WDFW biologists and technicians     • U.S. Army Corps Engineers
  responsible for pinniped            • Tacoma Water
  monitoring                          • Seattle Public Utilities and
                                        Seattle City Light               2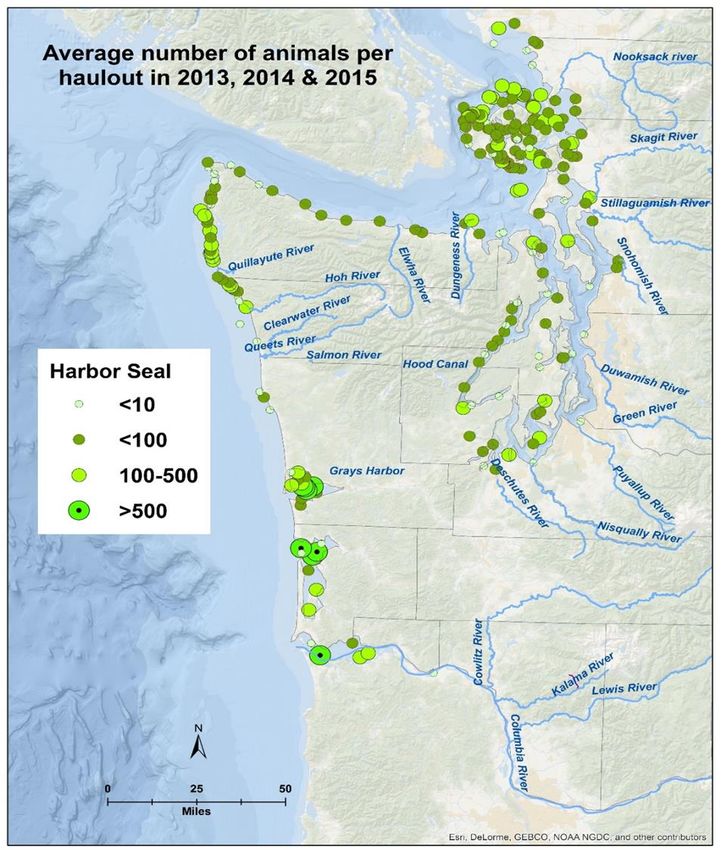
Questions
• What are the primary salmon-eating pinnipeds in Washington?
• Where are they located? How many are there? And what are their
  population trends?
• What do they eat?
• How many juvenile Chinook do harbor seals consume?
• How many adult Chinook equivalents does this rate of juvenile
  consumption represent?
• What level of seal removal is needed to achieve meaningful increases in
  adult Chinook return rates?
• What other information do we need?
• What administrative options are there to reduce pinniped predation?
                                                                      3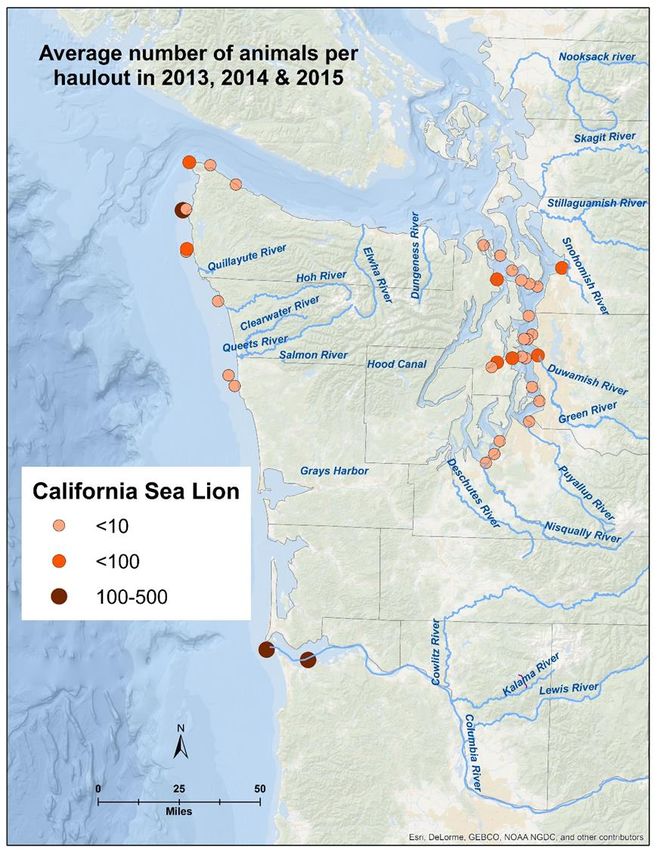
Complex Food Web

       Source: Strait of Georgia ecosystem model – D. Preikshot & I. Perry,   4
       Fisheries and Oceans Canada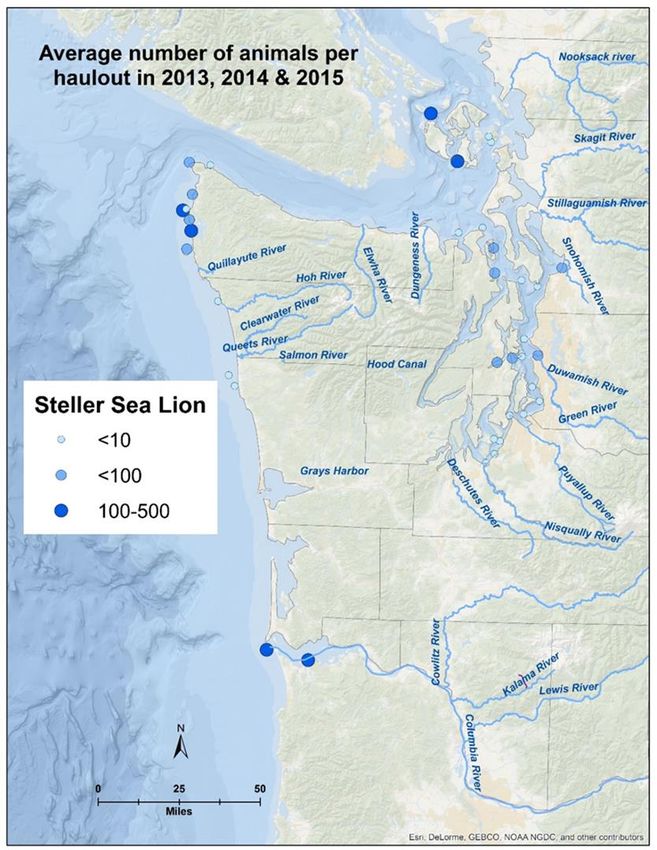
Major Declines in Natural Origin Chinook

                                                   5
        Source: Puget Sound Salmon Recovery Plan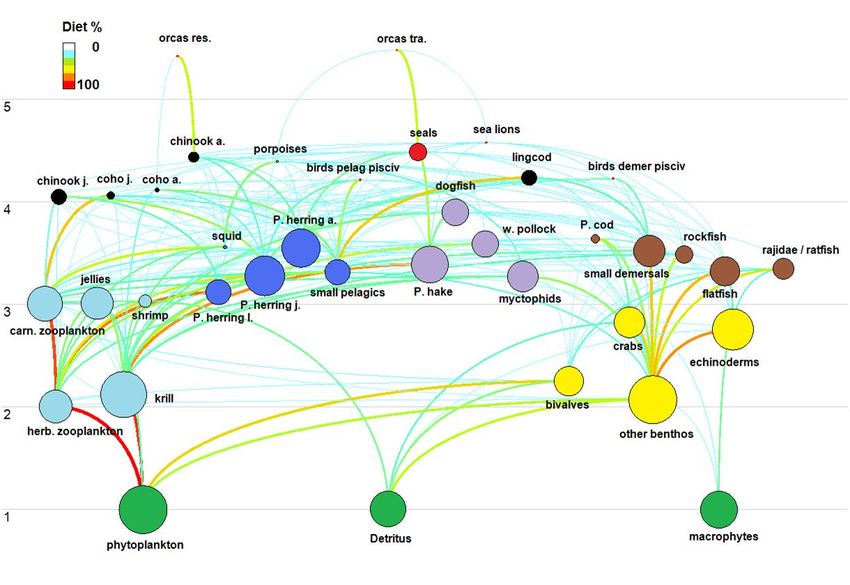
Chinook Important to Orca Diet

                           Source: Center for Whale
                           Research
                                               6
Southern Resident Orca Trends

                                7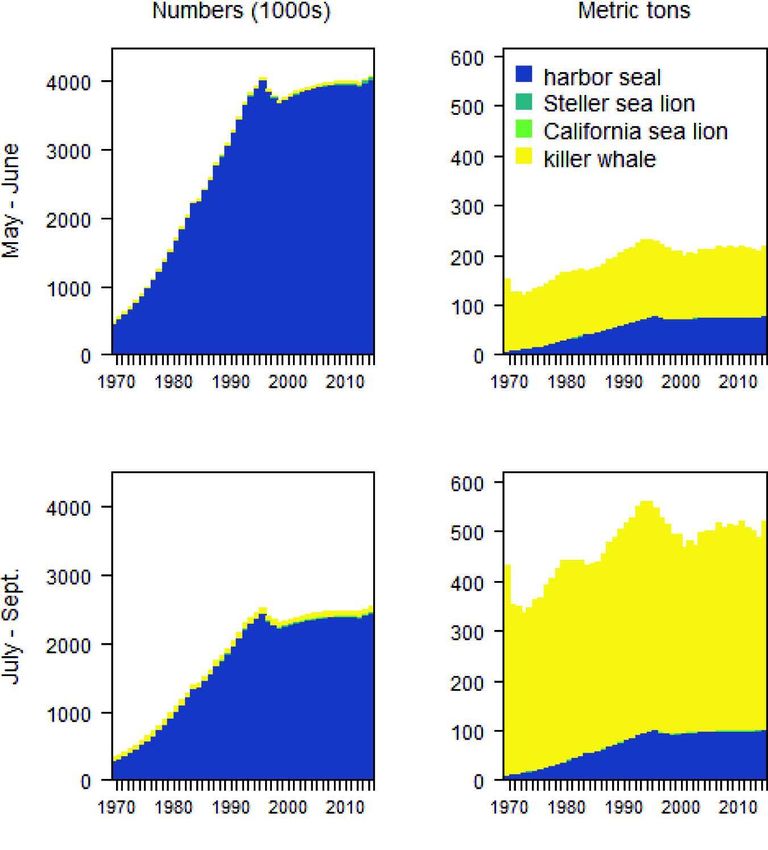
Predation is One of Many Factors
          Affecting Salmon Recovery

• Hydropower
• Hatcheries
• Habitat
• Disease and parasites
• Contaminants
• Predation

                                          8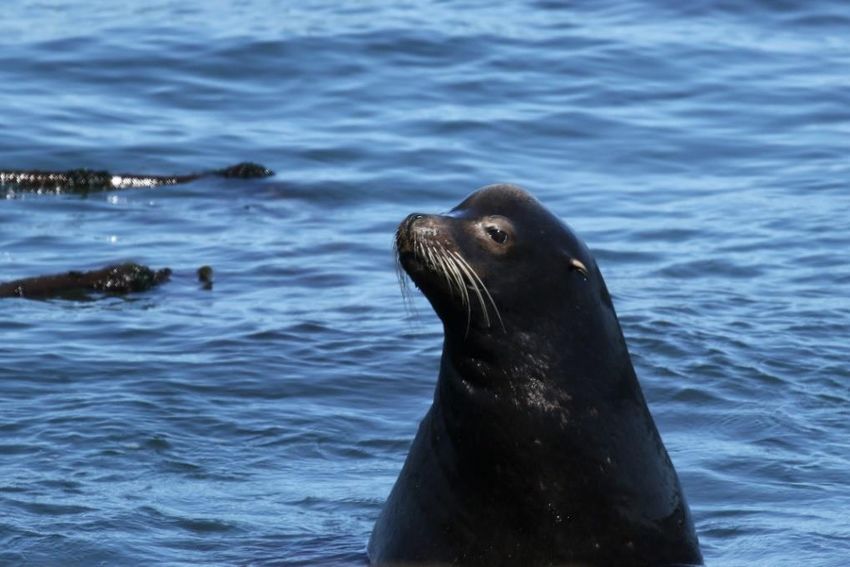
Chasco et al., 2016
  • Puget Sound bioenergetics model
  • Estimated consumption of Chinook salmon
    from 1970-2015
  • Modeled population size, diet, and energetic
    demands for killer whales, California sea
    lions, Steller sea lions, and harbor seals
  • Chinook consumed by pinnipeds increased
    from 68 to 625 metric tons
  • Pinnipeds consumed more than killer whales
    and all fisheries

                                               9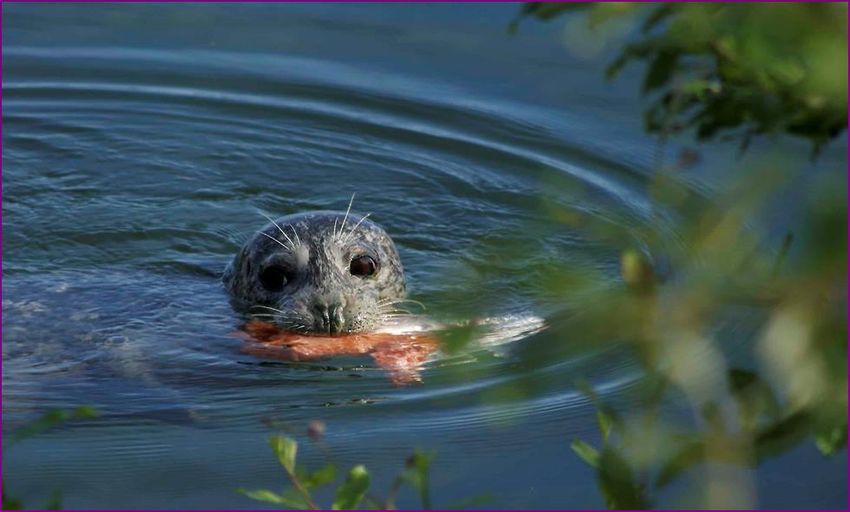
How Does Our Work Differ from Chasco?

             • Use recent seal population estimates
             • New seal diet information from Puget Sound
             • Similar modelling approach but we account for
               sources of uncertainty not included in the
               “Chasco” model
             • Express smolt consumption as fraction of total
               abundance
             • Examine sensitivity to assumptions of marine
               survival after encountering seals

                                                         10
Questions
• What are the primary salmon eating pinnipeds in Washington?
• Where are they located? How many are there? And what are their
population trends?
• What do they eat?
• How many juvenile Chinook do harbor seals consume?
• How many adult Chinook equivalents does this rate of juvenile
consumption represent?
• What level of seal removal is needed to achieve meaningful increases in
adult Chinook return rates?
• What other information do we need?
• What administrative options are there to reduce pinniped predation?
11Focus on Three Species of Pinnipeds
• Harbor Seal
• California Sea Lion
• Steller Sea Lion
12California Sea Lion
• Primarily present in Washington
waters in Sept - April
• A single US stock
1314 Source: Laake et al. 2018
Steller Sea Lion
 • Primarily present in Washington
   waters between Sept. and April
 • Washington’s Stellers belong to the
   eastern distinct population segment
    • which ranges along the west coast
      of North America from Southeast
      Alaska to central California
    • This segment was delisted under
      the ESA

                                          15
Source: Wiles 2014 WDFW Status
Review
16Harbor Seal
• Year-round resident 17,150
(13,964-20,335)
• 1 coastal stock and three
stocks in the inland marine
waters
• Washington/Oregon coast
579
• Northern inland waters (472-687)
• Hood Canal
• South Puget Sound 1,300
15,533 (1,059-1,542)
(12,289-17,896)
Key assumptions: 1) Correction factor from Huber et al. 2001 is
reflective of haulout patterns observed today, and 2) The 2013
seal population estimate is similar to today’s population size 17Conclusions:
Puget Sound Strait of Juan de Fuca 4,000
1,400
1,200
1) Uncertain trend in Hood Canal, 3,500
Harbor Seal Count
Harbor Seal Count
1,000 2) Different dynamics in the Puget Sound, Strait of 3,000
2,500
800
Juan de Fuca and Hood Canal regions 2,000
600
1,500
400
Hood Canal 1,000
200
1,400 500
0
1,200 0
1970 1980 1990 2000 2010 2020
Harbor Seal Count
1970 1980 1990 2000 2010 2020
Year 1,000
Year
800
600
400
200
0
1970 1980 1990 2000 2010 2020
Year 18Questions
• What are the primary salmon eating pinnipeds in Washington?
• Where are they located? How many are there? And what are their
population trends?
• What do they eat?
• How many juvenile Chinook do harbor seals consume?
• How many adult Chinook equivalents does this rate of juvenile
consumption represent?
• What level of seal removal is needed to achieve meaningful increases in
adult Chinook return rates?
• What other information do we need?
• What administrative options are there to reduce pinniped predation?
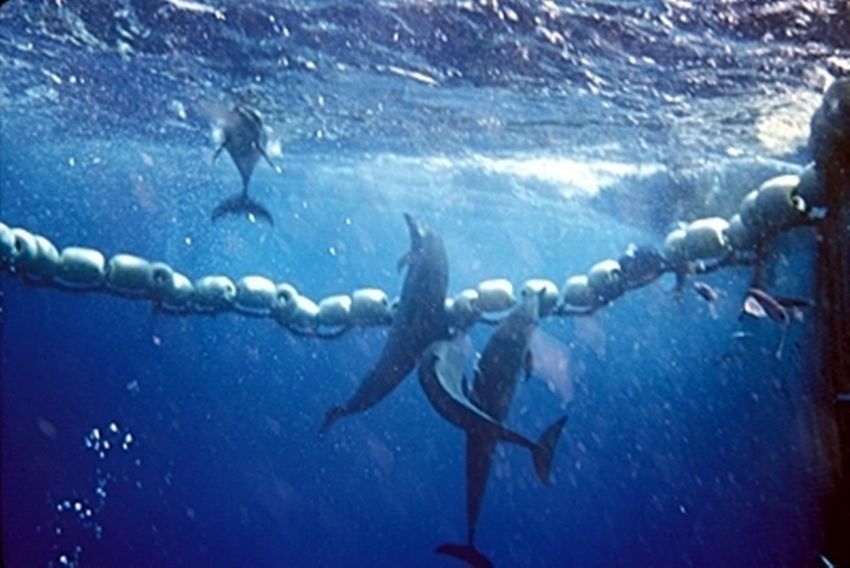
19We Focus on Juvenile Chinook
Consumption by Harbor Seals
Source:
Chasco 2016 CJFAS
20What a Scat Represents
• Prey from previous foraging bouts/meals
• 1 “meal” occurs in 3.8 ± 1.8 scats (range 1–10)
• Passed over 24-48 hours
• Contain digested/degraded hard parts and DNA
21Puget Sound Sampling in 2016
•North Sound: Western
Washington University
•South Sound: WDFW
•1,129 total samples
•Collected Jan-Aug
22Diet Reconstruction
•Allows identification of different species in the feces
•Percent diet by species
•Distinguishes adults vs. juveniles
23
Thomas et al. 2017Results
• 57 different prey species
• 53 species of fish
• 1 unknown crustacean
• 3 species of cephalopods (Pacific red octopus, giant Pacific
octopus, California market squid)
• 5 salmonid species (Chinook, chum, coho, cutthroat trout,
steelhead)
24Winter Diet
Jan
Feb
March
25Spring-Summer Diet
April
May
June
July-Aug
26Key Findings
• Highly diverse diet (57 prey species)
• Highly variable diet in space and time
• Presenting estimates from a single year (2016)
• Considerable uncertainty associated with estimates
• Chinook salmon represent 1-2% of seal diet during
February - August
27For juvenile Chinook, why are we worried
about small diet percentages?
28Why are we worried about small diet percentages?
Seal daily needs (kg) 2.0 Range: 1.9-2.1kg
29Why are we worried about small diet percentages?
Seal daily needs (kg) 2.0 Range: 1.9-2.1kg
Diet proportion juv Chinook 1% 95% CI: 0.2-2.4%
30Why are we worried about small diet percentages?
Seal daily needs (kg) 2.0 Range: 1.9-2.1kg
Diet proportion juv Chinook 1% 95% CI: 0.2-2.4%
Mass of juv Chinook/day/seal (kg) 0.02
31Why are we worried about small diet percentages?
Seal daily needs (kg) 2.0 Range: 1.9-2.1kg
Diet proportion juv Chinook 1% 95% CI: 0.2-2.4%
Mass of juv Chinook/day/seal (kg) 0.02
Mass/juv Chinook (kg) 0.008 95% CI: 0.005-0.011kg
32Why are we worried about small diet percentages?
Seal daily needs (kg) 2.0 Range: 1.9-2.1kg
Diet proportion juv Chinook 1% 95% CI: 0.2-2.4%
Mass of juv Chinook/day/seal (kg) 0.02
Mass/juv Chinook (kg) 0.008 95% CI: 0.005-0.011kg
Avg. # juv Chinook/day/seal 2.5
33Why are we worried about small diet percentages?
Seal daily needs (kg) 2.0 Range: 1.9-2.1kg
Diet proportion juv Chinook 1% 95% CI: 0.2-2.4%
Mass of juv Chinook/day/seal (kg) 0.02
Mass/juv Chinook (kg) 0.008 95% CI: 0.005-0.011kg
Avg. # juv Chinook/day/seal 2.5
# Seals 19,000 95% CI: 15,458-22,542
34Why are we worried about small diet percentages?
Seal daily needs (kg) 2.0 Range: 1.9-2.1kg
Diet proportion juv Chinook 1% 95% CI: 0.2-2.4%
Mass of juv Chinook/day/seal (kg) 0.02
Mass/juv Chinook (kg) 0.008 95% CI: 0.005-0.011kg
Avg. # juv Chinook/day/seal 2.5
# Seals 19,000 95% CI: 15,458-22,542
Juv Chinook eaten per day 47,500
35Why are we worried about small diet percentages?
Seal daily needs (kg) 2.0 Range: 1.9-2.1kg
Diet proportion juv Chinook 1% 95% CI: 0.2-2.4%
Mass of juv Chinook/day/seal (kg) 0.02
Mass/juv Chinook (kg) 0.008 95% CI: 0.005-0.011kg
Avg. # juv Chinook/day/seal 2.5
# Seals 19,000 95% CI: 15,458-22,542
Juv Chinook eaten per day 47,500
Juvenile Chinook eaten per month 1,425,000 95% CI: 518,000-2,418,000
36Seals consumed between 5.2 and 26.8
million juvenile Chinook in 2016
(median = 12.2 million)
We don’t know if 2016 is representative
of harbor seal annual diet
Estimated total Chinook smolts consumed by Harbor Seals
in 2016 (millions) 37Questions
• What are the primary salmon eating pinnipeds in Washington?
• Where are they located? How many are there? And what are their
population trends?
• What do they eat?
• How many juvenile Chinook do harbor seals consume?
• How many adult Chinook equivalents does this rate of juvenile
consumption represent?
• What level of seal removal is needed to achieve meaningful increases in
adult Chinook return rates?
• What other information do we need?
• What administrative options are there to reduce pinniped predation?
38Impacts to Salmon Populations
Returning
adults
Ocean Marine
adults environment
Smolts
Fry Freshwater &
estuarine habitat
Eggs
Spawners
39Smolt Consumption
Estimated number consumed
Percent smolts consumed =
Total hatchery smolts + Total natural smolts
Regional Mark Information Rotary screw trap data
System release database 40Smolt Consumption
12.2 million (5.2 – 26.8 million)
Percent smolts consumed =
41.6 million hatchery + 4.5 million natural
Regional Mark Information Rotary screw trap data
System release database 41Smolt Consumption
12.2 million (5.2 – 26.8 million)
Percent smolts consumed =
41.6 million hatchery + 4.5 million natural
Percent of distribution
Estimated percent smolts consumed by seals 42Comparison to Survival
returning adults
smolt to adult return (SAR) =
total smolts
Naturally produced Hatchery
Watershed Ocean entry years Stock Ocean entry years Stock Ocean entry years
Skagit 1994 – 2011 Nooksack springs 2001 – 2011 Gorst fall 2002 – 04; 09 – 11
Cedar 2003 – 2011 Samish fall 2001 – 2011 Nisqually fall 2001 – 2011
Bear 2003 – 2011 Skagit spring 2001 – 2011 Minter fall 2003 – 2005
Green 2003 – 2012 Skykomish summer 2001 – 2011 Tumwater fall 2001 – 2005
Nisqually 2009 – 2010 Issaquah fall 2003 – 2007 Hoodsport fall 2003 – 2011
Dungeness 2005 – 2012 Green fall 2001 – 2011 Skokomish fall 2001 – 2011
Data Source: WDFW smolt monitoring Puyallup fall 2003 – 2008; 2010
Data Source: Gary Marston (WDFW), from RMIS CWT database 43Comparison to Survival
Estimated seal consumption
Naturally produced survivors (SAR)
N = 58 estimates
Hatchery survivors (SAR)
N = 111 estimates
Percent of smolts 44Salmon Marine Survival Schedule
smolts
Number of salmon
adults
Time
45Salmon Marine Survival Schedule
smolts
Number of salmon
adults
Time
46Compensatory Mortality
smolts
seal consumption
Number of salmon
adults
Time
47Compensatory Mortality
smolts
Current scenario
Number of salmon Less seal consumption
no compensatory mortality
Less seal consumption
100% compensatory mortality
adults
Time
48Adult Equivalents
Goal
Express estimated consumption of smolts by seals in terms of adults
Key assumptions
1. Age specific marine survival and maturity schedules of salmon
after seal consumption
2. Seals consume salmon smolts first, before any other predators
or other sources of salmon mortality
3. Levels of compensatory mortality following seal predation
49Adult Equivalents
Assumed marine survival after seal consumption
Total adult return predicted from 46.1 M smolts Lower Higher
Adult abundance 232,000 464,000
Smolt to adult return rate (SAR) 0.5 % 1.0 %
50Adult Equivalents
Assumed marine survival after seal consumption
Total adult return predicted from 46.1 M smolts Lower Higher
Adult abundance 232,000 464,000
Smolt to adult return rate (SAR) 0.5 % 1.0 %
Adult equivalents of smolts consumed by seals
No compensatory mortality 84,000 (36,000 – 183,000) 167,000 (71,000 – 367,000)
51Adult Equivalents
Assumed marine survival after seal consumption
Total adult return predicted from 46.1 M smolts Lower Higher
Adult abundance 232,000 464,000
Smolt to adult return rate (SAR) 0.5 % 1.0 %
Adult equivalents of smolts consumed by seals
No compensatory mortality 84,000 (36,000 – 183,000) 167,000 (71,000 – 367,000)
50% compensatory mortality 42,000 (18,000 – 92,000) 84,000 (36,000 – 183,000)
52Adult Equivalents
Assumed marine survival after seal consumption
Total adult return predicted from 46.1 M smolts Lower Higher
Adult abundance 232,000 464,000
Smolt to adult return rate (SAR) 0.5 % 1.0 %
Adult equivalents of smolts consumed by seals
No compensatory mortality 84,000 (36,000 – 183,000) 167,000 (71,000 – 367,000)
50% compensatory mortality 42,000 (18,000 – 92,000) 84,000 (36,000 – 183,000)
100% compensatory mortality 0 0
53Questions
• What are the primary salmon eating pinnipeds in Washington?
• Where are they located? How many are there? And what are their
population trends?
• What do they eat?
• How many juvenile Chinook do harbor seals consume?
• How many adult Chinook equivalents does this rate of juvenile
consumption represent?
• What level of seal removal is needed to achieve meaningful increases in
adult Chinook return rates?
• What other information do we need?
• What administrative options are there to reduce pinniped predation?
54Reduction in total juvenile Chinook
consumption by seals
10% 25% 50%
Target seal
abundance 17,130 14,300 9,500
Initial removal 1,870 4,700 9,500
Annual removals 255 530 71055Questions
• What are the primary salmon eating pinnipeds in Washington?
• Where are they located? How many are there? And what are their
population trends?
• What do they eat?
• How many juvenile Chinook do harbor seals consume?
• How many adult Chinook equivalents does this rate of juvenile
consumption represent?
• What level of seal removal is needed to achieve meaningful increases in
adult Chinook return rates?
• What other information do we need?
• What administrative options are there to reduce pinniped predation?
56Information Needs
Pinniped predation
• Better understanding of the window of time when juveniles are
consumed
• Better understanding of where seals forage on juvenile salmon
• Additional years of Harbor Seal population estimates to increase
confidence in carrying capacity
• Additional years of seal diet from other locations to understand temporal
and spatial variability in Seal diet
• Estimates of adult fish consumption
• Better diet information for California and Steller sea lions
57Information Needs
Salmon Survival
• Better understanding of smolt migratory survival, especially for hatchery-origin out-
migrants
• Better understanding of the body size of salmon consumed, particularly predation on
larger resident Chinook (i.e., “Blackmouth”)
• Better understanding of the window of time when juveniles are consumed
Ecosystem and marine food web
• Impact of transient killer whales on harbor seals (and vice versa)
• Other sources of marine mortality on juvenile salmon
o Other salmon predators – timing and magnitude of consumption
o Linkage between seals and other salmon predators
58Questions
• What are the primary salmon eating pinnipeds in Washington?
• Where are they located? How many are there? And what are their
population trends?
• What do they eat?
• How many juvenile Chinook do harbor seals consume?
• How many adult Chinook equivalents does this rate of juvenile
consumption represent?
• What level of seal removal is needed to achieve meaningful increases in
adult Chinook return rates?
• What other information do we need?
• What administrative options are there to reduce pinniped predation?
59Marine Mammal Protection Act (MMPA)
60Goals of the MMPA
• To maintain species/stocks at their Optimum
Sustainable Population (OSP) and be a significant
functional element in the ecosystem.
• To restore depleted stocks to OSP.
• To reduce bycatch and serious injury of marine
mammals incidental to commercial fisheries to
insignificant levels approaching a zero mortality
rate.
61MMPA Section 101 Take Moratorium
“There shall be a moratorium on the *taking* and
importation of marine mammals and marine
mammal products…”
*Take* is defined as “harass, hunt, capture or kill,
or attempt to harass, hunt, capture or kill any
marine mammal.”
Similar to language in the ESA.
62Management Options in the MMPA
• Apply for Waiver and Request Direct Take
• Request waiver of the Take Moratorium [Section 101(a)(3)]
• Rule-Making [Section 103]
• Take Permit [Section 104]
• Request Return of Management Authority to State
• Section 109
• Pinniped Removal Authority
• Section 120
• Intentional lethal taking of individually identifiable
pinnipeds which are having a significant negative impact on
the decline/recovery of salmonids
63Waiver of Take Moratorium and Direct Take Permit MMPA Sections: • Section 101(a)(3)(A)—Waiver on the Requirements to allow Take • Section 103—Regulations on Taking of Marine Mammals • Section 104—Permit authorizing Take Considerations: • Rarely pursued (
Federal Transfer of MMPA Management
Authority to State (Section 109)
Considerations:
• No successful transfer to date.
• Transfers management authority to state; Secretary enters co-op agreement with
  state.
• State develops program consistent with MMPA
    • May require RCWs
    • Will require WACs
    • Need to establish marine mammal program to implement regulatory activities
      consistent wth MMPA
    • More financial investment by the state
• Transfer authority for stocks at OSP.
• Consult with Marine Mammal Commission and Pacific Fisheries Management Council
• No NEPA; SEPA would apply; no process timelines in MMPA
                                                                          65
Pinniped Removal Authority (MMPA Section 120)
Considerations:
• Allows intentional lethal taking of pinnipeds which are having a
significant negative impact on the recovery of salmonid fishery
stocks which are:
o Listed under ESA
o Approaching ESA status
o Migrate through Ballard Locks, WA
• Permit for specific numbers, location, timing
• Pinniped stocks are not depleted or listed as strategic stock(s)
• Pinniped Fishery Interaction Task Force
• NEPA
• Individually identifiable animals
66Other Considerations
• Highly contentious proposal
• Extensive, untested, complicated process
o Rarely pursued
o Exposure to legal challenges
o Uncertain outcome of obtaining approvals
• NMFS unlikely has existing resources to process application
• Data uncertainty; complicated ecological system and food web
o Not as “prescriptive” as what might be perceived by
bioenergetics models summarized in this presentation.
67MMPA’s Potential Biological Removal
• The maximum number of animals, not including natural
mortalities, that may be removed from a marine mammal
stock while allowing that stock to reach or maintain its
optimum sustainable population.
• Function of:
o Minimum population estimate
o One-half the maximum theoretical or estimated net
productivity rate of the stock at a small population size.
o A recovery factor between 0.1 and 1.0
68NOAA Fisheries Stock Assessment Reports
Species/Stock Population Potential Biological
Estimate Removal (PBR)
Harbor Seal – WA/OR 16,165 N/A
Coast (2014)
Harbor Seal- Northern 11,036 N/A
Inland Waters (2014)
Harbor Seals - 1,568 N/A
Southern Puget Sound
(2014)
Harbor Seals – Hood 1,088 N/A
Canal (2014) 69Potential Increase in the Number of Adult Chinook
if Harbor Seals were Removed at PBR Level
0% 25% 50%
Region PBR comp. mort comp. mort. comp. mort.
N. Inland 1,162 5,500 (2,200-12,500) 4,100 (1,600-9,300) 2,800 (1,100-6,200)
S. Sound 88 400 (150-950) 300 (120-710) 210 (80-470)
Hood Canal1 39 190 (70-420) 140 (60-310) 90 (40-210)
Inland Total 1,290 6,100 (2,400-13,800) 4,600 (1,800-10,400) 3,100 (1,200-6,900)
Coast2 1,100 5,000 (2,000-11,300) 3,700 (1,500-8,500) 2,500 (1,000-5,600)
1The issue of which correction factor to use for Hood Canal needs to be resolved; this is a
tentative estimate using Huber’s correction factor.
2For this exercise, the Washington coast was considered as its own stock. Ultimately, we will
70
need harbor seal estimates from Oregon to calculate PBR for this stock.SRKW Task Force Recommendation 12:
Puget Sound/Outer Coast Pinnipeds
• Pilot project for removal/alteration of artificial haul out near
locations with significant outmigration and predation of
Chinook smolts.
• Complete ongoing research and coordinate an independent
science panel to review/evaluate extent of pinniped predation.
• Engage NOAA to determine OSP for harbor seals.
• Convenve co-management panel to coordinate with science
panel and assess appropriate management actions.
• Provide funding for these recommendations.
712018 Public Comments Sent To Governor Inslee’s
Orca Task Force Around Pinniped Predation
During two public comment periods, 1,146 total comments on predation were tallied from 839 individuals
THEMES % OF TOTAL
Support lethal removal of pinnipeds 25.6%
Do not support lethal removal of pinnipeds 25.1%
Predation of salmon by pinnipeds is not the primary issue for orcas 17.4%
Concern with interfering with ecological balance or doing single species management 9.5%
Support haul out removal and/or increasing forage fish to aid predation issues 6.9%
Not enough information available to support management of pinnipeds 6.2%
Predation issues need to be fixed while hatchery production is ramped up 2.3%
Concern around transient orca needs 6.1%
Support protection of pinnipeds 0.9%
72Summary and Next Steps • Important to consider the biological, administrative, logistical, and social aspects of this high-profile issue. • Complex food web—we’ve modeled one aspect. • While generalists, harbor seals collectively consume a significant number of Chinook smolts. • Ability to reduce pinniped predation impacts on returning adult Chinook is uncertain. • MMPA administrative options are complex and limited. • Worth pursuing further scientific collaboration and explore mitigating pinniped predation near estuaries of concern. • Need to consider other pinniped impacts on adult Chinook and need to pilot artificial haul-out dissuasion. 73
Questions

            74
You can also read