Improved ozone monitoring by ground-based FTIR spectrometry
←
→
Page content transcription
If your browser does not render page correctly, please read the page content below
Atmos. Meas. Tech., 15, 2557–2577, 2022
https://doi.org/10.5194/amt-15-2557-2022
© Author(s) 2022. This work is distributed under
the Creative Commons Attribution 4.0 License.

Improved ozone monitoring by ground-based FTIR spectrometry
Omaira Elena García1 , Esther Sanromá1,a , Matthias Schneider2 , Frank Hase2 , Sergio Fabián León-Luis1,b ,
Thomas Blumenstock2 , Eliezer Sepúlveda1 , Alberto Redondas1 , Virgilio Carreño1 , Carlos Torres1 , and Natalia Prats1
1 IzañaAtmospheric Research Centre (IARC), State Meteorological Agency of Spain (AEMet), Santa Cruz de Tenerife, Spain
2 Instituteof Meteorology and Climate Research (IMK-ASF), Karlsruhe Institute of Technology (KIT), Karlsruhe, Germany
a now at: Employment Observatory of the Canary Islands (OBECAN), Santa Cruz de Tenerife, Spain
b now at: TRAGSATEC, Madrid, Spain

Correspondence: Omaira Elena García (ogarciar@aemet.es)

Received: 5 March 2021 – Discussion started: 3 May 2021
Revised: 1 April 2022 – Accepted: 4 April 2022 – Published: 28 April 2022

Abstract. Accurate observations of atmospheric ozone (O3 )       trieval and instrumental performance (given by the instru-
are essential to monitor in detail its key role in atmospheric   mental line shape function and measurement noise), which
chemistry. The present paper examines the performance of         leads to a worsening of the precision of FTIR O3 TCs of up to
different O3 retrieval strategies from FTIR (Fourier trans-      2 %. This cross-interference becomes especially noticeable
form infrared) spectrometry by using the 20-year time se-        beyond the upper troposphere/lower stratosphere, as docu-
ries of the high-resolution solar spectra acquired from 1999     mented theoretically as well as experimentally by compar-
to 2018 at the subtropical Izaña Observatory (IZO, Spain)        ing FTIR O3 profiles to those measured using electrochemi-
within NDACC (Network for the Detection of Atmospheric           cal concentration cell (ECC) sondes within NDACC. Conse-
Composition Change). In particular, the effects of two of the    quently, it should be taken into account for the reliable mon-
most influential factors have been investigated: the inclusion   itoring of the O3 vertical distribution, especially over long-
of a simultaneous atmospheric temperature profile fit and        term timescales.
the spectral O3 absorption lines used for the retrievals (the
broad spectral region of 1000–1005 cm−1 and single micro-
windows between 991 and 1014 cm−1 ). Additionally, the wa-       1   Introduction
ter vapour (H2 O) interference in O3 retrievals has been eval-
uated, with the aim of providing an improved O3 strategy that    Monitoring atmospheric composition is crucial for under-
minimises its impact and, therefore, could be applied at any     standing the present climate and foreseeing possible future
NDACC FTIR station under different humidity conditions.          changes, and is, therefore, the basis for the design and imple-
The theoretical and experimental quality assessments of the      mentation of efficient climate-change mitigation and adap-
different FTIR O3 products (total column (TC) amounts and        tation policies. Among the atmospheric gases with impor-
volume mixing ratio (VMR) profiles) provide consistent re-       tant climate effects, ozone (O3 ) plays a vital role in atmo-
sults. Combining a simultaneous temperature retrieval with       spheric chemistry. In the stratosphere, it absorbs a large part
the optimal selection of single O3 micro-windows results in      of the biologically damaging ultraviolet sunlight, allowing
superior FTIR O3 products, with a precision of better than       only a small amount to reach the earth’s surface. Likewise,
0.6 %–0.7 % for O3 TCs as compared to coincident NDACC           absorption of the ultraviolet radiation heats, stratifies, and
Brewer observations taken as a reference. However, this im-      determines the vertical stability of the middle atmosphere. In
provement can only be achieved provided the FTIR spec-           the troposphere, O3 absorbs infrared radiation, acting as an
trometer is properly characterised and stable over time. For     important greenhouse gas; it affects the oxidising capacity
unstable instruments, the temperature fit is found to exhibit    of the atmosphere; and it is a phytotoxicant that is harmful
a strong negative influence on O3 retrievals due to the in-      to public health (Cuevas et al., 2013; WMO, 2014a, 2018;
crease in the cross-interference between the temperature re-     Gaudel et al., 2018, and references therein).

Published by Copernicus Publications on behalf of the European Geosciences Union.
2558                                  O. E. García et al.: Improved ozone monitoring by ground-based FTIR spectrometry

    Stratospheric O3 abundances have shown a significant            the spectral region used for O3 retrievals and the simulta-
decrease in global levels from the 1980s to the 1990s,              neous fitting of the atmospheric temperature profile. To our
mainly attributable to the increase in anthropogenic emis-          knowledge, so far, such analysis has been approached sep-
sions of ozone-depleting substances (ODSs) during that pe-          arately in most of the studies present in the literature, or
riod (WMO, 2014a, 2018). The implementation of the 1987             has not been addressed in detail yet. Previous studies have
Montreal Protocol and its amendments and adjustments has            shown, for example, that optimised selection of the O3 ab-
stopped global O3 decay by controlling ODS emissions: O3            sorption lines or the inclusion of an additional temperature
concentrations have approximately stabilised since strato-          fitting significantly improves the precision of FTIR O3 TCs
spheric ODS abundances reached their maximum at the end             and VMR profiles (e.g. Schneider and Hase, 2008; Schneider
of the 1990s. As a result, the global O3 content is ex-             et al., 2008b; García et al., 2012, 2014). Nonetheless, possi-
pected to slowly increase and return to pre-1980 levels during      ble combined effects were not analysed by those works.
the 21st century (e.g. Weatherhead et al., 2000; Austin and             The analysis was performed at the O3 super-site of Izaña
Butchart, 2003; Eyring et al., 2010; WMO, 2014a, 2018).             Observatory (IZO), where ground-based FTIR observations
However, O3 concentrations are affected not only by the             have been carried out coincidentally with other high-quality
presence of ODSs, but also by a wide variety of factors             O3 measurement techniques since 1999. By using those data,
(increases in greenhouse gas concentrations, changes in the         a comprehensive assessment of the precision and long-term
Brewer–Dobson circulation and stratospheric temperatures,           consistency of new O3 retrieval strategies from ground-based
etc.), making it very challenging to predict how, when, and         FTIR spectrometry can be carried out. To this end, the cur-
where the O3 recovery will take place. In the troposphere,          rent paper is structured as follows. Section 2 describes the
since O3 is highly variable (depending on time period, re-          Izaña Observatory, FTIR measurements, and ancillary data
gion, and proximity to fresh O3 precursor emissions), there is      considered to assess the quality of the new FTIR O3 products
no consistent picture of O3 tropospheric changes around the         (Brewer TC observations and electrochemical concentration
world (Steinbrecht et al., 2017; Gaudel et al., 2018; WMO,          cell (ECC) vertical sondes). Section 3 presents the different
2018). Hence, high-quality and long-term O3 measurements            FTIR O3 retrieval strategies and their theoretical character-
are essential for further improving our understanding of the        isation in terms of vertical sensitivity and expected uncer-
O3 response to natural and anthropogenic forcings, as well          tainty. Section 4 examines the quality and long-term reliabil-
as to estimate consistent trends at a global scale (Vigouroux       ity of the different FTIR O3 TCs and VMR profiles by com-
et al., 2015; Gaudel et al., 2018; GCOS, 2021).                     paring them to the independent O3 datasets. Finally, Sect. 5
    Within NDACC (Network for the Detection of Atmo-                summarises the main results and conclusions drawn from this
spheric Composition Change, http://www.ndaccdemo.org,               work.
last access: 31 March 2022), high-resolution solar absorption
infrared spectra have been continuously recorded since the
1990s by ground-based FTIR (Fourier transform infrared)             2   Izaña Observatory and its ozone programme
spectrometers distributed at a global scale. By analysing the
measured spectra, these instruments are currently capable of        Izaña Observatory is a high-mountain station located on the
providing both high-quality O3 total column (TC) amounts            island of Tenerife (Spain) in the subtropical North Atlantic
and low-resolution O3 vertical volume mixing ratio (VMR)            Ocean (28.3◦ N, 16.5◦ W) at an altitude of 2370 m a.s.l. The
profiles at about 20 sites (e.g. Barret et al., 2002; Schnei-       observatory is managed by the Izaña Atmospheric Research
der and Hase, 2008; Schneider et al., 2008a, b; Vigouroux           Centre (IARC, https://izana.aemet.es, last access: 31 March
et al., 2008; Viatte et al., 2011; García et al., 2012, 2014;       2022), which belongs to the State Meteorological Agency of
Vigouroux et al., 2015, and references therein). In recent          Spain (AEMet, https://www.aemet.es, last access: 31 March
years, the NDACC Infrared Working Group (IRWG, http:                2022). IZO is located below the descending branch of the
//www2.acom.ucar.edu/irwg, last access: 31 March 2022)              northern subtropical Hadley cell, under a quasi-permanent
has made considerable efforts to standardise the data acquisi-      subsidence regime, and typically above a stable trade wind
tion protocols and inversion strategies used to derive O3 con-      inversion layer that acts as a natural barrier for local and re-
centrations at the different NDACC stations and, hence, pro-        gional pollution. This strategic location ensures clean air and
duce uniform and consistent O3 datasets (Hase et al., 2004;         clear-sky conditions during most of the year, making IZO an
IRWG, 2014; Vigouroux et al., 2015). Nonetheless, scien-            excellent station for in situ and remote-sensing observations
tific discussions seeking improvements in O3 monitoring and         (Cuevas et al., 2020, and references therein).
network-wide consistency are ongoing.                                  For many years, IZO has run a comprehensive O3 mon-
    In this context, the present paper examines the effect of us-   itoring programme by using different measurement tech-
ing different retrieval approaches on the quality of the FTIR       niques: FTIR, Brewer, and DOAS (differential optical ab-
O3 products, with the aim of providing an improved O3 strat-        sorption spectroscopy) spectrometers, as well as ECC O3
egy that could be applied at any NDACC FTIR station. The            sondes and in situ ultraviolet photometric analysers. The first
influences of two of the most important settings are assessed:      four techniques routinely contribute to NDACC, with the aim

Atmos. Meas. Tech., 15, 2557–2577, 2022                                              https://doi.org/10.5194/amt-15-2557-2022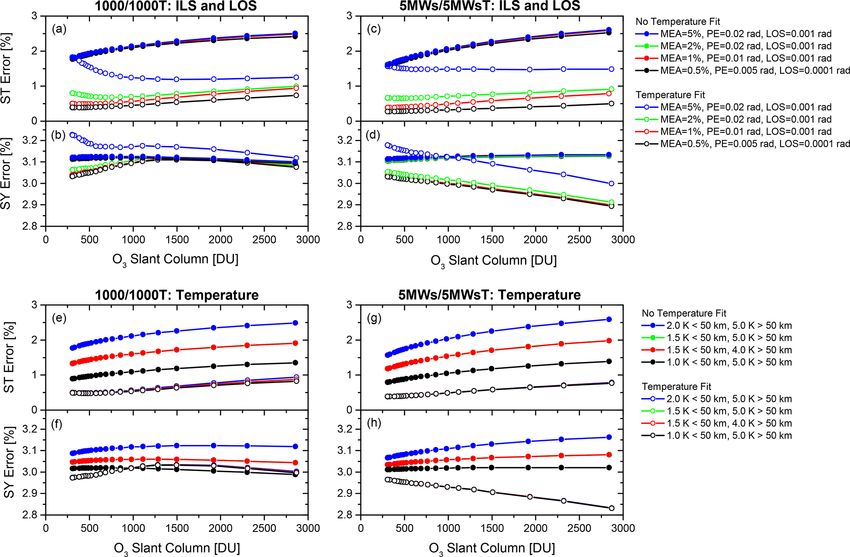
O. E. García et al.: Improved ozone monitoring by ground-based FTIR spectrometry                                             2559

being to monitoring changes in the troposphere and strato-        (2012). This ILS treatment ensures the independence of the
sphere with an emphasis on the long-term evolution of the         FTIR trace gas retrievals and instrumental characterisation,
O3 layer, while the in situ O3 records are taken in the frame-    but it also allows the instrumental alignment and its tempo-
work of the WMO/GAW (World Meteorological Organiza-               ral stability to be verified. Figure 1 depicts the time series of
tion/Global Atmospheric Watch) programme. Please refer to         the ILS’s modulation efficiency amplitude (MEA) and phase
Cuevas et al. (2020) for more details about IZO and its atmo-     error (PE) parameters between 1999 and 2018, as used for
spheric monitoring programmes.                                    O3 retrievals. Three periods with different features affecting
                                                                  the IZO FTIR measurements can be distinguished: (1) dur-
2.1   FTIR measurements                                           ing 1999–2004, although N2 O-cell measurements were rou-
                                                                  tinely carried out, the ILS estimation is imprecise due to the
The IZO FTIR programme has been gathering high-                   instability of the IFS 120M spectrometer; (2) during 2005–
resolution solar spectra within NDACC since 1999, when a          May 2008, the IFS 120/5HR instrument exhibits a gradual
Bruker IFS 120M spectrometer was installed due to a collab-       temporal drift, but the ILS function is properly assessed; and
orative agreement between the IMK-ASF (Institute of Me-           (3) during June 2008–2018, the IFS 120/5HR instrument is
teorology and Climate Research–Atmospheric Trace Gases            optically well-aligned (the ILS is nearly nominal). There-
and Remote Sensing of Karlsruhe Institute of Technology,          fore, these three periods will be independently analysed in
KIT, https://www.kit.edu, last access: 31 March 2022) and         the present work in order to examine the influence of instru-
AEMet-IARC. In 2005, this instrument was replaced with an         ment status on FTIR O3 products.
upgraded model, the Bruker IFS 120/5HR, which is one of
the best-performing FTIR spectrometers commercially avail-        2.2   Ancillary data: Brewer and ECC sondes
able. For the present study, the measurements taken from
1999 to 2018, encompassing the operation of the two FTIR          At IZO, Brewer spectrometers, managed by AEMet, have
instruments, have been used.                                      been continuously operating since 1991. In 2001, these ac-
   Among the activities of NDACC, the IZO FTIR spectrom-          tivities were accepted by NDACC and, 2 years later, the
eter records direct solar absorption spectra in the middle-       RBCC-E (Regional Brewer Calibration Centre for Europe,
infrared spectral region, i.e. 740–4250 cm−1 (correspond-         http://www.rbcc-e.org, last access: 31 March 2022) of the
ing to 13.5–2.4 µm), by using a set of different field stops,     WMO/GAW programme was established at IZO. By record-
narrow-bandpass filters, and detectors. Nevertheless, for O3      ing direct solar absorption spectra in the ultraviolet spectral
retrievals, only the 960–1015 cm−1 spectral region is con-        region, IZO RBCC-E reference instruments can provide O3
sidered, which is measured with NDACC filter 6 using a            TCs with a total uncertainty (standard uncertainty, k = 1) of
potassium bromide (KBr) beam splitter and a cooled mercury        1.2 %–1.5 % (Gröbner et al., 2017). The high quality and
cadmium telluride (MCT) detector. The solar spectra were          long-term stability of IZO Brewer observations make them
taken at a high spectral resolution of 0.0036 cm−1 (250 cm        a useful reference for validating ground- and satellite-based
maximum optical path difference, OPD, OPDmax ) until April        instruments (León-Luis et al., 2018).
2000, and at 0.005 cm−1 (OPDmax = 180 cm) subsequently.              The O3 sonde programme on Tenerife, also run by AEMet,
The IFS 120M’s field-of-view (FOV) angle was varied be-           started in November 1992, and has operated since March
tween 0.17 and 0.29◦ depending on the measurement period,         2001 within the framework of NDACC. The O3 sounding
while it was always limited to 0.2◦ for the IFS 120/5HR. In       is based on the ECC, which senses O3 as it reacts with a
order to increase the signal-to-noise ratio, eight single scans   dilute solution of potassium iodide (KI) to produce an elec-
are co-added and thereby the acquisition of one spectrum          trical current proportional to the atmospheric O3 concentra-
takes about 10 min.                                               tions (Komhyr, 1986). ECC sondes (Scientific Pumps 5A and
   NDACC FTIR solar spectra are only recorded when the            6A) were launched once weekly from Santa Cruz de Tener-
line of sight (LOS) between the instrument and the sun is         ife station (30 km north-east of IZO, 36 m a.s.l.) until 2010
cloud free. Given the IZO’s location, cloud-free conditions       and, since then, from the Botanic Observatory (13 km north
are very common, and thus FTIR measurements are typically         of IZO, 114 m a.s.l.). The expected total uncertainty of the
taken about two or three times a week. For the 1999–2018 pe-      ECC sondes is ±5 %–15 % in the troposphere and ±5 % in
riod, the total number of NDACC measurement days for O3           the stratosphere (WMO, 2014b), which is a composite of dif-
retrievals amounts to 1975, with an annual average of ∼ 100       ferent instrumental error contributions (i.e. sensor and back-
measurement days a year. For further details about the FTIR       ground current, conversion efficiency, etc.).
measurements at IZO, refer to García et al. (2021).                  Note that for the purposes of the present work, both the
   In order to characterise the instrumental performance of       Brewer and the ECC sonde databases fully cover the entire
the IZO FTIR spectrometers, the instrumental line shape           FTIR 1999–2018 period.
(ILS) function has been routinely monitored about every
2 months since 1999 using low-pressure N2 O-cell measure-
ments and LINEFIT software (v14.5), as detailed in Hase

https://doi.org/10.5194/amt-15-2557-2022                                            Atmos. Meas. Tech., 15, 2557–2577, 2022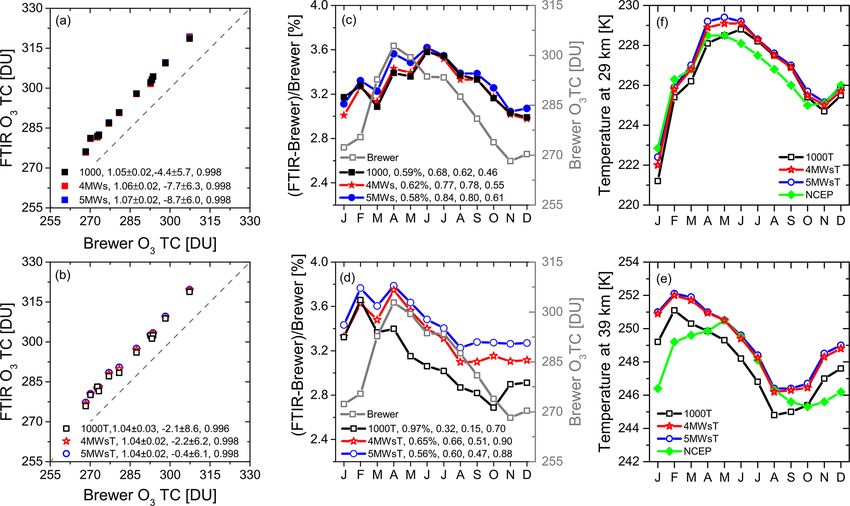
2560                                   O. E. García et al.: Improved ozone monitoring by ground-based FTIR spectrometry

Figure 1. Time series of the normalised modulation efficiency amplitude (MEA) and phase error (PE, rad) at four optical path differences
(33, 85, 133, and 180 cm) for the NDACC O3 measurement settings (filter 6 and MCT detector) of the IZO FTIR spectrometers between
1999 and 2018. Data points represent individual N2 O-cell measurements and solid lines depict smoothed MEA and PE curves. Solid grey
arrows indicate punctual interventions for the instruments: different changes of field stops between 1999 and 2004, the switch from the IFS
120M to the IFS 120/5HR system in 2005, optic re-alignments in June 2008 and February 2013, and internal laser replacements in August
2016 and June 2017.

3     FTIR ozone observations                                              With the exception of the spectral region and temperature
                                                                        treatment, the retrieval strategy is identical for the six ap-
3.1    Ozone retrieval strategies                                       proaches. The O3 VMR profiles are derived from the mea-
                                                                        sured solar absorption spectra by means of the PROFFIT
To analyse the influence of the spectral region and the si-             code (PROFile FIT, Hase et al., 2004), using an ad hoc
multaneous temperature fit on the quality of FTIR O3 prod-              Tikhonov–Phillips slope constraint (TP1 constraint) on a log-
ucts, six different approaches have been defined. They com-             arithmic scale. Since O3 concentrations are very variable
bine three spectral regions and the possibility of perform-             around the tropopause, logarithmic inversion has proved to
ing a simultaneous temperature retrieval (referred to as re-            be superior to the linear approach (e.g. Schneider and Hase,
trieval setups 1000, 4MWs, 5MWs, 1000T, 4MWsT, and                      2008; Schneider et al., 2008a, b). Then, the O3 TCs are com-
5MWsT hereafter; Fig. 2). Setup 1000 uses a broad spectral              puted by integrating the retrieved VMR profiles from the
window covering 1000–1005 cm−1 , which is the one recom-                FTIR altitude up to the top of the atmosphere. The remaining
mended by the NDACC IRWG (IRWG, 2014). This spectral                    settings are based on the NDACC IRWG recommendations
region has been traditionally used by the FTIR community                (IRWG, 2014):
when reporting high-quality O3 products (e.g. Barret et al.,
2002; Schneider et al., 2008a; Vigouroux et al., 2008; Lin-                – The interfering species considered are H2 O, CO2 ,
denmaier et al., 2010; García et al., 2012; Vigouroux et al.,                C2 H4 , and the main O3 isotopologues (666, 686, 668,
2015). Setup 5MWs uses five single micro-windows between                     667, and 676 in HITRAN notation). Spectroscopic line
991 and 1014 cm−1 , which is a simplification of the ap-                     parameters of these absorbers are taken from HITRAN
proach suggested by Schneider and Hase (2008). Schneider                     2008 (Rothman et al., 2009), with a 2009 update for
et al. (2008a) found that this strategy provides more precise                H2 O (http://www.cfa.harvard.edu, last access: 31 March
O3 estimations than those retrieved from the broad 1000–                     2022).
1005 micro-window when compared to independent mea-
surements. Setup 4MWs is the same as 5MWs, but the micro-                  – All setups use the same a priori gas profiles, which are
window at the greatest wavenumbers is discarded in order                     taken from the climatological model WACCM (Whole
to avoid any possible saturation of the strong O3 absorp-                    Atmosphere Community Climate Model, http://waccm.
tion lines contained in this region, especially at high O3 con-              acd.ucar.edu, last access: 31 March 2022) version 6,
centrations and low solar elevations. Setups 1000T, 4MWsT,                   generated by the NCAR (National Center for Atmo-
and 5MWsT use the same micro-windows as setups 1000,                         spheric Research, James Hannigan, personal communi-
4MWs, and 5MWs respectively, but an optimal estimation of                    cation, 2014).
the atmospheric temperature profile is simultaneously carried              – All setups apply the actual ILS time series evaluated
out. To this end, four CO2 micro-windows are added between                   from independent N2 O-cell measurements (Fig. 1).
962.80 and 969.60 cm−1 according to García et al. (2012).

Atmos. Meas. Tech., 15, 2557–2577, 2022                                                   https://doi.org/10.5194/amt-15-2557-2022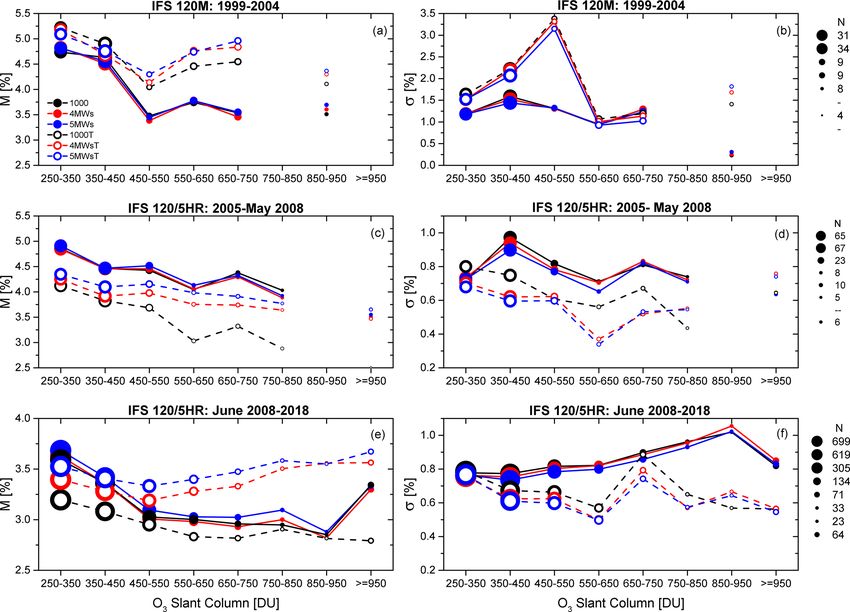
O. E. García et al.: Improved ozone monitoring by ground-based FTIR spectrometry                                                     2561

Figure 2. (a) Spectral regions considered in the different FTIR O3 retrieval strategies: the broad window used in the setups 1000 and 1000T
(encompassing the 1000–1005 cm−1 spectral region) and the four and five micro-windows used in the setups 4MWs/4MWsT (between ∼ 991
and 1009 cm−1 ) and 5MWs/5MWsT (between ∼ 991 and 1014 cm−1 ), respectively. Red and black lines depict, respectively, examples of
the simulated and measured spectra taken on 31 August 2007 (at a solar zenith angle (SZA) of ≈ 50◦ , an O3 amount in the slant column (O3
SC) of 390 DU, and an H2 O TC of 10.7 mm). Grey lines show the difference between the measurement and simulation. (b) Spectral changes
in the measured FTIR radiances (1R) due to changes in the H2 O content of 50 % (TC of 16.1 mm), 100 % (TC of 21.5 mm), and 200 % (TC
of 32.3 mm).

  – The pressure and temperature profiles for forward sim-              O3 retrieval is simultaneously performed with an H2 O scal-
    ulations are taken from the NCEP (National Centers for              ing fit, which uses the previously derived H2 O state. The re-
    Environmental Predictions) 12:00 UT daily database.                 maining interfering gases are simultaneously estimated with
                                                                        O3 in the second step. As discussed in detail in Appendix A,
  – For those approaches performing a simultaneous opti-                the H2 O cross-interference is reduced by the two-step strat-
    mal estimation of the atmospheric temperature profile,              egy when the temperature retrieval is considered, which sug-
    the NCEP 12:00 UT daily temperature profiles are used               gests that this approach could be valid for humid FTIR sites.
    as the a priori profiles. The a priori temperature covari-             Once FTIR retrievals are computed, they are filtered ac-
    ance matrix (SaT ) is constructed following Schneider               cording to (1) the number of iterations at which the conver-
    et al. (2008a).                                                     gence is reached and (2) residuals of the simulated–measured
                                                                        spectrum comparison. This ensures that unstable or impre-
   Given the importance of H2 O absorption across the in-               cise observations are not considered (which would likely be
frared spectrum, the treatment of H2 O in O3 retrievals should          introduced, for example, by thin clouds) (García et al., 2016).
be carefully considered in the inversion strategy, as illus-            These two quality flags are applied independently on the six
trated in Fig. 2. This figure shows an example of the changes           O3 datasets, and only those measurements available for all
in the FTIR radiances for the O3 spectral micro-windows                 setups are considered in subsequent analysis. This leads to a
due to changes in the H2 O content of 50 %, 100 %, and                  total of 5393 O3 observations between 1999 and 2018 that
200 %. These values, which correspond to extreme condi-                 are coincident and quality filtered (∼ 90 % of the original
tions at IZO, might account for typical H2 O contents and               dataset).
variations at sites with greater humidity. As observed, the
spectral signatures of H2 O variations are much stronger in             3.2     Theoretical quality assessment
the broad 1000 spectral region than in the narrow micro-
windows (4MWs/5MWs), indicating that the quality of the                 3.2.1    Vertical sensitivity and fitting residuals
O3 products in that region strongly depends on the cor-
rect interpretation of the spectroscopic H2 O signal. There-            Because the vertical resolution of ground-based FTIR mea-
fore, in order to minimise interference errors due to H2 O, a           surements is limited, a proper description of the relation be-
two-step inversion strategy has been applied (García et al.,            tween the retrieved and true states must be provided together
2012, 2014): firstly, the actual H2 O profile is derived using a        with the retrieved vertical profile. This information is theo-
dedicated H2 O retrieval (Schneider et al., 2012), and then the         retically characterised by the averaging kernel matrix (A) ob-

https://doi.org/10.5194/amt-15-2557-2022                                                   Atmos. Meas. Tech., 15, 2557–2577, 2022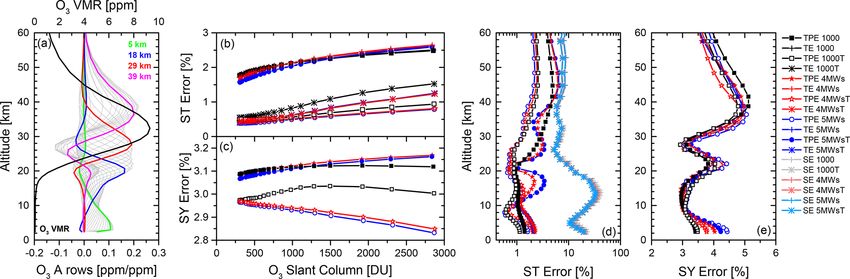
2562                                  O. E. García et al.: Improved ozone monitoring by ground-based FTIR spectrometry

tained in the retrieval procedure (Rodgers, 2000). The rows         evaluates how different error sources could be propagated
of this matrix describe the altitude regions that mainly con-       into the retrieved products. The theoretical error assess-
tribute to the retrieved profile and therefore the vertical dis-    ment carried out in the present paper is based on Rodgers
tribution of the FTIR sensitivity, while its trace (also called     (2000) and analytically performed by the PROFFIT package.
the degrees of freedom for signal, DOFS) gives the number           The Rodgers formalism distinguishes three types of error:
of independent O3 layers detectable by the remote-sensing           (1) smoothing error (SE) associated with the limited vertical
FTIR instrument. As an example, Fig. 3a depicts the A rows          sensitivity of the remote-sensing FTIR instruments, (2) spec-
for the 5MWs setup for the measurement of Fig. 2, while             tral measurement noise, and (3) uncertainties in the input/-
Table 1 summarises the DOFS statistics for the six retrieval        model parameters (instrumental characteristics, spectroscopy
strategies considered.                                              data, . . . ), which are split into statistical (ST) and system-
   The A rows are quite similar for all setups, with a me-          atic (SY) contributions. Given that SE can be considered an
dian total DOFS value of ∼ 4, meaning that the FTIR sys-            inherent characteristic of the remote-sensing technique, it is
tem is able to roughly resolve four independent atmospheric         not included in the uncertainty assessment suggested by the
O3 layers: the troposphere (2.37–13 km), the upper tropo-           NDACC IRWG (IRWG, 2014). Therefore, it has been sep-
sphere/lower stratosphere (UTLS) or tropopause region (12–          arately considered in this work by distinguishing the total
23 km), the middle stratosphere around the ozone maximum            parameter error (TPE), which is calculated as the the square
(22–29 km), and the upper stratosphere (28–42 km). How-             root of the quadratic sum of all error sources considered with
ever, the total DOFS values are found to be greater for those       the exception of the SE, and the total error (TE), which con-
setups using narrower micro-windows than for the broad              siders both the TPE and SE. A detailed description of the
spectral window (see Table 1), whereby the former configu-          uncertainty assessment is given in Appendix B.
rations seem to offer better vertical sensitivity (especially the      In order to assess the effect of O3 absorption signatures
5MWs setup). This pattern is independent of the FTIR in-            on the uncertainty budget, the dependence of the estimated
strument and consistent over time, as observed for the three        errors on the O3 slant column (SC) amounts for each re-
periods analysed (1999–2004, 2005–May 2008, and June                trieval setup has been examined. This analysis allows pos-
2008–2018). The comparison between the instruments also             sible inconsistencies between the setups or saturations of O3
reveals, as expected, a lower sensitivity to the O3 concen-         absorption lines at high O3 concentrations to be detected. As
trations of the IFS 120M spectra as compared to the IFS             shown in Fig. 3, both statistical and systematic uncertainties
120/5HR measurements. Overall, the total DOFS values dif-           do depend on the O3 spectroscopic signatures for all setups
fer by 5.5 % (1000) and 5.1 % (5MWs) between the 1999–              due to the increase in most of the error sources considered
2004 and 2008–2018 periods, respectively. When simultane-           at larger O3 SCs (see details in Appendix B). Figure 3 also
ously fitting the atmospheric temperature profile, the median       documents that the inclusion of a simultaneous temperature
DOFS values slightly decrease for all strategies because the        retrieval significantly improves the theoretical performance
information contained in the measured spectra is then split         for all FTIR O3 products. Although this fit generates a nega-
into O3 and temperature retrievals (the retrieved state vec-        tive cross-interference with the ILS, measurement noise, and
tor space is not perfectly orthogonal). Likewise, the differ-       smoothing error (especially for the 1000T setup, Fig. B1),
ences between both instruments become more accentuated              in return, the temperature error contribution is nearly elimi-
(e.g. 6.6 % and 5.7 % between the 1999–2004 and 2008–               nated, decreasing the total ST budget by ∼ 1 %. The TPE and
2018 periods for 1000T and 5MWsT, respectively). As with            TE range from 1.5 % to 2.5 % (between 250 and 3000 DU)
the DOFS analysis, the fitting residuals are smaller for those      for setups without a simultaneous temperature fit, while the
setups that use narrow micro-windows and apply the temper-          TPE varies from 0.5 % to 1.0 % (or to 1.5 % for the TE due to
ature fit, allowing a more detailed interpretation of the mea-      the influence of the SE) when including the temperature re-
sured spectra to be obtained (as also summarised in Table 1).       trieval. The total systematic contributions also drop by 0.3 %
In addition, the IFS 120M retrievals are found to be consid-        (at high O3 SCs) with mean values of ∼ 3 %. It is worth high-
erably more variable than the IFS 120/5HR data. However, it         lighting that an inconsistency between the 4MWsT/5MWsT
is fair to admit that the differences among retrieval strategies    and 1000T setups has been detected in the systematic uncer-
lie within the respective error confidence intervals, so no ro-     tainty budget, which is determined by the spectroscopy er-
bust conclusions can be reached. Note that, in order to make        rors. For the 1000T configuration, the spectroscopic SY error
a fair comparison, the fitting residuals are computed as the        exhibits a reverse smile curve with O3 concentrations, and is
noise-to-signal ratio for a common spectral region present in       considerably greater than for the narrow micro-window se-
all setups (1001.47–1003.04 cm−1 ).                                 tups. This result might point to a possible saturation of the
                                                                    deeper O3 lines contained in the broad window or some in-
3.2.2   Uncertainty analysis                                        consistency in the spectroscopy parameters. For example, an
                                                                    erroneous parameterisation of the temperature dependence of
The characterisation of the different FTIR O3 products is           the O3 line width may produce systematic differences be-
completed by performing an uncertainty analysis, which              tween actual and retrieved temperature profiles (Schneider

Atmos. Meas. Tech., 15, 2557–2577, 2022                                              https://doi.org/10.5194/amt-15-2557-2022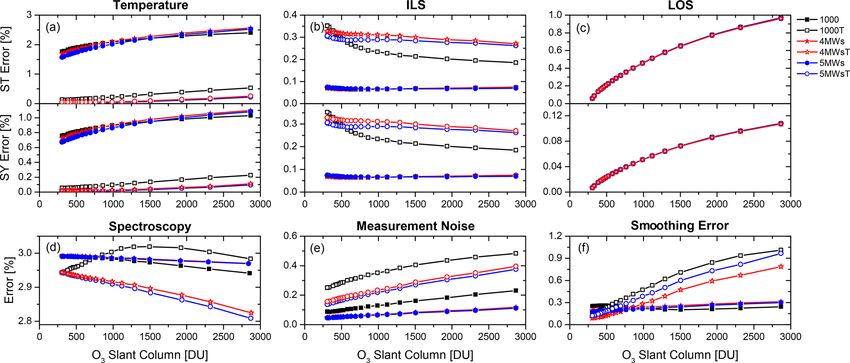
O. E. García et al.: Improved ozone monitoring by ground-based FTIR spectrometry 2563
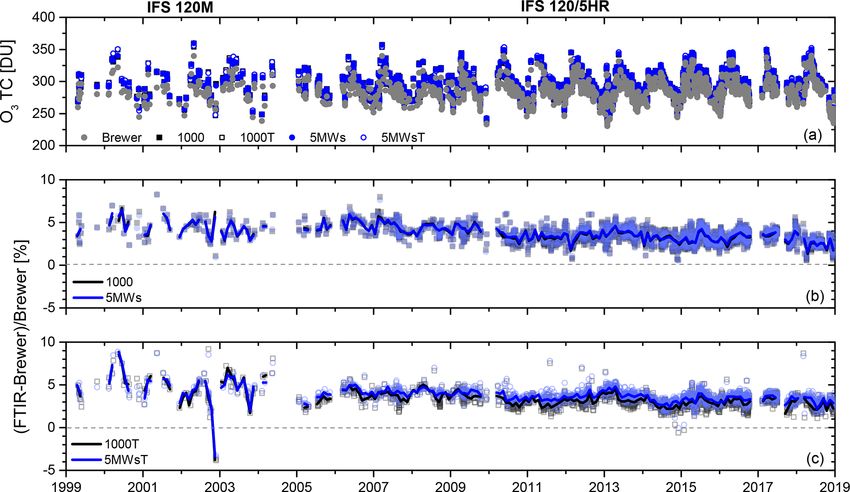
Figure 3. Summary of the theoretical quality assessment. (a) Example of averaging kernel (A) rows for the 5MWs setup on a logarithmic
scale for the measured spectrum of Fig. 2. Coloured lines highlight the A rows at altitudes of 5, 18, 29, and 39 km, which are representative
of the four layers detectable by the FTIR instrument (total DOFS of 4.41). The retrieved O3 VMR profile is also shown. (b) Statistical (ST)
and (c) systematic (SY) contributions of the total parameter error (TPE, in %) and total error (TE, in %) for O3 TCs retrieved from the setups
1000/1000T, 4MWs/4MWsT, and 5MWs/5MWsT as a function of O3 slant column (DU) for measurements taken on 31 August 2007 from
SZAs between 84◦ (∼ 07:00 UT) and 21◦ (∼ 13:30 UT). TPE is computed as the square root of the quadratic sum of all ST and SY error
sources considered with the exception of the smoothing error (SE), while the TE considers the TPE and SE. Examples of the ST (d) and
SY (e) contributions of the TPE and SE profiles (%) for all setups for the measured spectrum of Fig. 2.
Table 1. Summary of statistics of the DOFS and fitting residuals for the setups 1000/1000T, 4MWs/4MWsT, and 5MWs/5MWsT for the
periods 1999–2004, 2005–May 2008, and June 2008–2018 and for the entire time series (1999–2018). Shown are the median (M) and
standard deviation (σ ) for each period. The number of quality-filtered measurements is 519, 745, and 4219 for the three periods, respectively,
and 5393 for the whole dataset. The strategies showing the best performance, in terms of largest DOFS and smallest residuals, are highlighted
in bold for each period.
Setup DOFS Residuals (×10−3 )
1999–2004 2005–2008 2008–2018 1999–2018 1999–2004 2005–2008 2008–2018 1999–2018
M, σ M, σ M, σ M, σ M, σ M, σ M, σ M, σ
1000 3.76, 0.25 3.99, 0.21 3.98, 0.14 3.97, 0.18 3.56, 1.90 2.62, 0.93 2.75, 0.55 2.77, 0.93
4MWs 4.09, 0.28 4.34, 0.12 4.30, 0.12 4.30, 0.17 3.51, 1.90 2.57, 0.85 2.70, 0.54 2.71, 0.91
5MWs 4.29, 0.28 4.56, 0.15 4.52, 0.12 4.51, 0.17 3.53, 1.90 2.58, 0.87 2.70, 0.55 2.73, 0.92
1000T 3.66, 0.31 3.98, 0.26 3.92, 0.17 3.91, 0.22 3.50, 1.90 2.60, 0.91 2.73, 0.55 2.75, 0.92
4MWsT 3.91, 0.33 4.24, 0.18 4.17, 0.15 4.16, 0.20 3.46, 1.90 2.55, 0.86 2.68, 0.54 2.70, 0.91
5MWsT 4.10, 0.33 4.42, 0.20 4.35, 0.15 4.35, 0.21 3.45, 1.90 2.56, 0.87 2.68, 0.54 2.70, 0.91
and Hase, 2008), therefore affecting the absolute value of O3 procedure. TPE values of 1.0 %–1.5 % are expected for the
FTIR products. 1000T, 4MWsT, and 5MWsT setups, and values as high as
Vertically, the most important contribution is the SE reach- 6 % when the temperature fit is not taken into account. In
ing ∼ 40 % in the UTLS region (Fig. 3d), where the O3 con- relation to the systematic uncertainty profiles (Fig. 3e), they
centrations are very variable and the profile might be highly range from 3 % in the UTLS and middle stratosphere (around
structured. The FTIR system is not able to resolve such fine 30 km) to 5 % in the upper stratosphere. As with statistical er-
vertical structures. Excluding the SE, the statistical TPE pro- rors, the temperature contribution decreases when including
files are strongly linked to the atmospheric temperature, with the atmospheric temperature profile in the retrieval, leading
maximal errors beyond the UTLS region (where the maxi- to smaller systematic errors in O3 TCs, as mentioned above.
mum FTIR sensitivity and the largest O3 concentrations are The error estimation presented here assumes the same set
also located, see Fig. 3a). This pattern is consistently ob- of uncertainty values for all setups, which is representative
served for both setups with and without fitting the atmo- of the IFS 120/HR instrument in the period 2005–2008 (Ta-
spheric temperature profiles. However, the error values dras- ble B1 in Appendix B). However, some error sources do
tically drop when considering the temperature in the retrieval strongly depend on instrument status (particularly the ILS
https://doi.org/10.5194/amt-15-2557-2022 Atmos. Meas. Tech., 15, 2557–2577, 2022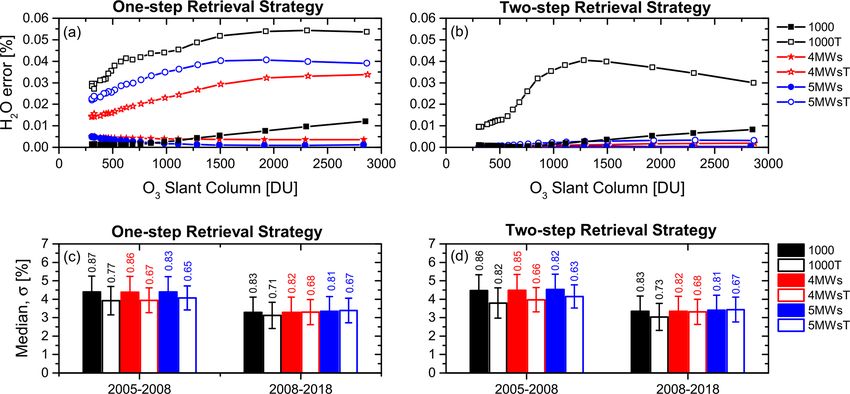
2564 O. E. García et al.: Improved ozone monitoring by ground-based FTIR spectrometry
function, solar pointing, and measurement noise), affecting of O3 TCs retrieved from the different FTIR setups, espe-
the total uncertainty budget. In order to account for the dif- cially by those including the temperature fit. Hence, when no
ferent quality periods of the IZO FTIR instruments, the un- independent observations are available, the analysis of differ-
certainty analysis for different sets of error values is included ent FTIR products could offer additional tools for identifying
in Appendix B. inconsistencies and documenting the long-term instrumental
To summarise, using several narrow micro-windows in- stability.
stead of a single broad region and applying a temperature Figure 4 also reveals that, although the scatter in the RD
profile fit has been found to provide more precise FTIR O3 is significantly improved by the temperature retrieval, these
estimations by increasing the vertical sensitivity and decreas- strategies generally present more extreme values as com-
ing the expected uncertainties. The simultaneous temperature pared to the Brewer data. The RD range between the 0.1st
retrieval could be a suitable approach provided the FTIR sys- and 99.9th percentiles is 7.4 % and 7.0 % for the 1000 and
tem is properly characterised, with a continuous assessment 5MWs setups, respectively, while it is 9.3 % and 8.6 % for
of ILS function, and is stable over time (e.g. IFS 120/5HR the 1000T and 5MWsT configurations, respectively. Note
spectrometers), in order to minimise the negative influence that, for example, the extreme RD values obtained for the
of the ILS uncertainties and measurement noise on O3 re- 1000T and 5MWsT setups at the beginning of 2000 and at
trievals. Finally, although the narrow micro-window setups the end of 2002 (Fig. 4c) are not reproduced by the 1000
provide very consistent results, the 5MWsT setup has been and 5MWs strategies (Fig. 4b). This pattern is consistently
theoretically shown to be superior for the typical O3 concen- observed for all setups and over time. The extreme RD val-
trations observed at tropical and subtropical latitudes. ues may indicate measurement days with an unusual tem-
perature vertical stratification, which might be wrongly cap-
tured by the Brewer and FTIR products that assume a fixed
4 Comparison to reference observations temperature (and pressure) profile. For forward calculations
of those FTIR strategies without a simultaneous temperature
4.1 FTIR and Brewer ozone total columns fit, the temperature and pressure profiles are updated daily
from the NCEP database, as previously mentioned, but they
The performance of each of the six FTIR O3 retrieval are kept constant during the O3 retrieval procedure. Regard-
strategies has been assessed by comparison with coincident ing Brewer, no temperature or pressure dependence is con-
NDACC Brewer O3 TC data. In order to mitigate the in- sidered in the operational data processing (Redondas et al.,
fluence of the O3 intra-day variations on comparisons, only 2014; Rimmer et al., 2018). In particular, the Brewer O3
FTIR and Brewer measurements within a temporal coinci- TCs are computed using the so-called effective O3 cross sec-
dence of 5 min have been paired, which makes a total of 2231 tions throughout the atmosphere (Bass and Paur, 1985), cor-
coincidences between 1999 and 2018. responding to an O3 effective height of 22 km and a fixed ef-
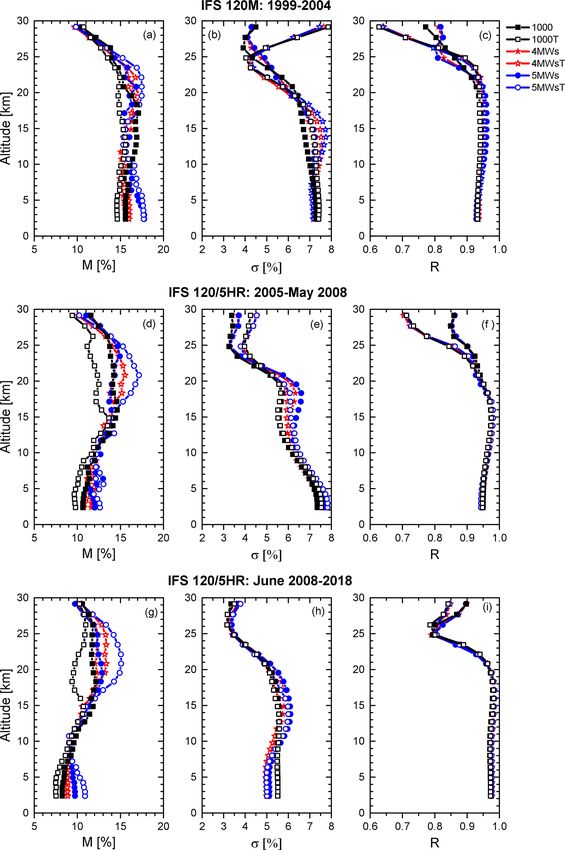
Figure 4 displays the time series of the Brewer observa- fective temperature of the O3 layer of −45 ◦ C. These simpli-
tions together with four examples of FTIR retrievals (for sim- fications can produce systematic (seasonal dependence) and
plicity, only the setups 1000/1000T and 5MWs/5MWsT are random errors (Redondas et al., 2014; Gröbner et al., 2021).
depicted), as well as the time series of corresponding relative In fact, at IZO, the effective temperature and O3 height sig-
differences (RD, FTIR–Brewer). The temporal O3 TCs vari- nificantly differ from the values assumed by Brewer process-
ations are in general reproduced well by all FTIR products. ing in winter months, when the extreme RD values are ob-
However, this figure makes the difference in performance of served (Fig. 4c). Nevertheless, a more dedicated study would
the two FTIR instruments evident: while the RD values of the be desirable to deeply investigate the causes driving these
IFS 120/5HR instrument are very stable over time, the IFS anomalous values.
120M instrument exhibits more erratic behaviour. Besides When analysing in detail the intercomparison results (Ta-
the greater variability of the IFS 120M and the switching of ble 2), it is confirmed that, first, the more refined setups us-
instruments in 2005, the most remarkable feature is a discon- ing narrow micro-windows offer the best performance (es-
tinuity detected at the beginning of 2010 by a non-parametric pecially 5MWs/5MWsT) independently of the treatment of
change-point test (Lanzante, 1996) (at the 99 % confidence the atmospheric temperature profile, and second, the effect of
level). The systematic jump is ∼ 1.1 % for the setups without the simultaneous temperature fit on the FTIR O3 quality de-
temperature fitting, and is partially corrected by retrieving the pends on the instrumental stability. The agreement between
temperature: ∼ 0.7 %. The change point, already reported by the FTIR and Brewer observations significantly worsens for
García et al. (2014), is likely due to modifications of the IFS the more unstable IFS 120M spectrometer when the temper-
120/5HR spectrometer (failure of the interferometer’s scan- ature fit is included in the retrieval procedure (the largest me-
ner motor and its subsequent replacement). Another change dian bias and scatter and the least correlation for the 1999–
point was detected by Lanzante’s approach around the begin- 2004 period). Opposite behaviour is documented for the IFS
ning of 2014, but was less intense. It is worth highlighting 120/5HR periods: the temperature retrieval consistently im-
that both discontinuities were also detected in the differences proves the precision and accuracy of all FTIR O3 products by
Atmos. Meas. Tech., 15, 2557–2577, 2022 https://doi.org/10.5194/amt-15-2557-2022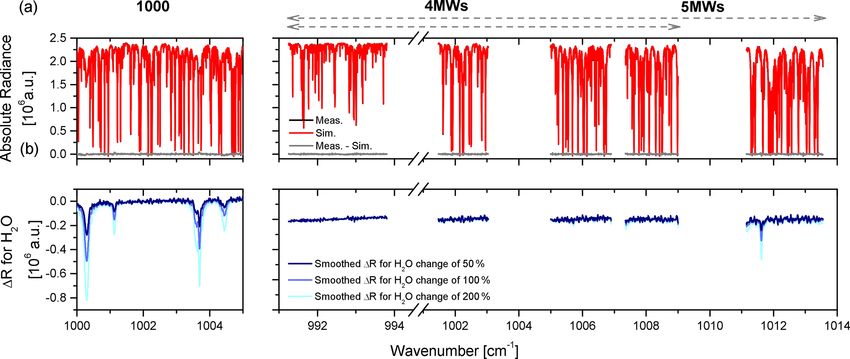
O. E. García et al.: Improved ozone monitoring by ground-based FTIR spectrometry                                                                           2565

Figure 4. Summary of the FTIR–Brewer comparison from 1999 to 2018. (a) Time series of O3 TCs (DU) as observed by Brewer and FTIR
1000/1000T and 5MWs/5MWsT setups. (b) Time series of relative differences (RD) for the setups 1000 and 5MWs, which were calculated
as RD(%) = 100 × (O3 TCX − O3 TCY )/O3 TCY , where X and Y refer to FTIR and Brewer, respectively. (c) As for (b), but for the setups
1000T and 5MWsT. Solid lines in (b) and (c) correspond to monthly medians.

Table 2. Summary of statistics for the FTIR–Brewer comparison for the setups 1000/1000T, 4MWs/4MWsT, and 5MWs/5MWsT: the median
(M, in %) and standard deviation (σ , in %) of the relative differences and Pearson correlation coefficient (R) of the direct comparison are
shown for the periods 1999–2004, 2005–May 2008, and June 2008–2018 and for the entire time series (1999–2018). Also shown are the
median of the theoretical TPE (MTPE ), SE (MSE ), and TE (MTE ) uncertainties. The number of coincident FTIR–Brewer measurements is
93, 185, and 1892 for the three periods, respectively, and 2170 for the whole dataset. The strategies showing the best performance in terms
of smallest σ and MTE are highlighted in bold for each period.

 Setup                1999–2004                            2005–2008                             2008–2018                             1999–2018
              M, σ , R, MTPE , MSE , MTE           M, σ , R, MTPE , MSE , MTE            M, σ , R, MTPE , MSE , MTE            M, σ , R, MTPE , MSE , MTE
              (%), (%), –, (%), (%), (%)           (%), (%), –, (%), (%), (%)            (%), (%), –, (%), (%), (%)            (%), (%), –, (%), (%), (%)
 1000      4.29, 1.38, 0.957, 1.85, 0.23, 1.87   4.47, 0.86, 0.970, 1.85, 0.23, 1.87   3.35, 0.83, 0.982, 1.83, 0.23, 1.85   3.46, 0.95, 0.975, 1.84, 0.23, 1.85
 4MWs      4.28, 1.36, 0.959, 1.79, 0.19, 1.80   4.49, 0.85, 0.971, 1.78, 0.19, 1.80   3.34, 0.82, 0.982, 1.77, 0.19, 1.78   3.45, 0.93, 0.976, 1.77, 0.19, 1.78
 5MWs      4.35,1.32, 0.962, 1.68, 0.16, 1.68    4.53, 0.82, 0.973, 1.66, 0.17, 1.67   3.41, 0.81, 0.983, 1.65, 0.17, 1.66   3.50, 0.91, 0.977, 1.65, 0.17, 1.66
 1000T     4.83, 1.97, 0.926, 0.52, 0.24, 0.57   3.79, 0.82, 0.972, 0.51, 0.15, 0.53   3.04, 0.73, 0.986, 0.51, 0.16, 0.53   3.12, 0.90, 0.977, 0.51, 0.16, 0.53
 4MWsT     4.84, 1.90, 0.934, 0.44, 0.21, 0.48   3.97, 0.66, 0.981, 0.42, 0.10, 0.44   3.32, 0.68, 0.988, 0.42, 0.12, 0.44   3.40, 0.83, 0.981, 0.42, 0.12, 0.44
 5MWsT     4.81, 1.82, 0.940, 0.40, 0.22, 0.44   4.15, 0.63, 0.983, 0.39, 0.09, 0.40   3.44, 0.67, 0.988, 0.39, 0.11, 0.40   3.53, 0.81, 0.982, 0.39, 0.11, 0.40

considerably reducing the dispersion and bias of the RD dis-                       (i.e. the instrumental degradation and solar pointing errors).
tributions. Thus, the best performance is obtained by those                        Nonetheless, Table 2 also documents that the scatter found in
setups using narrow micro-windows, with a RD scatter of                            the RD is noticeably lower than that predicted when the tem-
only ∼ 0.6 %–0.7 % (this increases up to ∼ 0.8 % for the                           perature fit is not considered, especially for the IFS 120/5HR
broader region setup) for the IFS 120/5HR instrument; while                        instrument (see MTE values). This fact could indicate that
it is as high as 2 % for the IFS 120M when the simultaneous                        sources of uncertainty partially cancel each other out, which
temperature fit is carried out. These values perfectly agree                       is not fully reproduced by the theoretical error assessment,
with previous studies (e.g. Schneider et al., 2008a; García                        and/or the possible overestimation of the assumed tempera-
et al., 2012) and lie within the expected precision of both in-                    ture uncertainty. As also shown in Appendix B, reducing the
struments (see Sects. 2.2 and 3.2.2 and Appendix B). In fact,                      latter would contribute to reconciling the experimental and
as shown in Appendix B, total statistical errors of ∼ 0.5 %–                       theoretical results. Note that the scatter values found for the
1.5 % can be expected depending on the instrument status                           IFS 120/5HR spectrometer can be used to derive a conserva-

https://doi.org/10.5194/amt-15-2557-2022                                                                 Atmos. Meas. Tech., 15, 2557–2577, 2022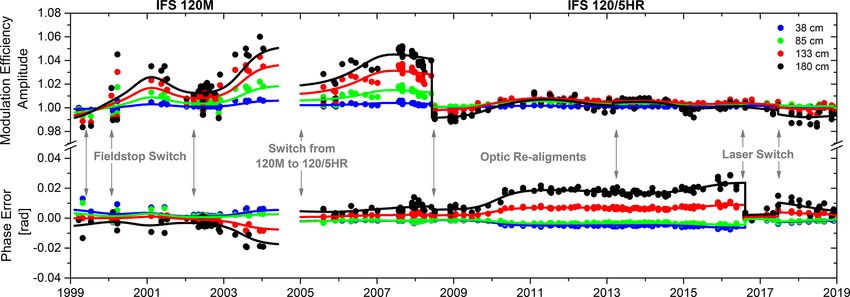
2566                                   O. E. García et al.: Improved ozone monitoring by ground-based FTIR spectrometry

tive value for the precision of the FTIR O3 TC estimations,           (see Fig. B1). The same behaviour is found for the baseline
since they can be interpreted as the root of the sum of squares       error (data not shown). Hence, an increment in the assumed
of the precision of the Brewer or FTIR instrument.                    uncertainties for these two error sources when the tempera-
   Regarding the systematic differences, a median bias of             ture is included in the retrieval procedure could partially re-
∼ 3 %–5 % is obtained. Such discrepancies are consistent              duce discrepancies between the theoretical and experimental
with previous studies (e.g. Schneider et al., 2008a; García           assessments. Note that while the 1000/1000T setups provide
et al., 2012; García et al., 2016), and are mainly attributed         the most accurate O3 TCs with respect to Brewer data for the
to inconsistencies between infrared and ultraviolet spectro-          whole O3 SC range for both instruments, the 5MWs/5MWsT
scopic parameters (e.g. Piquet-Varrault et al., 2005; Gratien         setups offer the most precise O3 TCs. This result further cor-
et al., 2010; Drouin et al., 2017; Tyuterev et al., 2019). In fact,   roborates that the broad region seems to be less sensitive to
as recently presented by Gordon et al. (2022), the most recent        the improvement generated by the temperature retrieval.
release of the HITRAN spectroscopic database (HITRAN                      The long-term FTIR time series used in this study allows
2020) improves the O3 line intensities in the 1000 cm−1               us to investigate not only the overall quality and long-term
spectral band by applying a scaling factor of 3 %. This cor-          consistency of new products, but also the effects at different
rection agrees well with our theoretical uncertainty estima-          timescales. At a seasonal scale, the agreement between FTIR
tions and the overestimation found for the FTIR products.             and Brewer is excellent: the annual cycles are completely in
   Similar conclusions can be reached in general when the             phase, with Pearson correlation coefficients of greater than
comparison is performed as a function of O3 signatures in             0.99 for all retrieval strategies considered (Fig. 6a and b).
the slant path (Fig. 5). The temperature fit improves the per-        However, the bias between both techniques depends on the
formance of the stable instrument and makes it worse for              O3 amounts, leading to a seasonal effect on RD, which is
the more unstable instrument, independently of the O3 SC              likely due to the fact that the Brewer and FTIR products ex-
range covered at IZO. In addition, the bias between FTIR              hibit different responses to O3 seasonal variations. On the
and Brewer data decreases by ∼ 1 % overall as the O3 SCs in-          one hand, the FTIR sensitivity is strongly anti-correlated
crease for all setups (Fig. 5a, c, and e). This dependence can        with the O3 SC annual cycle: the lower the O3 amounts, the
in part be accounted for the Brewer systematic uncertainties          less saturated the O3 absorption lines. This results in mini-
in the absolute calibration process, which are amplified for          mum (maximum) DOFS in winter (spring/summer) (García
low O3 SCs (up to 0.5 %; Schneider et al., 2008a). However,           et al., 2012). On the other hand, the different treatments of
for the more stable IFS 120/5HR period (Fig. 5e), the bias            the atmospheric temperature and the O3 vertical distribution
alters this behaviour for O3 SCs beyond ∼ 550 DU for setups           in the Brewer data processing and the FTIR data processing
using narrow micro-windows when the simultaneous temper-              also generate seasonal artefacts, as stated above for the ex-
ature retrieval is considered. This issue could be attributed         treme RD values. In fact, including the temperature retrieval
to inconsistencies in the spectroscopic parameters at higher          significantly modifies the RD seasonal patterns, as observed
wavenumbers, which gain importance as O3 concentrations               in Fig. 6c and d.
increase, and is in line with the theoretical systematic in-              For those approaches without a simultaneous temperature
consistency found between the 1000T and 4MWsT/5MWsT                   fit (Fig. 6c), the RD annual cycle seems to follow the typical
setups (Sect. 3.2.2). However, the number of FTIR–Brewer              O3 TC seasonality at the subtropical latitudes: peak values
coincidences at IZO is rather small for O3 SCs greater than           in spring and minimum in autumn–winter, as a result of the
550 DU (i.e. less than ∼ 20 % of the Brewer data in the 1999–         joint effect of the annual shift in the height of the subtropical
2018 period); therefore, a more robust dataset would be rec-          tropopause and the annual cycle of O3 photochemical pro-
ommended to better understand what drives this different pat-         duction associated with tropical insolation (e.g. García et al.,
tern.                                                                 2014; García et al., 2021). Hence, a significant correlation
   As pointed out by the theoretical uncertainty analysis, sta-       between the averaged RD and O3 TC annual cycles for all
tistical errors are expected to increase with O3 SCs for all          setups is found, with Pearson correlation coefficients rang-
setups. This can be seen in the scatter of the RD for the IFS         ing from 0.68 to 0.84 for the 1000 and 5MWs strategies, re-
120/5HR periods (Fig. 5d and f) when the temperature fit is           spectively. This relationship drops to correlation values be-
not applied (i.e. the scatter of the RD increases by 0.2 % in         tween 0.32 and 0.60 for the 1000T and 5MWsT setups, re-
the 2008–2018 period at larger O3 SCs). However, the inter-           spectively. However, in return, a seasonal dependence on the
comparison results seem not to exhibit a similar dependence           upper-stratospheric temperature is detected (Fig. 6f displays,
when the temperature retrieval is considered, as expected. At         as an example, the annual cycle of averaged temperature at
larger O3 SCs, including this fit can lead to differences of          39 km from the NCEP database along with those retrieved
0.2 % compared to when this fit is not included. This could be        from the FTIR setups). The correlation between the averaged
attributed to an underestimation of the ILS and/or baseline er-       annual cycles of the upper-stratospheric temperature and RD
rors in the theoretical assessment: the ILS contribution to the       is ∼ 0.70 and ∼ 0.90 for the broad and narrow micro-window
total uncertainty budget decreases as the O3 SCs increase and         setups, respectively, when the temperature fit is included; it
becomes more important when the temperature fit is applied            is limited to between 0.46 and 0.61 when the temperature re-

Atmos. Meas. Tech., 15, 2557–2577, 2022                                                https://doi.org/10.5194/amt-15-2557-2022
O. E. García et al.: Improved ozone monitoring by ground-based FTIR spectrometry                                                   2567

Figure 5. Median and standard deviation of relative differences (RD, FTIR–Brewer) with respect to the Brewer O3 slant column (DU) for
the periods 1999–2004, 2005–May 2008, and June 2008–2018. Panels (a), (c), and (e) show median RD (M, in %) values for the three
periods, respectively, and (b), (d), and (f) show the same but for the standard deviation of the RD (σ , in %). Dotted area indicates the
number of coincident FTIR–Brewer measurements for each O3 SC interval (N ), which are included in the legend of each subplot. For better
visualisation, a scale factor of 3, 2, and 1 was applied to the dotted area for the periods 1999–2004, 2005–May 2008, and June 2008–2018,
respectively.

trieval is not considered. Note that a subtle relationship with        umn (PC) at 2.37–13, 12–23, and 22–29 km (the DOFS for
the temperature in the middle or lower stratosphere (e.g. at           all these layers is typically larger than 1). For this compari-
29 km in Fig. 6e) is found. Additionally, it has been found            son, the approach suggested by Schneider et al. (2008b) and
that the RD seasonal amplitudes are augmented overall by               García et al. (2012) was followed, whereby the ECC son-
the temperature retrieval. The broad spectral region seems to          des were corrected daily by comparing them to coincident
be the most sensitive to this effect: the RD peak-to-peak am-          Brewer data. By means of this correction, the quality and
plitude goes from 0.59 % (1000) to 0.97 % (1000T), while it            long-term stability of the ECC sonde data can be signifi-
is modified by less than 0.05 % for the 4MWs/5MWs setups.              cantly improved. In addition, the highly resolved ECC pro-
                                                                       files (x ECC ) were vertically degraded (x̂ ECC ) by applying the
4.2   FTIR and ECC ozone vertical profiles                             averaging kernels obtained in the FTIR O3 retrieval proce-
                                                                       dure (Rodgers, 2000) as follows:
In order to evaluate the influences of the six retrieval strate-
gies on the O3 vertical distribution, Fig. 7 displays the ver-         x̂ ECC = A(x ECC − x a ) + x a ,                              (1)
tical profiles of the relative differences between FTIR and
ECC sondes for the three periods considered, while Table 3             where x a is the a priori O3 VMR profiles. The ECC smooth-
summarises the comparison for the O3 layers that are suf-              ing allows, on the one hand, the limited sensitivity of FTIR
ficiently detectable by the FTIR system, i.e. the partial col-         data to be taken into account and, on the other hand, the ef-

https://doi.org/10.5194/amt-15-2557-2022                                                  Atmos. Meas. Tech., 15, 2557–2577, 2022
2568 O. E. García et al.: Improved ozone monitoring by ground-based FTIR spectrometry Figure 6. Summary of the FTIR–Brewer comparison at a seasonal scale for the 2009–2018 period. (a, b) Scatter plots of the Brewer and FTIR O3 TCs for the setups 1000/4MWs/5MWs and 1000T/4MWsT/5MWsT, respectively. (c, d) Averaged annual cycles of the Brewer O3 TC and RD for the setups 1000/4MWs/5MWs, and 1000T/4MWsT/5MWsT, respectively. (e, f) Averaged annual cycles of the atmospheric temperature at 29 km and 39 km, respectively, retrieved from the setups 1000T, 4MWsT, and 5MWsT, as well as the NCEP database. The legends in (a) and (b) display the slope, offset, and Pearson correlation coefficient of the least-squares fit, and the legends in (c) and (d) show the amplitude of the RD annual cycle (in %), the Pearson correlation coefficient between the RD and Brewer O3 TC annual cycles, and the annual cycle of atmospheric temperature (at 29 and 39 km, respectively). fects of the different strategies on retrieved O3 profiles to be ECC sondes at higher altitudes (see the standard deviation directly assessed. Note that, in order to homogenise the com- profiles in Fig. 7b, e, and h). However, as the instrument be- parison, only the ECC sondes with continuous measurements comes better aligned and more stable over time, the effect up to 29 km have been considered. Beyond this altitude, the of this cross-interference becomes less significant, until no ECC data were completed using the a priori profiles used in noticeable differences are observed for the 2008–2018 pe- FTIR O3 retrievals for computing x̂ ECC . Finally, the temporal riod. For example, the scatter at 29 km for the FTIR–ECC collocation window between FTIR and ECC sondes extends comparison only changes from 3.6 % to 3.8 % for the 5MWs to ±3 h around the sonde launch (typically at 12:00 UT) to and 5MWsT setups, respectively, for the 2008–2018 period, ensure sufficient pairs for a robust comparison (N = 272 in while the variation ranges between 4.3 % and 7.5 % for the the 1999–2018 period). 1999–2004 period. In the UTLS region, overall, the best The RD profiles show a strong vertical stratification, agreement is found for those setups without temperature pro- whereby the three independent layers detectable by the FTIR file fitting. This may indicate that the negative effect of the systems up to ∼ 30 km are clearly discernible (troposphere, ILS uncertainties and measurement noise prevails over the UTLS, and middle stratosphere; recall Fig. 3). In particu- improvement attributed to the temperature fit. The same pat- lar, beyond the UTLS region, the influence of ILS uncertain- tern is documented for the tropospheric O3 concentrations, ties on the retrieved O3 profiles becomes important with al- even though the differences among retrieval strategies are not titude, since the full width at half maximum of the narrow as significant as those at higher altitudes. Note that these scat- O3 absorption lines and the ILS function becomes compa- ter values agree well with the expected uncertainty for ECC rable. For all setups and periods, the simultaneous tempera- sondes (∼ 5 %–15 %) and with the FTIR theoretical error es- ture fit is found to worsen the agreement between FTIR and timation (recall Sect. 3.2.2), as well as with previous works Atmos. Meas. Tech., 15, 2557–2577, 2022 https://doi.org/10.5194/amt-15-2557-2022
You can also read