Large-scale synoptic drivers of co-occurring summertime ozone and PM2.5 pollution in eastern China - Recent
←
→
Page content transcription
If your browser does not render page correctly, please read the page content below
Atmos. Chem. Phys., 21, 9105–9124, 2021
https://doi.org/10.5194/acp-21-9105-2021
© Author(s) 2021. This work is distributed under
the Creative Commons Attribution 4.0 License.

Large-scale synoptic drivers of co-occurring summertime
ozone and PM2.5 pollution in eastern China
Lian Zong1 , Yuanjian Yang1 , Meng Gao2 , Hong Wang1 , Peng Wang3 , Hongliang Zhang4 , Linlin Wang5 , Guicai Ning6 ,
Chao Liu1 , Yubin Li1 , and Zhiqiu Gao1,5
1 School  of Atmospheric Physics, Nanjing University of Information Science & Technology, Nanjing, China
2 Department    of Geography, Hong Kong Baptist University, Hong Kong SAR, China
3 Policy Research Center for Environment and Economy, Ministry of Ecology and Environment of the

People’s Republic of China, Beijing, China
4 Department of environmental science and engineering, Fudan University, China
5 State Key Laboratory of Atmospheric Boundary Layer Physics and Atmospheric Chemistry (LAPC),

Institute of Atmospheric Physics, Chinese Academy of Sciences, Beijing, China
6 Institute of Environment, Energy and Sustainability, The Chinese University of Hong Kong, Shatin, N.T.,

Hong Kong SAR, China

Correspondence: Yuanjian Yang (yyj1985@nuist.edu.cn)

Received: 14 June 2020 – Discussion started: 6 August 2020
Revised: 20 April 2021 – Accepted: 5 May 2021 – Published: 15 June 2021

Abstract. Surface ozone (O3 ) pollution during summer            of surface O3 –PM2.5 compound pollution in a regional con-
(June–August) over eastern China has become more severe          text. Our findings demonstrate the important role played by
in recent years, resulting in a co-occurrence of surface O3      SWPs in driving regional surface O3 –PM2.5 compound pol-
and PM2.5 (particulate matter with aerodynamic diameters         lution, in addition to the large quantities of emissions, and
≤ 2.5 µm in the air) pollution. However, the mechanisms re-      may also provide insights into the regional co-occurring high
garding how the synoptic weather pattern (SWP) might influ-      levels of both PM2.5 and O3 via the effects of certain meteo-
ence this compound pollution remain unclear. In this study,      rological factors.
we applied the T-mode principal component analysis (T-
PCA) method to objectively classify the occurrence of four
SWPs over eastern China, based on the geopotential heights
at 500 hPa during summer (2015–2018). These four SWPs            1   Introduction
over eastern China were closely related to the western Pa-
cific subtropical high (WPSH), exhibiting significant intra-     In recent years, China has been experiencing serious air pol-
seasonal and interannual variations. Based on ground-level       lution problems owing to its enormous emissions of pollut-
air quality observations, remarkable spatial and temporal dis-   ing gases (e.g., sulfur dioxide and nitrogen dioxide (NO2 ))
parities of surface O3 and PM2.5 pollution were also found       and aerosol particulates (e.g., particulate matter with aero-
under the four SWPs. In particular, there were two SWPs that     dynamic diameters ≤ 2.5 or 10 µm in the air, abbreviated
were sensitive to compound pollution (Type 1 and Type 2).        to PM2.5 and PM10 , respectively) associated with its rapid
Type 1 was characterized by a stable WPSH ridge with its         economic development, industrialization and urbanization,
axis at about 22◦ N and the rain belt located south of the       together with certain unfavorable meteorological conditions
Yangtze River Delta (YRD); Type 2 also exhibited WPSH            (Wang and Chen, 2016; Zhang et al., 2014, 2016). In par-
dominance (ridge axis at ∼ 25◦ N) but with the rain belt (over   ticular, atmospheric compound pollution has become serious
the YRD) at a higher latitude compared to Type 1. In gen-        (Li et al., 2019; Saikawa et al., 2017; C. Zhang et al., 2019),
eral, SWPs have played an important role as driving factors      especially for the economically developed and densely pop-
                                                                 ulated eastern urban agglomerations of China, such as the

Published by Copernicus Publications on behalf of the European Geosciences Union.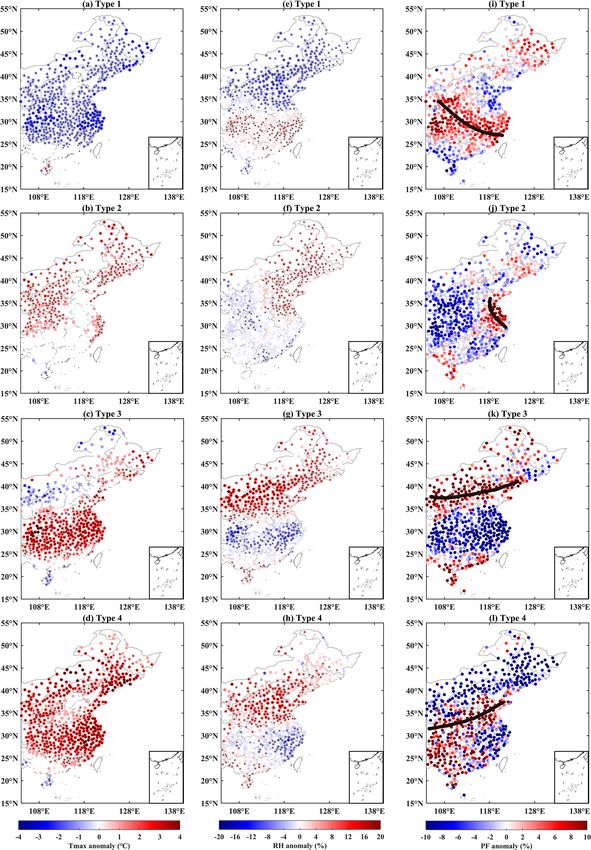
9106                                          L. Zong et al.: Summertime O3 –PM2.5 compound pollution in eastern China

Beijing–Tianjin–Hebei (BTH), Yangtze River Delta (YRD)            and 320 K, a minimum RH (RHmin ) of less than 40 %, and a
and Pearl River Delta (PRD) regions (Cai et al., 2017; Du et      minimum WS of less than 3 m s−1 ,
al., 2019; Ji et al., 2018; Li et al., 2020), exerting a severe      through an analysis of extreme O3 and PM2.5 events from
threat in terms of public health, economy and society (Chen       historical data (30 years for O3 and 10 years for PM2.5 ) in
et al., 2019; Cohen et al., 2017; Day et al., 2017; Yim et al.,   the United States. Furthermore, the number of annual ex-
2019).                                                            treme PM2.5 days was highly positively correlated with ex-
   In general, significant diurnal variation of PM2.5 pollution   treme RHmin /Tmax days, and the correlation coefficient be-
has been observed, possibly due to obvious local emissions        tween PM2.5 and RHmin (Tmax ) was highest in urban and
caused by industrial production and human activities related      suburban (rural) regions. Shi et al. (2020) studied the sen-
to daily living (Amil et al., 2016; H. Liu et al., 2019). In      sitivity of O3 -8 h (O3 8 h moving average) and PM2.5 asso-
particular, the pollution level tends to be higher during the     ciated with meteorological parameters. Their study focused
morning and evening of a normal weekday, with a weak-             on the air pollution and meteorological conditions between
ened effect found in the afternoon, possibly caused by the        January and July 2013, with the results showing that temper-
co-effects of the boundary layer structure and anthropogenic      ature could have had the greatest impact on the daily max-
emissions. There has also been seasonal variation of PM2.5        imum O3 -8 h, while the PM2.5 sensitivities were negatively
pollution detected across China, indicating a higher level of     (positively) correlated with temperature, WS and BLH (ab-
pollution in winter than summer (Ye et al., 2018; Zhang and       solute humidity) in most regions of China. Miao et al. (2015)
Cao, 2015). The PM2.5 level in China showed a steady in-          showed that RH was high when aerosol pollution occurred
crease from 2004 to 2007 and has since stabilized (Ma et          in the BTH region. However, O3 pollution in China is more
al., 2016); however, there are still frequent PM2.5 pollution     frequent in summer and the warm and humid flow brought
events in autumn and winter (Song et al., 2017; Yang et al.,      by the East Asian summer monsoon (EASM) induces a hot
2018; Ye et al., 2018; Zhang et al., 2014). In the past few       and humid condition over the summer. Zhao et al. (2019) in-
years, the PM2.5 concentration in China has decreased signif-     vestigated the RH of O3 pollution in Shijiazhuang between
icantly as a result of measures introduced across the country     15 June and 14 July 2016 and found that the O3 concentra-
that have reduced multi-pollutant emissions, adjusted the en-     tion was higher at moderate humidity (average RH during
ergy structure and increased the supply of clean energy (Gui      daytime from 10:00 to 17:00 LT was 40 %–50 %). Recently,
et al., 2019; Yang et al., 2020; Q. Zhang et al., 2019; Zhang     Han et al. (2020) assessed the impacts of local and synoptic
et al., 2020). While PM2.5 is still one of the dominant air       meteorological factors on the daily variability of surface O3
pollutants across China, surface O3 pollution in summer has       over eastern China. Their study revealed that meteorological
also gradually risen to prominence. Several studies have even     factors could explain ∼ 46 % of the daily variations in sum-
indicated that O3 might replace PM2.5 as the primary air pol-     mer surface O3 . In particular, synoptic factors contributed
lutant during summer (Li et al., 2019), which has caught the      ∼ 37 % to the overall effects associated with meteorological
attention of researchers in recent years. For instance, Sun et    factors. Furthermore, six predominant synoptic weather pat-
al. (2016) showed that the observed summertime O3 at Mt.          terns (SWPs) were identified by a self-organizing map, and
Tai increased significantly by 1.7 ppbv yr−1 for the month        related results indicated a weak cyclonic system and south-
of June and by 2.1 ppbv yr−1 for the months of July–August        ward prevailing wind induced the positive O3 anomalies over
during the period 2003–2015. Furthermore, an increase in the      eastern China. The abovementioned studies indicate that the
maximum daily 8 h average concentration of O3 (MDA8 O3 )          variations of meteorological factors play a non-negligible
at an annual average rate of 4.6 % was reported by Fan et         role in air pollution. Therefore, classification of air pollution
al. (2020), albeit with a decrease in the frequency of PM2.5      according to meteorological circulation has become particu-
pollution.                                                        larly important, not least because of its worth when applied
   The modulations of atmospheric circulation systems of-         to air quality monitoring, forecasting and evaluation (N. Liu
ten lead to changes in meteorological elements and thereby        et al., 2019; Ning et al., 2019; Yang et al., 2018; Zheng et al.,
also affect the processes of pollutant formation, transmission    2015).
and diffusion. Furthermore, many studies have indicated that         Since the 1990s, it has become possible to objectively clas-
PM2.5 and O3 pollution are strongly correlated with local         sify atmospheric circulation conditions using weather data
meteorological factors such as temperature, relative humidity     such as geopotential height (GH), sea level pressure, WS
(RH) and wind speed (WS) (Huang et al., 2016; Miao et al.,        and temperature, thus allowing the physical mechanism of
2015; Shu et al., 2019; Tai et al., 2010). Miao et al. (2015)     extreme weather to be better understood and analyzed. Com-
suggested that a low boundary layer height (BLH) and stable       pared with subjective weather classification, the objective ap-
atmosphere would be an unfavorable condition for the disper-      proach has been widely used in air pollution research (Miao
sion of winter aerosol pollution over the BTH region. Zhang       et al., 2017, 2019; Ning et al., 2018). Miao et al. (2019),
et al. (2017) found that the majority of O3 extremes occurred     based on the daily 900 hPa GH fields during winter in Bei-
with a daily maximum temperature (Tmax ) of between 300           jing, identified seven synoptic patterns using an objective
                                                                  approach and found that the weak northwesterly prevailing

Atmos. Chem. Phys., 21, 9105–9124, 2021                                             https://doi.org/10.5194/acp-21-9105-2021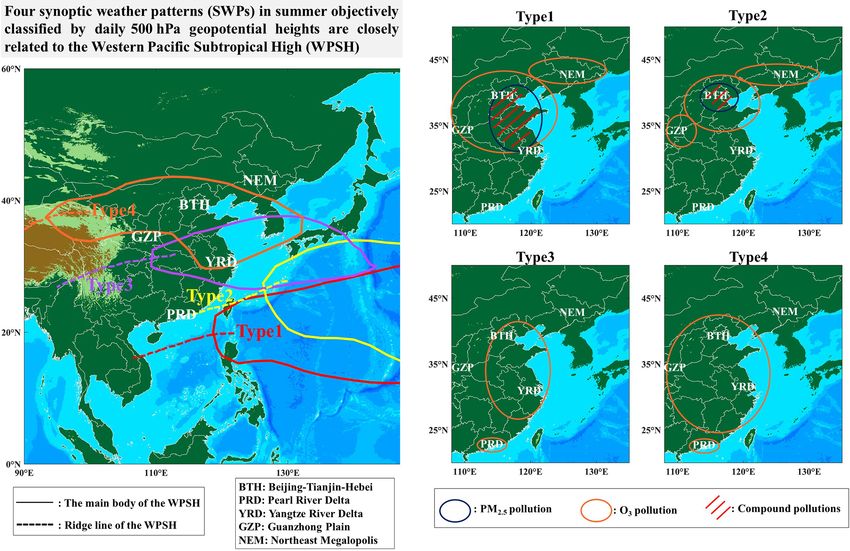
L. Zong et al.: Summertime O3 –PM2.5 compound pollution in eastern China                                                      9107

winds and strong elevated thermal inversion layer, along with       2   Data and methods
the local emissions of aerosols, play a decisive role in the
formation of heavy pollution in Beijing. The authors also           The air quality data, including PM2.5 , NO2 , O3 and
noted that southerly prevailing winds can transport pollutants      O3 -8 h, are from the national 24 h continuous air qual-
emitted from southern cities to Beijing. Zheng et al. (2015)        ity observations published by the China Environmen-
studied the relationship between regional pollution and the         tal Monitoring Station (http://www.cnemc.cn/, last access:
patterns of large-scale atmospheric circulation over eastern        7 June 2021). Summertime hourly data (2015–2018) for
China in October from 2001 to 2010 and identified six pol-          1174 stations were retrieved from an observational net-
lution types and three clean types. Specifically, weather pat-      work in eastern China (104–135◦ E, 17–53◦ N), which in-
terns such as a uniform surface pressure field in eastern China     cludes the more prominent pollution areas in the eastern
or a steady straight westerly in the middle troposphere, par-       urban agglomeration, such as the BTH (113.5–119.8◦ E,
ticularly when at the rear of an anticyclone at 850 hPa, were       36–42.6◦ N), YRD (115.3–122.6◦ E, 27.2–34.5◦ N), PRD
found to be typically responsible for heavy pollution events.       (112.5–113.7◦ E, 21.3–23.1◦ N), Guanzhong Plain (GZP
Many studies have suggested a modulating effect of the East         (104.6–112.2◦ E, 33.3–36.8◦ N)) and Northeast Megalopolis
Asian summer monsoon (EASM) and western Pacific sub-                (NEM (121.2–131.0◦ E, 39.8–47.3◦ N)) regions (the specific
tropical high (WPSH) on air quality over China (Li et al.,          locations of stations and urban agglomerations are shown in
2018; Yin et al., 2019; Zhao et al., 2010). In particular, Li       Fig. 1a). Surface meteorological data, such as Tmax , precip-
et al. (2018) applied RegCM4-CHEM to analyze the differ-            itation, WS and RH from 611 meteorological observation
ences in O3 between three strong and weak monsoon years             stations, along with 367 sounding profiles at 14:00 Beijing
and found that the concentrations of O3 over the central and        time (BJT) from 64 stations and 368/368 sounding profiles
eastern part of China were higher in strong EASM years than         at 08:00/20:00 BJT from 77 stations, respectively, in east-
in weak EASM years. The anomalous high-pressure system              ern China were obtained from the China National Meteoro-
at 500 hPa, associated with downward dry, hot air and intense       logical Information Center of the China Meteorological Ad-
solar radiation, can enhance the photochemical reactions to         ministration (http://data.cma.cn/site/index.html, last access:
elevate the production of tropospheric O3 (Gong and Liao,           7 June 2021). The BLH was calculated according to the
2019; Yin et al., 2019). Furthermore, Zhao and Wang (2017)          method given by Seidel et al. (2012) and Guo et al. (2016,
and Yin et al. (2019) noted that the positive GH anomalies          2019) (the detailed method can be seen in Text S1 of the Sup-
at high latitudes tended to significantly weaken the cold-air       plement) and the FLWD (frequency of light wind (< 2 m s−1 )
advection from the north, resulting in locally high temper-         days, which can be defined as the ratio between the number
atures near the surface in northern China, while the WPSH           of days with average daily WS lower than 2 m s−1 and the to-
could transport sufficient water vapor to the YRD region,           tal days of each pattern), precipitation frequency (PF, which
leading to a decrease in surface O3 . In addition, different sub-   can be defined as the ratio of the number of rainy days to total
regions can exhibit various distributions of pollutants, even       days under each pattern) and MDA8 O3 were also quantified.
with identical emission scenarios (Li et al., 2019; Saikawa            Additionally, for synoptic analysis of particulate mat-
et al., 2017; C. Zhang et al., 2019). Also, it is still unclear     ter and O3 pollution in summer, we use the GH field at
how the distribution of pollution responds locally to large-        500 hPa, wind and specific humidity field at 850 hPa from
scale atmospheric circulation patterns. Due to the variabil-        the NCEP/NCAR (National Centers for Environmental Pre-
ity of local meteorological conditions under various synoptic       diction/National Center for Atmospheric Research) daily re-
weather types and the modulation of the large-scale move-           analysis dataset (https://psl.noaa.gov/data/gridded/data.ncep.
ment of the WPSH (Li et al., 2018; Wang et al., 2019; Yang          reanalysis.html, last access: 7 June 2021) on a 2.5◦ lati-
et al., 2021; Zhao and Wang, 2017), the causes and conse-           tude × 2.5◦ -longitude grid during the study period. For fur-
quences of meteorological factors for the formation of com-         ther analysis of the modulation of the co-occurrence of O3 –
pound O3 –PM2.5 pollution could be complex. Overall, the            PM2.5 pollution by the boundary layer structure in some
mechanism by which the SWP modulates the characteristics            local areas, we also used the BLH, uv wind, vertical ve-
of O3 –PM2.5 compound pollution has yet to be comprehen-            locity, RH and temperature fields of the fifth generation
sively described.                                                   European Centre for Medium-Range Weather Forecasts re-
   In this study, the SWPs corresponding to the co-                 analysis (ERA5), which has a high spatiotemporal reso-
occurrence of O3 and PM2.5 pollution during summertime              lution (0.25◦ latitude × 0.25◦ longitude, hourly; https://psl.
were analyzed, with a focus on eastern China (104–135◦ E,           noaa.gov/data/gridded/data.ncep.reanalysis.html, last access:
17–53◦ N). Then, the synoptic causes of O3 –PM2.5 com-              7 June 2021).
pound pollution, as well as O3 -only pollution, from the per-          T-mode principal component analysis (T-PCA) is an ob-
spective of the objective classification of atmospheric circu-      jective mathematical computer-based method that can be
lation patterns were revealed. The findings are expected to         used to classify the synoptic circulation patterns of regional
provide a scientific reference for the monitoring, forecasting      gridded data in the troposphere at the lower level. Indeed, it
and evaluation of summertime air pollution in eastern China.        is commonly regarded as the most promising weather pat-

https://doi.org/10.5194/acp-21-9105-2021                                             Atmos. Chem. Phys., 21, 9105–9124, 2021

9108                                           L. Zong et al.: Summertime O3 –PM2.5 compound pollution in eastern China

Figure 1. Average concentration of MDA8 O3 (a) and PM2.5 (b) in eastern China during the summers of 2015–2018. Stations and key urban
clusters (black boxes) are shown in (a).

tern classification method at present (Huth et al., 2008).           of each pollution level are set according to their concentra-
Moreover, this approach has been widely used in studies              tion limits based on the Technical Regulation on Ambient
of aerosols and O3 pollution-related atmospheric circula-            Air Quality Index (on trial) (HJ633-2012) issued by the Min-
tion in China (Miao et al., 2017, 2019; Ning et al., 2018,           istry of Ecology and Environment of the People’s Republic
2019). The T-PCA analysis module of the COST733 soft-                of China (Table S1 in the Supplement).
ware (http://cost733.met.no/, last access: 7 June 2021) devel-          Finally, in order to be clear regarding the changes in O3
oped by the European Scientific and Technical Research Co-           and PM2.5 concentrations in the analysis of different weather
operation was used to classify the synoptic circulation pattern      types, we calculated the average distribution of O3 and PM2.5
based on the 500 hPa GH field. The COST733class program              as well as the meteorological conditions for each type. Plus,
is a FORTRAN software package consisting of several mod-             the anomalous distribution of these variables (i.e., the aver-
ules for classification, evaluation and comparison of weather        age of O3 and PM2.5 and the average of the meteorological
and circulation patterns. First, the weather data are spatially      conditions under the respective patterns minus the average
standardized and split into 10 subsets by T-PCA. Then, the           during the summertime of 2015–2018) were given as well.
principal components (PCs) of weather information are esti-          The statistical significance was tested with a 0.05 confidence
mated by applying singular value decomposition and the PC            level via analysis of variance, which enabled us to distinguish
score for each subset can be calculated after oblique rotation.      the significant differences of spatial distribution characteris-
Finally, the resultant subset with the highest sum will be se-       tics between O3 and PM2.5 pollution under four SWPs.
lected by comparing 10 subsets according to contingency ta-
bles and its type can be outputted as well (Miao et al., 2017;
Philipp et al., 2014). To assess the performance of synop-           3     Results
tic classification and determine the number of classes, the
explained cluster variance (ECV) was selected in this study          3.1    Spatial and temporal distribution of O3 and PM2.5
(Hoffmann and Schlünzen, 2013; Ning et al., 2019; Philipp                   during summer 2015–2018
et al., 2014). Detailed information about the ECV method is
provided in the Supplement.                                          Figure 1 shows the summer-averaged MDA8 O3 and PM2.5
   Based on the Ambient Air Quality Standards (GB3095-               concentrations at 1174 stations in the eastern region of
2012) issued by the Ministry of Ecology and Environment              China for the period 2015–2018. Among these stations, the
of the People’s Republic of China, O3 (PM2.5 ) pollution oc-         MDA8 O3 concentration at most stations (795/1174) ex-
curs when the MDA8 O3 (PM2.5 24-h) concentration exceeds             ceeded 100 µg m−3 , of which 45 sites exceeded 160 µg m−3 .
160 (75) µg m−3 . For a particular region, when haze occurs at       The highest O3 pollution was found in Zibo, Shandong,
more than 50 % of the observed sites, the day can be defined         with a value of 181.5 µg m−3 . The average PM2.5 at most
as a haze day (Chen and Wang, 2015). In this study, we char-         sites (844/1174) was below 35 µg m−3 , while it reached
acterized regional pollution days as occurring when the aver-        62.6 µg m−3 in Handan, Hebei Province. On the whole, the
age values of more than 50 % of sites in this region exceeded        MDA8 O3 and PM2.5 in the BTH region and its surround-
the aforementioned thresholds. The specific standard limits          ing areas was significantly higher than in other regions. In

Atmos. Chem. Phys., 21, 9105–9124, 2021                                                https://doi.org/10.5194/acp-21-9105-2021
L. Zong et al.: Summertime O3 –PM2.5 compound pollution in eastern China                                                   9109

addition, the level of O3 in some urban clusters, such as the      at the periphery of an anomalously enhanced WPSH, along
PRD, YRD, GZP and NEM regions, was particularly higher             with the transportation of warm and humid air from the ocean
than that of the surroundings, and thus we focus on analyzing      to East Asia, might also be responsible for the asymmet-
these key areas later in the paper.                                ric spatial distribution of ground-level O3 (i.e., a decrease
   Figures 2 and 3 show the daily variations in pollution lev-     in southern China but an increase over northern China, Zhao
els of O3 and PM2.5 , respectively. In recent years, the re-       and Wang, 2017).
duced visibility of haze days has weakened the solar radi-            Therefore, we used the T-PCA method to objectively clas-
ation reaching the ground and inhibited photochemical re-          sify the weather circulation of the 500 hPa GH field in the
actions from generating O3 (Li et al., 2019; Zhang et al.,         summers of 2015–2018, from which we ultimately obtained
2015). As a result, the concentration of O3 has continued          four SWPs related to the movement and development of the
to increase with the mitigation of PM2.5 pollution. During         WPSH (Wang et al., 2019; Yang et al., 2021). The western
the study period, the number of days of O3 pollution in the        ridge point and northern boundary of the WPSH at 500 hPa in
BTH, YRD, PRD, GZP and NEM regions was 254, 133, 84,               Type 1 were located at around 120◦ E and 30◦ N, respectively
165 and 96, respectively, while the number of days of PM2.5        (Fig. 4a and Table S2 in the Supplement). The southwestern
pollution was only 93, 8, 0, 2 and 1, of which compound            flow of this WPSH was able to transport water vapor to the
pollution occurred on 76, 7, 0, 2 and 0 d according to Chi-        YRD region, resulting in a southwestward prevailing wind
nese standards (the asterisks in Fig. 3 indicate the compound      across the YRD region and westward flow from the north of
pollution events). China has implemented strict policies for       the WPSH, forming a convergence area at 850 hPa. These
emission control, and the effects of these policies have been      conditions were also associated with high temperature and
remarkable. However, despite a decrease in PM2.5 in the last       humidity during the summer in the Meiyu season, which is a
five years, there has also been an increase in O3 pollution        climate phenomenon characterized by continuous cloudy and
over China (Fan et al., 2020; Sun et al., 2016); “double-          rainy days that generally occurs during June and July every
high” pollution reported on the weather scale has reduced. As      year across the middle and lower reaches of the Yangtze river,
the limit of PM2.5 concentration for pollution control is rela-    Taiwan in China, central and southern Japan, and southern
tively relaxed in China, previous studies have tended to refer     Korea. For Type 2, the westerly trough was able to deepen
to the interim target 1 (IT-1) of the World Health Organiza-       as the WPSH shifted northwards slightly from Type 1 or re-
tion (WHO) as the standard threshold. Our study pushed for-        treated southeast from Type 3 (Fig. 4b). The southwest wind
ward to the next stage, i.e., we used the WHO’s IT-2 thresh-       from the South China Sea might have combined with the
old (24 h average concentration of PM2.5 of 35 µg m−3 ) as         southerly wind in the eastern periphery of the WPSH. As a
our target limit to count the number of compound pollution         result, southerly winds prevailed across southeastern China,
days across each region. Based on this target, the number          while northern China was mainly controlled by the westerly
of pollution days for the five urban clusters was 194, 52,         trough. In comparison to Type 2, Type 3 was characterized
16, 47 and 20, respectively (Fig. 3). These results indicate       by the boundary of the WPSH being at a higher latitude with
that despite PM2.5 reductions, compound pollution events re-       a westward extension (Fig. 4c), disintegrating a closed high-
main serious and deserving of public attention. Overall, the       pressure monomer along the eastern coast of China, and the
O3 and PM2.5 concentrations in eastern China exhibit dis-          main body of the WPSH remained over the ocean (Figs. 4c
tinct intra-seasonal and interannual variations, indicating that   and S4 in the Supplement). This led to a condition that was
aside from the changes in emission sources (because it is con-     completely controlled by the monomer of the WPSH over the
sidered that inter-seasonal and short-term changes in emis-        YRD region, resulting in hot and dry weather at the end the
sion sources are not significant), they may also be regulated      rainy season at the beginning of mid-summer. Figure 4d in-
by meteorological conditions, which is further analyzed be-        dicates that the location of the WPSH monomer was more to
low.                                                               the west and north compared with under the other SWPs, thus
                                                                   controlling northern China for a long time; the western ridge
3.2   Objective classification of large-scale SWPs in              point was located at around 95◦ E and the northern boundary
      summer                                                       at around 40◦ N.
                                                                      Figure 5 presents the daily and annual variations of the
To analyze the effect of meteorological conditions on the          SWPs in the summers of 2015–2018. Usually, the advance-
changes in O3 and PM2.5 concentrations, it is necessary to         ment of the WPSH in eastern China occurs in June and July,
statistically analyze the large-scale weather circulation situa-   while its gradual withdrawal occurs mainly in August; in this
tion in summer. Existing studies have shown that the WPSH          respect, Type 1 and Type 2 represented normal WPSH char-
(500 hPa GH field with obvious anticyclonic characteristics        acteristics during early and late summer. Type 3 and Type 4,
and downward flow around the center) in summer promi-              however, reflected a split of the WPSH, which mainly oc-
nently regulates the weather and climate of East Asia (Lu,         curred in late summer. Consequently, there were 167, 117,
2002), owing to its varying location, shape and intensity          52 and 32 d for Type 1, Type 2, Type 3 and Type 4 over
(Ding, 1994). Low-level southerly monsoonal flow forming           the study period, respectively. Since the WPSH’s movement

https://doi.org/10.5194/acp-21-9105-2021                                           Atmos. Chem. Phys., 21, 9105–9124, 2021
9110                                            L. Zong et al.: Summertime O3 –PM2.5 compound pollution in eastern China

Figure 2. Time series of MDA8 O3 pollution levels in key urban clusters.

Figure 3. Time series of PM2.5 pollution levels in key urban clusters. Black dots indicate the compound events. Asterisks indicate the
compound events under the Chinese standard (WHO interim target 1; IT-1) and the circles indicate the compound events under WHO IT-2.

Atmos. Chem. Phys., 21, 9105–9124, 2021                                                https://doi.org/10.5194/acp-21-9105-2021
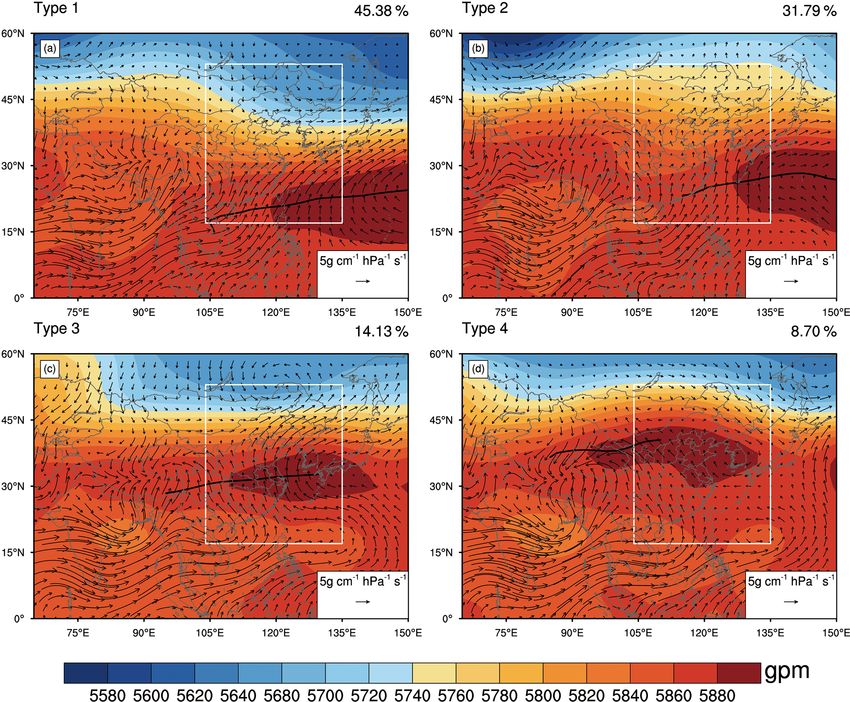
L. Zong et al.: Summertime O3 –PM2.5 compound pollution in eastern China                                                                9111

Figure 4. 850 hPa water vapor flux (WVF = V · q/g, where q is specific humidity, g is gravitational acceleration and V is horizonal wind;
vectors indicate WVF; see scale arrow in the bottom right in units of 5 g cm−1 hPa−1 s−1 ) and 500 hPa GH (contours indicate GH; see scale
bar at bottom in units of gpm) patterns based on objective classification (see text for details). The white framed area is the area of eastern
China, the number in the upper-right corner of each panel indicates the frequency of occurrence of each pattern type and the black line in
each panel presents the ridge axis of the WPSH.

is generally affected by the weather phenomena of its sur-               modulate the weather as well as climatic and environmental
rounding climatic systems (such as typhoons and the Ti-                  changes in eastern China.
betan high) (Ge et al., 2019; Liu and You, 2020; Shu et al.,
2016; Wang et al., 2019), it may have resulted in a short-               3.3     O3 and PM2.5 pollution characteristics under the
term southward retreat during the advancement of the WPSH                        four SWPs
(e.g., around 10 August 2018) and a short-term northward ad-
vancement during its process of retreat (e.g., 21 and 29 Au-             3.3.1    Spatial characteristics
gust 2016). For instance, tropical storm NEPARTAK gener-
ated at 00:00 UTC (08:00 BJT) 3 July 2016 over the western               We calculated the averaged (Fig. S6 in the Supplement) and
North Pacific and upgraded to a super typhoon at 12:00 UTC               anomalous (Fig. 6) spatial distributions of the MDA8 of O3
(20:00 BJT) 5 July 2016 (Fig. S5 in the Supplement; see also             and PM2.5 under the four SWPs. The O3 concentration was
Su et al., 2017). Due to the rapid movement of NEPAR-                    relatively high in the area north of the Yangtze River under
TAK to the northwest, the WPSH quickly decomposed to a                   Type 1 and the high values of MDA8 O3 were mainly con-
monomer and moved north. With the strengthening and land-                centrated in the North China Plain (NCP) region, with a to-
ing of the typhoon, the monomer gradually collapsed. The                 tal of 100 stations surpassing 160 µg m−3 . Type 2 O3 pollu-
SWP also underwent a transition from Type 2 to Type 4 and                tion was slightly weaker than that for Type 1, and the MDA8
then to Type 1 (Figs. 4 and S5 in the Supplement). In gen-               O3 at the 72 sites exceeded 160 µg m−3 . The O3 high-value
eral, the WPSH is able to provide evidence of intra-seasonal             areas lay mainly in the NCP, GZP and YRD regions un-
and interannual changes over China, which will inevitably                der Type 4, and there were 37 stations with concentrations

https://doi.org/10.5194/acp-21-9105-2021                                                    Atmos. Chem. Phys., 21, 9105–9124, 2021
9112                                              L. Zong et al.: Summertime O3 –PM2.5 compound pollution in eastern China

Figure 5. Time series of synoptic circulation patterns.

larger than 160 µg m−3 . Of the four SWPs, the lowest overall       the GZP region, the O3 pollution frequency was higher un-
MDA8 O3 occurred under Type 3, with only one site exceed-           der Type 2 and Type 4, and PM2.5 pollution occurred more
ing 160 µg m−3 (Fig. S6a–d in the Supplement). It was also          frequently under Type 2; and (5) in the NEM region, O3 pol-
found that the regions that experienced significant positive        lution was always found under Type 1, Type 2 and Type 4,
deviations of MDA8 O3 from the summer mean were as fol-             but the over-limit rate was no more than 15 % and PM2.5 pol-
lows: the BTH, YRD and NEM regions under Type 1; the                lution under Type 1 was more than under Type 2.
BTH and GZP regions under Type 2; the central of the YRD               In summary, Type 1 was prone to the formation of O3 –
and PRD regions under Type 3; and the YRD, GZP and PRD              PM2.5 compound pollution (that is, when the ground MDA8
regions under Type 4 (Fig. 6a–d).                                   O3 concentration exceeded 160 µg m−3 , the PM2.5 concen-
   Analogously, Fig. 6e–h shows the anomaly and signifi-            tration also exceeded 75 µg m−3 ) in the area from the BTH
cance of difference in PM2.5 under the four weather types,          to northern YRD regions (Fig. S6 in the Supplement), which
presented as positive anomalies in the south of the BTH and         can be denoted as “BTH–NYRD O3 –PM2.5 compound pollu-
YRD regions under Type 1, in the BTH, GZP and PRD re-               tion”. In detail, Fig. S8 in the Supplement shows the number
gions under Type 2, and in the GZP and PRD regions under            and probability of occurrence of compound pollution days
Type 4. Due to the obvious seasonal variations of PM2.5 con-        at each site in summer during 2015–2018, indicating that a
centration (higher in winter and lower in summer) (H. Liu           high occurrence probability (maximum values approaching
et al., 2019; Miao et al., 2015), no site exceeded 75 µg m−3        46.7 %) of compound pollution appeared over the NCP (to
for the averaged PM2.5 concentration. Even so, the level of         the north of 32◦ N) and that approximately 55.6 % of com-
PM2.5 in the BTH region was still significantly higher un-          pound pollution occurrence days at all sites occurred un-
der the four types than that for other urban agglomerations         der Type 1. Similarly, Type 2 can also be denoted as “BTH
(Fig. S6e–h in the Supplement).                                     O3 –PM2.5 compound pollution”, with compound pollution
                                                                    occurrence days accounting for 33.8 %, Type 3 as “BTH–
3.3.2   Pollution pattern differences in key areas                  YRD–PRD O3 -only pollution” and Type 4 as “BTH–GZP–
                                                                    YRD–PRD O3 -only pollution” (Fig. 12).
Air pollution is principally found in dense urban areas such
as the BTH and YRD regions (Gui et al., 2019; Han et al.,           3.4   Analysis of local meteorological factors
2019), so we took the BTH, PRD, YRD, GZP and NEM re-
gions in the eastern region as key areas, counted the daily         To explore the meteorological causes of O3 and PM2.5 pollu-
anomalies and average variation of O3 and PM2.5 in each             tion, we analyzed the distribution of the average and anoma-
key region under the different weather patterns (Figs. 7 and        lies for Tmax , RH, PF, BLH and FLWD under the four SWPs
S7 in the Supplement) and calculated the over-limit ratio in        (Figs. 8 and 9; Figs. S9 and S10 in the Supplement). Under
those key regions via the “stations × days” statistics (see         the influence of the EASM, over 80 % of the stations expe-
Table 1). The diurnal variation of O3 was more obvious,             rienced high temperatures (Tmax > 27◦ ) under each SWP, al-
peaking at about 15:00 BJT, while contrasting diurnal vari-         though the anomaly of Tmax under Type 1 (early summer)
ations of PM2.5 were found for different regions. According         presented as negative (Fig. 8a). Type 1 was characterized by
to Fig. 7 and Table 1, the following characteristics could be       humid conditions in the southern area and dry conditions in
identified for different urban clusters: (1) in the BTH region,     the northern region owing to an extensive southwestern flow
the O3 concentrations of Type 1 and Type 2 were relatively          of the WPSH, resulting in a rain belt found in southeastern
high with their over-limit rates reaching 47.1 % and 54.2 %         coastal areas such as the PRD and YRD regions. Type 2 was
and the PM2.5 pollution rates reaching 18.8 % and 16.3 %,           associated with meridional flow and dry and wet anomalies in
respectively; (2) in the PRD region, the over-limit rates and       northern China, resulting in a rain band located over the cen-
concentrations of O3 and PM2.5 were similar under the four          tral areas between the BTH and YRD regions owing to the
SWPs; (3) in the YRD region, the O3 pollution over-limit rate       northern advancement of the WPSH compared with Type 1.
presents as Type 1 > Type 4 > Type 2 > Type 3, PM2.5 pol-           Furthermore, there was higher RH for most of the study sites
lution largely appeared under Type 1, and both O3 and PM2.5         under Type 3 and Type 4, possibly because of the shifted
under Type 1 were higher than those for the other types; (4) in     rain belt in the BTH and NEM regions under Type 3 once

Atmos. Chem. Phys., 21, 9105–9124, 2021                                              https://doi.org/10.5194/acp-21-9105-2021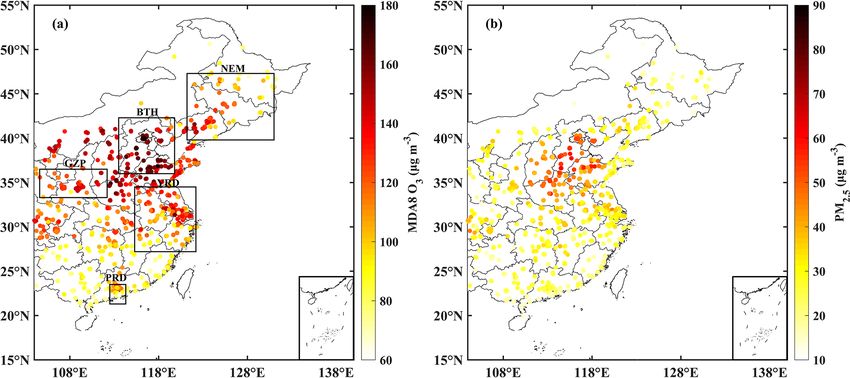
Table 1. Over-limit ratio and concentration of MDA8 O3 and PM2.5 calculated via “stations × days” statistics in key urban clusters under four SWPs.

                                            Urban     Month                          Type 1                                              Type 2                                               Type 3                                              Type 4
                                            cluster
                                                               Stas × days       MDA O3               PM2.5          Stas × days      MDA O3               PM2.5          Stas × days      MDA O3               PM2.5          Stas × days      MDAO3             PM2.5
                                                                                 OLR      Con       OLR       Con                    OLR      Con        OLR       Con                    OLR      Con        OLR       Con                    OLR      Con     OLR       Con
                                            BTH            6          6416    57.30 %    172.5   16.70 %      49.2          122    91.80 %   209.6      3.30 %      46            59    62.70 %     176     32.20 %     67.1            0         0        0       0        0
                                                           7          1716    25.60 %    134.2   21.20 %      51.8         3681    54.20 %   165.6     22.50 %     56.9         1356    33.80 %   141.8     12.90 %     46.7          577    43.50 %   153.7   8.80 %   49.5

https://doi.org/10.5194/acp-21-9105-2021
                                                           8          1188    18.90 %    118.5     6.90 %     33.1         2805    35.30 %   143.1     14.70 %      44          1671    18.90 %   121.2     10.10 %     42.5         1268    31.90 %   144.3   6.00 %   39.7
                                                         6–8          9320    46.60 %    158.6   16.30 %      47.6          365    54.20 %   169.8     18.80 %     51.2         3086    26.30 %   131.3     11.70 %     44.8         1845    35.50 %   147.3   6.90 %   42.8
                                            YRD            6        19329     26.20 %    127.2     4.40 %     36.8        11098    14.30 %     107      2.20 %     44.5          181    12.70 %   102.4      0.60 %      32             0         0        0       0        0
                                                           7          5207    24.50 %    119.8     5.30 %     38.6         8459    22.00 %   120.1      0.60 %      28          4135    14.50 %   112.6      0.10 %      24          1743    30.90 %   139.5   0.30 %      30
                                                           8          3593    25.50 %    127.6     0.30 %     28.6        19922    18.30 %   113.8      3.00 %     33.3         4993    16.90 %   116.7      0.00 %     23.7         3817    14.70 %   114.8   0.10 %   25.1
                                                         6–8        28129     25.80 %    125.9     4.00 %     36.1        13754    17.40 %   112.5      1.70 %     30.6         9309    15.80 %   114.6      0.10 %      24          5560    19.70 %   122.5   0.10 %   26.7
                                            PRD            6          5327     5.20 %     80.1          0     16.8          101    31.70 %   146.9          0      24.9           48         0     77.6          0      13.2            0         0        0       0        0
                                                           7          1431    20.30 %    107.2     0.60 %     25.3         3076     7.60 %    81.8      0.10 %     19.1         1079    13.30 %    92.4          0      19.3          461     8.00 %    82.1       0    17.9
                                                           8           977    25.40 %    122.5     1.10 %     27.9         2316    20.60 %   108.5      0.60 %      28          1376    15.50 %   103.4      0.30 %      24           993    17.90 %   111.4   0.10 %   25.1
                                                         6–8          7735    10.50 %     90.5     0.20 %     19.8         5493    13.50 %    94.3      0.30 %      23          2503    14.30 %    98.2      0.20 %     21.8         1454    14.80 %   102.1   0.10 %   22.8
                                            GZP            6          1549    42.90 %    147.6     0.40 %     33.2           38    52.60 %   165.3          0      30.4           19    26.30 %   150.8          0      34.7            0         0        0       0        0
                                                           7          1879    40.70 %     145      1.90 %     33.7         1168    47.40 %   160.3          0      30.2          432    24.30 %   133.3      1.20 %     31.7          173    26.60 %   144.1       0    26.4
                                                                                                                                                                                                                                                                                L. Zong et al.: Summertime O3 –PM2.5 compound pollution in eastern China

                                                           8           537    28.50 %     134      1.60 %     31.6          850    36.80 %   146.3      1.60 %     34.2          530    28.90 %   143.1      1.90 %     37.2          394    38.60 %   154.9   1.30 %   39.9
                                                         6–8           368    15.20 %    112.9     0.90 %     32.4         2056    43.10 %   154.6      2.10 %     35.9          981    26.80 %   138.9      1.50 %     34.7          567    34.90 %   151.6   0.90 %   35.8
                                            NEM            6        13126     17.90 %     121      1.70 %     26.4          243    64.20 %   175.3      0.40 %     31.1          120    13.30 %   123.3      0.80 %     37.6            0         0        0       0        0
                                                           7          3422     8.90 %    106.8     2.30 %     25.2         7338    17.00 %   120.7      1.30 %     28.1         2722     5.70 %        93    0.70 %     20.8         1141    15.10 %   122.4   0.20 %   24.3
                                                           8          2341     4.40 %     92.6     1.00 %     20.1         5520     6.30 %        91    1.30 %      21          3282     5.60 %    98.3      0.90 %     23.2         2507     7.80 %    97.8   0.20 %   19.5
                                                         6–8        18889     14.60 %    114.9     1.70 %     25.4        13101    13.40 %   109.2      1.30 %     25.2         6124     5.80 %    96.4      0.80 %     22.4         3648    10.10 %   105.5   0.20 %      21

                                           Stas × days = stations × days. OLR = over-limit ratio. Con = concentration (µg m−3 ).

Atmos. Chem. Phys., 21, 9105–9124, 2021
                                                                                                                                                                                                                                                                                       9113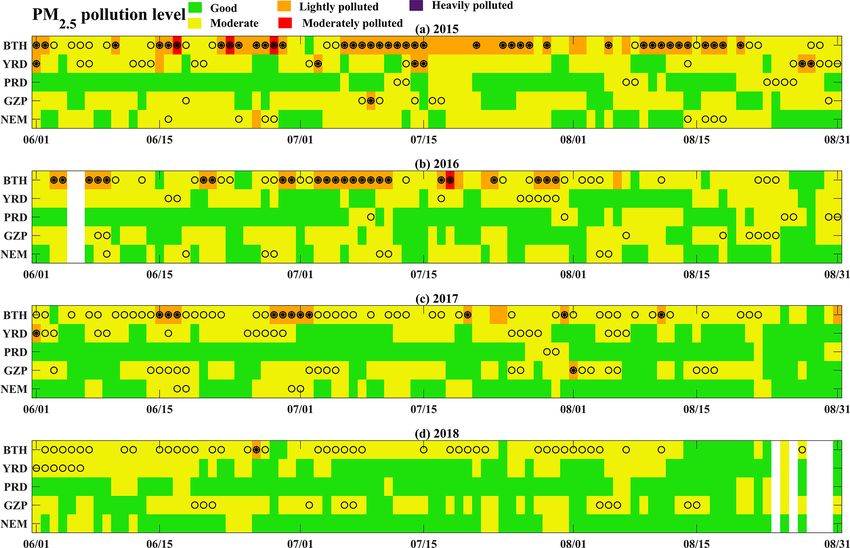
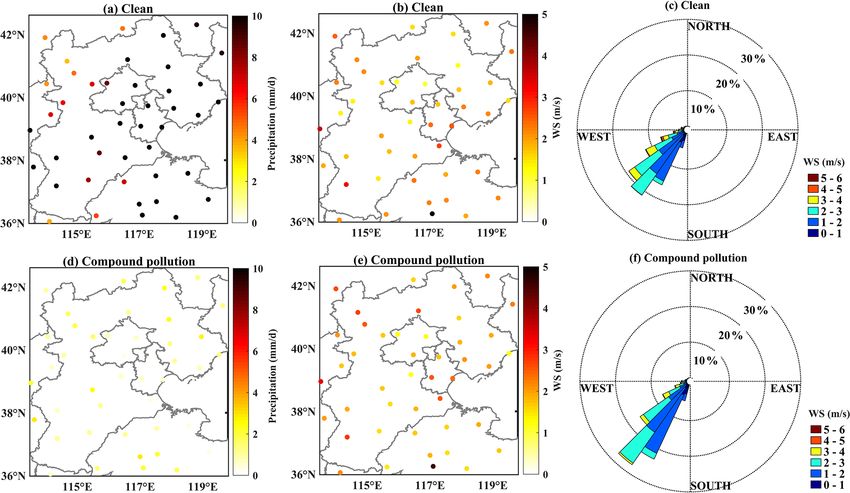
9114                                            L. Zong et al.: Summertime O3 –PM2.5 compound pollution in eastern China

Figure 6. The MDA8 O3 (a–d) and PM2.5 (e–h) anomaly under the four SWPs, where the sites marked with a “+” indicate that the analysis
of variance passed the significance level of 0.05.

Figure 7. Daily variations of O3 and PM2.5 anomalies under the four SWPs in key urban clusters.

the northern boundary of the WPSH reached 37.5◦ N, and                opposite was true under Type 1 (Fig. 8e–h). PF was charac-
an occurrence of heavy precipitation across the western PRD           terized by positive anomalies in the area south of the Yangtze
region as well as central areas between the BTH and YRD               River under Type 1, in the YRD region under Type 2, in the
regions under Type 4 (Fig. S9 in the Supplement).                     BTH and NEM regions under Type 3, and in the area between
   In terms of their anomalous spatial distributions, the pos-        the BTH and YRD regions under Type 4 (Fig. 8i–l). As can
itive anomalies of Tmax were located in the southern region           be seen from Fig. 9, when the BLH at 14:00 BJT had a pos-
under Type 3 and most of the eastern region under Type 4;             itive anomaly, the contrary FLWD had a negative anomaly
since Type 1 always appeared in early summer, most areas              (e.g., BTH in Type 1), which indicates that the higher the
were negative (Fig. 8a–d). For RH, Types 2, 3 and 4 were              BLH and lower the FLWD, the more conducive it was to the
negative for the south and positive in the north, while the           diffusion of pollutants; conversely, a lower BLH and higher

Atmos. Chem. Phys., 21, 9105–9124, 2021                                                 https://doi.org/10.5194/acp-21-9105-2021
L. Zong et al.: Summertime O3 –PM2.5 compound pollution in eastern China                                                     9115

Figure 8. As in Fig. 6 but for Tmax (a–d), RH (e–h) and PF (i–l). The black solid line presents the rain belt of each SWP.

https://doi.org/10.5194/acp-21-9105-2021                                                   Atmos. Chem. Phys., 21, 9105–9124, 2021
9116                                          L. Zong et al.: Summertime O3 –PM2.5 compound pollution in eastern China

FLWD (such as BTH under Type 2) did not support the diffu-        4   Discussion
sion of pollutants. After further inspection of Fig. S10 in the
Supplement, we found that the YRD region under Type 1,            In the last section, we discussed how the SWPs and local me-
the YRD under Type 2, and the BTH and PRD regions under           teorological factors modified the summertime O3 and PM2.5
Type 3 and 4 had shallow BLHs and high FLWDs, which was           pollution. However, how did the boundary layer structure in-
detrimental to the transportation of pollution in these areas,    teract with the co-occurrence of O3 and PM2.5 pollution? To
thus corresponding to high levels of pollution under these        address this question, we conducted some further analysis as
weather patterns. However, there was also more serious pol-       follows. As mentioned, the co-occurrence of O3 and PM2.5
lution in some higher BLH areas, such as in the BTH region        pollution mainly took place in the BTH–NYRD areas un-
under Type 1, which we discuss next.                              der Type 1 and in the BTH area under Type 2. Lower WS
                                                                  and its negative anomalies at a lower boundary layer over
3.5    Potential implications of NO2                              the BTH–NYRD under Type 1 and over the BTH area under
                                                                  Type 2 may not have enhanced the diffusion of air pollutants
The photochemical production of O3 mainly involves emis-          (Fig. S11 in the Supplement). In contrast, the moderate RH
sions of volatile organic compounds and NOx from anthro-          and its negative anomalies might have favored the formation
pogenic, biogenic and biomass burning sources (Deng et al.,       of compound pollution. Downward vertical motion and neg-
2019; Gvozdić et al., 2011; Sillman, 2002). The photochem-       ative anomalies might also have stabilized the atmospheric
ical reaction of NO, NO2 and O3 in the troposphere forms a        characteristic of the boundary layer (Fig. S12 in the Sup-
closed system (Yu et al., 2020), and this photochemical cy-       plement). Furthermore, we summarized the boundary layer
cle of NOx and O3 is the basis of photochemical processes in      structure, precipitation and ground-level wind flow across the
the troposphere. Oxidant (OX, OX = O3 + NO2 ), a conserva-        BTH region. Based on their characteristics, we separately de-
tive quantity over short timescales, is defined as a parameter    fined Type 1 and Type 2 into clean (the concentrations of both
to evaluate the photochemical processes and, due to the un-       O3 and PM2.5 were less than the level of pollution) and com-
stable nature of NO, it can quickly react with the equivalent     pound pollution periods (Figs. 11–13). It can be clearly seen
amount of O3 to generate NO2 (Kley et al., 1994). In order        that various precipitation events primarily caused differences
to compare the photochemical reaction efficiency of the five      in concentrations of both O3 and PM2.5 between clean and
urban clusters under the different SWPs, Fig. 10 presents the     pollution days under Type 1/Type 2 (see Figs. 12–13). In par-
daily variations of NO2 and OX. As we can see, the daily          ticular, Type 1 had significantly warmer temperatures over
variations of NO2 showed two peaks during a day, includ-          the boundary layer during the compound pollution periods
ing a first peak in the morning and a second peak associ-         of the BTH region, as compared with the clean periods. The
ated with traffic emissions in the evening (Xie et al., 2016;     daytime BLH under the compound pollution condition was
Yu et al., 2020). As we found the lowest point of NO2 at          also higher than that under the clean condition. In addition,
15:00 BJT and since NO2 can be photolyzed to produce O3           there were different directions of prevailing winds during the
during the day, we assumed that this particular time was the      two periods. The prevailing southerly winds during the com-
peak time for O3 formation across the study areas. As NO2         pound pollution period may have driven the transportation of
is consumed through a photochemical reaction with the in-         air pollutants from the southern NCP, resulting in more seri-
volvement of other precursors to produce a large amount of        ous pollution (Fig. 11), which is consistent with the results
O3 , OX can form a peak in the afternoon. In particular, abun-    of Miao et al. (2017, 2019). Miao et al. (2020) also proposed
dant sunlight in summer is beneficial to the photochemical        another mechanism – that is, the synoptic southerly warm
reaction process, but since most parts of eastern China are       advections at the top of planetary boundary layer (PBL) can
under a subtropical climate with the same period of rain and      strengthen the elevated thermal inversion layer and suppress
heat, the existence of the rainy season will inevitably inhibit   the development of the PBL, causing worse pollution. Co-
the summertime photochemical process. Under the different         influenced by the topographical effect of the northern moun-
SWPs, the photochemical reaction over each area bore an ob-       tainous areas and the boundary layer structure, air pollutants
vious relationship with the rain belt. For example, the rainy     could be trapped in the BTH region. In comparison, although
season in the BTH and NEM areas mainly occurred under             there was a southerly prevailing wind in the BTH region
Type 3 and the OX of Type 3 in this area was significantly        (Figs. 11 and 13), the rain belt under Type 2 being located in
lower than under the other SWPs.                                  the southern area of the BTH might have led to the potential
                                                                  removal of PM2.5 over this area (Fig. 9j), so the pollutants
                                                                  transported from the southern NCP would be partially re-
                                                                  duced. Therefore, we can conclude that the emissions of local
                                                                  pollutants accompanied by unfavorable meteorological con-
                                                                  ditions will continuously accumulate pollutants (Figs. 12–13;
                                                                  Gui et al., 2019; Zhang et al., 2020), which should be main
                                                                  cause of the BTH compound pollution. In summary, the dif-

Atmos. Chem. Phys., 21, 9105–9124, 2021                                            https://doi.org/10.5194/acp-21-9105-2021
L. Zong et al.: Summertime O3 –PM2.5 compound pollution in eastern China 9117
Figure 9. As in Fig. 6 but for the BLH at 14:00 BJT (a–d) and FLWD (e–h).
Figure 10. Daily variations of NO2 (a–e) and OX (f–j) under four SWPs in key urban clusters.
ferent SWPs modulated the regional variability of summer- lution (Fig. 14). In addition, the prevailing southerly
time O3 and PM2.5 via changes to the local meteorological winds in the boundary layer were able to transport the
conditions as follows: pollutants emitted from southern cities to the BTH, at-
1. Type 1: Under the conditions of high temperatures mospheric stratification was stable when the air mass
(Tmax > 27◦ ), moderate humidity (RH ∼ 60 %) and low was sinking (Miao et al., 2019; Figs. 11 and S12 in
PF, photochemical reactions were greatly promoted the Supplement) and compound pollution may have
to cause severe O3 pollution. Meanwhile, the BTH– been especially severe. Although a relatively high BLH
NYRD areas were located in front of the westerly occurred in the BTH region, the prevailing southerly
trough, under the influence of the warm and humid air of winds in the boundary layer served to further increase
the WPSH, and so the hygroscopic growth of fine par- the pollution.
ticulates potentially caused a certain amount of PM2.5
pollution (Li et al., 2017; Zhang et al., 2016), even- 2. Type 2: O3 pollution was severe under the meteorologi-
tually becoming becoming O3 –PM2.5 compound pol- cal conditions of high temperatures, moderate humidity
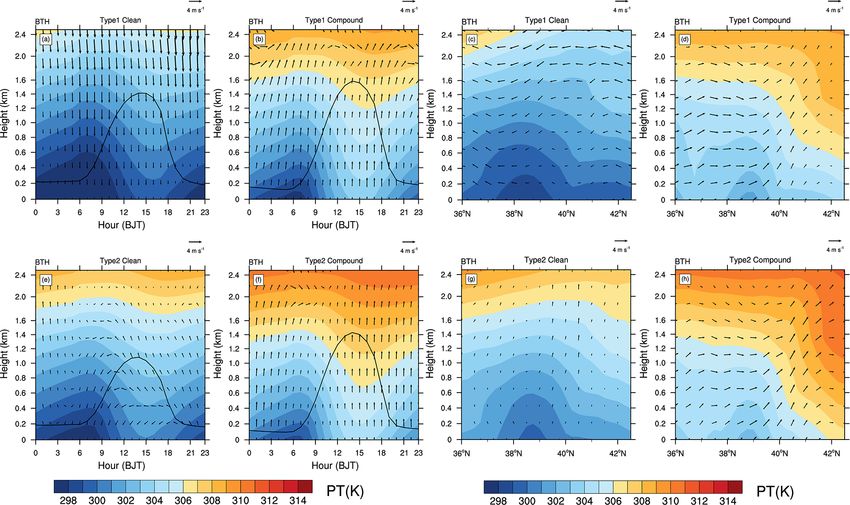
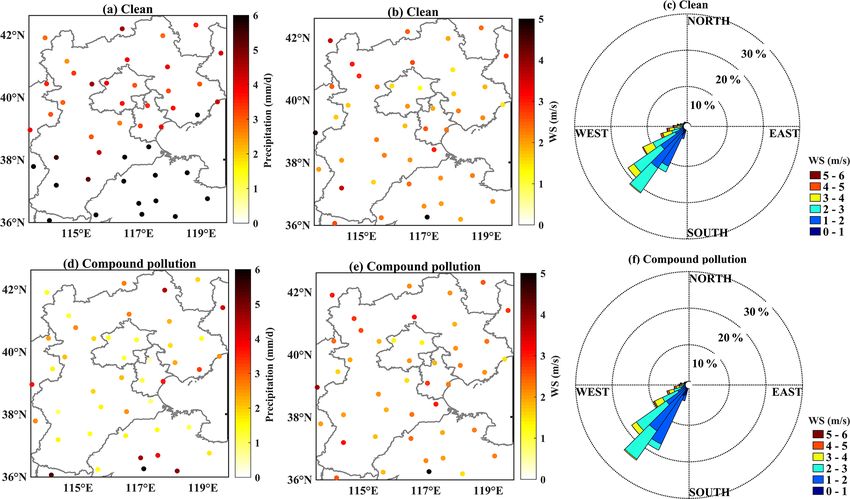
https://doi.org/10.5194/acp-21-9105-2021 Atmos. Chem. Phys., 21, 9105–9124, 20219118 L. Zong et al.: Summertime O3 –PM2.5 compound pollution in eastern China Figure 11. Daily variations of horizonal wind, potential temperature and BLH in the BTH area during clean and compound pollution periods under Type 1 and Type 2 (a, b, e, f). The vertical cross section of u wind, w wind and potential temperature for the same situation in the BTH region (c, d, g, h). The w wind is multiplied by 100 when used. The data are from ERA5 reanalysis. Figure 12. Precipitation, WS and WD during clean and compound pollution periods under Type 1 over BTH. Atmos. Chem. Phys., 21, 9105–9124, 2021 https://doi.org/10.5194/acp-21-9105-2021
L. Zong et al.: Summertime O3 –PM2.5 compound pollution in eastern China                                                    9119

     and weak precipitation. The PM2.5 in the BTH region,          5   Conclusions
     which was located in front of the westerly trough, was
     high since the shallow boundary layer and low wind            In this study, T-PCA, an objective classification method, was
     frequency were unfavorable for the diffusion of pol-          applied to classify the 500 hPa weather circulation pattern
     lutants. Therefore, O3 –PM2.5 compound pollution was          into four SWPs in the summers of 2015–2018. It was found
     also rather frequent (Fig. 14).                               that these four SWPs were closely related to the development
                                                                   of the WPSH. The spatial and temporal distribution charac-
 3. Type 3: High temperatures, low humidity and weak pre-          teristics of O3 and PM2.5 pollution in eastern China under
    cipitation over the YRD region tended to generate a            the four SWPs were analyzed to regulate and differentiate
    large amount of O3 , while the positive BLH and neg-           O3 and PM2.5 pollution in key areas. We found two synop-
    ative FLWD anomalies were unfavorable to O3 accu-              tic patterns were prone to leading to the co-occurrence of
    mulation. On the other hand, summer typhoon activi-            O3 and PM2.5 pollution: in BTH–NYRD areas under Type 1
    ties might have weakened the WPSH intensity over the           and in the BTH area under Type 2, which were associated
    YRD region, leading to the eastward retreat and north-         with double-high levels of O3 and PM2.5 . The probabilities
    ward shift of the WPSH. As a result, the high WS across        of compound pollution at all sites under Type 1, 2, 3 and 4
    coastal areas was able to ease the ground-level O3 pol-        were 54.3 %, 33.8 %, 6.8 % and 5.1 %, respectively.
    lution (Shu et al., 2016). For the BTH and PRD regions,           The Type 1 weather pattern appeared frequently in early
    the high PF tended to suppress the production of O3 .          summer with a stable WPSH ridge axis at about 22◦ N, and
 4. Type 4: High temperatures, medium-high humidity and            the warm and humid air brought by the WPSH reached the
    weak precipitation in the GZP and PRD regions were             area south of the Yangtze River, where a hot and humid
    able to cause O3 –PM2.5 compound pollution, but the            Meiyu season was formed, with the high humidity suppress-
    PM2.5 pollution in both regions was not heavy, possibly        ing the photochemical reaction of O3 generation. Meanwhile,
    in relation to local lower emissions of pollutants. Under      the north of China was controlled by a low-pressure trough
    the control of the WPSH, there were strong photochem-          at 500 hPa with high temperatures and little rain. The hygro-
    ical reactions at high temperatures and little rainfall in     scopic growth of PM2.5 occurred in the corresponding area in
    some eastern regions (such as the northern BTH, YRD),          front of the trough, with a small amount of water vapor trans-
    which was also conducive to O3 generation (Fig. 14).           ported by the WPSH, causing compound pollution of O3 and
    Meanwhile, relative to Type 1, O3 pollution was lighter        PM2.5 in the BTH–NYRD regions. In addition, the prevail-
    in the BTH, due to the differences of RH, BLH and              ing southerly winds in the boundary layer were able to trans-
    FLWD.                                                          port the pollutants emitted from southern cities to the BTH
                                                                   region, and the atmospheric stratification was stable when
It is important to note that our work contains a few limitations   the air mass was sinking. Thus, the compound pollution was
and uncertainties. Although T-PCA, an objective classifica-        potentially severe. In general, the synoptic circulation in the
tion method, was chosen in this study, there were still some       boundary layer might be responsible for the concentration of
subjective decisions made, e.g., the number of SWPs (Huth          pollutants under this SWP.
et al., 2008). In the present work, we selected four SWPs             Under Type 2, the WPSH shifted northwards from Type 1
based on both the larger ECV and greater 1ECV to further           or retreated southwards from Type 3 or Type 4 to 32.5◦ N
reduce the subjective impact. Nevertheless, at a large scale,      with the meridional deepening of the East Asian major
the present four SWPs were closely associated with intra-          trough at 500 hPa, and thus warm and humid airstreams were
seasonal movements of the WPSH, because the WPSH is one            brought to northern China (e.g., the BTH region), gradually
of the most important components of the present large-scale        elevating temperatures and humidity. Although the positive
SWPs in summertime (Zhao and Wang, 2017). In addition,             RH anomaly promoted the hygroscopic growth of PM2.5 , wa-
note that short-term disturbances induced by typhoons with         ter vapor absorbed solar radiation, leading by contrast to re-
a specific pattern were not excluded. The quick passage of a       duced O3 formation. As a result, the probability of double-
typhoon in summer could lead to various atmospheric pro-           high levels of O3 and PM2.5 under Type 2 was less than
cesses (e.g., precipitation, large-scale subsidence) and pol-      under Type 1, and the extent of compound pollution under
lution levels (Deng et al., 2019), which should be explored        Type 2 was also narrowed, which was mainly located in the
in future work. In addition, although this study emphasizes        BTH area. On the other hand, weak precipitation, a shallow
the important impacts of large-scale synoptic drivers of co-       boundary layer and low WS in the BTH area tended to cre-
occurring summertime O3 and PM2.5 pollution in eastern             ate favorable conditions for the maintenance of pollution. In
China, the presence of PM2.5 may play a role in radiation          spite of the southerly winds over the BTH area, the precipi-
forcing to reduce O3 . Indeed, the interaction between O3 and      tation in southern cities reduced pollutant concentrations and
PM2.5 is deserving of further exploration in future work to        horizontal transportation. Meteorological factors might have
better comprehend the mechanism of O3 –PM2.5 compound              been responsible for the accumulation of compound pollu-
pollution.                                                         tion.

https://doi.org/10.5194/acp-21-9105-2021                                            Atmos. Chem. Phys., 21, 9105–9124, 2021
9120 L. Zong et al.: Summertime O3 –PM2.5 compound pollution in eastern China Figure 13. As in Fig. 12 but for Type 2. Figure 14. Schematic diagrams describing the relationships between the WPSH, four SWPs and summertime O3 and PM2.5 pollution in various regions. Atmos. Chem. Phys., 21, 9105–9124, 2021 https://doi.org/10.5194/acp-21-9105-2021
L. Zong et al.: Summertime O3 –PM2.5 compound pollution in eastern China                                                             9121

   In general, the location of the WPSH was found to be               Key Research and Development Program of China (grant no.
tightly associated with O3 pollution in eastern China, and            2018YFC1506502).
the changes in meteorological conditions in different regions
affected by the WPSH induced significant regional differ-
ences in O3 and PM2.5 pollution. On one hand, appropriate             Review statement. This paper was edited by Xiaohong Liu and re-
warm and moist flow brought by the WPSH promoted hy-                  viewed by Stefan Rahimi-Esfarjani and two anonymous referees.
groscopic growth of the fine particulate matter in some lo-
cal areas (i.e., the BTH–NYRD areas under Type 1 and the
BTH area under Type 2), resulting in increased of PM2.5 con-          References
centrations. On the other hand, transboundary O3 and PM2.5
were simultaneously transported to these local areas, which           Amil, N., Latif, M. T., Khan, M. F., and Mohamad, M.: Seasonal
may have contributed to the formation of co-occurring sur-              variability of PM2.5 composition and sources in the Klang Valley
face O3 and PM2.5 pollution. More importantly, the effects              urban-industrial environment, Atmos. Chem. Phys., 16, 5357–
of various large-scale weather circulation patterns on O3 –             5381, https://doi.org/10.5194/acp-16-5357-2016, 2016.
PM2.5 compound pollution and their corresponding physi-               Cai, W., Li, K., Liao, H., Wang, H., and Wu, L.: Weather
                                                                        conditions conducive to Beijing severe haze more frequent
cal and chemical processes have been clarified, which has
                                                                        under climate change, Nat. Clim. Change, 7, 257–262,
important scientific reference value in terms of summertime             https://doi.org/10.1038/nclimate3249, 2017.
air-quality forecasts as well as assessment and policymaking          Chen, C., Saikawa, E., Comer, B., Mao, X., and Ruther-
services.                                                               ford, D.: Ship Emission Impacts on Air Quality and Hu-
                                                                        man Health in the Pearl River Delta (PRD) Region, China,
                                                                        in 2015, With Projections to 2030, GeoHealth, 3, 284–306,
Data availability. Hourly PM2.5 , NO2 , O3 and O3 -8 h data are         https://doi.org/10.1029/2019GH000183, 2019.
published by the China National Environmental Monitoring Sta-         Chen, H. and Wang, H.: Haze days in North China and the as-
tion (2021, http://www.cnemc.cn/). Surface meteorological data,         sociated atmospheric circulations based on daily visibility data
such as Tmax , precipitation, WS and RH, and radiosonde data            from 1960 to 2012, J. Geophys. Res.-Atmos., 120, 5895–5909,
can be obtained from the China National Meteorological Infor-           https://doi.org/10.1002/2015JD023225, 2015.
mation Center of the China Meteorological Administration (2021,       China National Environmental Monitoring Centre: Real-time Na-
http://data.cma.cn/site/index.html). The NCEP/NCAR daily reanal-        tional Air Quality, available at: http://www.cnemc.cn/, last ac-
ysis dataset can be downloaded from https://psl.noaa.gov/data/          cess: 7 June 2021.
gridded/data.ncep.reanalysis.html (Physical Sciences Laboratory,      CMA Meteorological Data Centre: Hourly Data From Surface Me-
2021). The ERA5 hourly reanalysis dataset can be derived from           teorological Stations In China, available at: http://data.cma.cn/
https://cds.climate.copernicus.eu/cdsapp#!/home (European Centre        site/index.html, last access: 7 June 2021.
for Medium-Range Weather Forecasts, 2021).                            Cohen, A. J., Brauer, M., Burnett, R., Anderson, H. R., Frostad, J.,
                                                                        Estep, K., Balakrishnan, K., Brunekreef, B., Dandona, L., Dan-
                                                                        dona, R., Feigin, V., Freedman, G., Hubbell, B., Jobling, A., Kan,
Supplement. The supplement related to this article is available on-     H., Knibbs, L., Liu, Y., Martin, R., Morawska, L., Pope, C. A.,
line at: https://doi.org/10.5194/acp-21-9105-2021-supplement.           Shin, H., Straif, K., Shaddick, G., Thomas, M., van Dingenen, R.,
                                                                        van Donkelaar, A., Vos, T., Murray, C. J. L., and Forouzanfar, M.
                                                                        H.: Estimates and 25-year trends of the global burden of disease
Author contributions. YY designed the research. LZ and YY devel-        attributable to ambient air pollution: an analysis of data from the
oped and wrote the manuscript. LZ and YY collected and analyzed         Global Burden of Diseases Study 2015, Lancet, 389, 1907–1918,
the data. MG, HW, PW, HZ, LW, GN, CL, YL and ZG provided                https://doi.org/10.1016/S0140-6736(17)30505-6, 2017.
useful comments. All the authors contributed to the revision of the   Day, D. B., Xiang, J., Mo, J., Li, F., Chung, M., Gong, J.,
manuscript.                                                             Weschler, C. J., Ohman-Strickland, P. A., Sundell, J., Weng,
                                                                        W., Zhang, Y., and Zhang, J. J.: Association of ozone ex-
                                                                        posure with cardiorespiratory pathophysiologic mechanisms
                                                                        in healthy adults, JAMA Intern. Med., 177, 1344–1353,
Competing interests. The authors declare that they have no conflict
                                                                        https://doi.org/10.1001/jamainternmed.2017.2842, 2017.
of interest.
                                                                      Deng, Y., Li, J., Li, Y., Wu, R., and Xie, S.: Characteristics of
                                                                        volatile organic compounds, NO2 , and effects on ozone forma-
                                                                        tion at a site with high ozone level in Chengdu, J. Environ. Sci.-
Acknowledgements. We thank editor, Stefan Rahimi-Esfarjani and          China, 75, 334–345, https://doi.org/10.1016/j.jes.2018.05.004,
two anonymous reviewers for their constructive comments.                2019.
                                                                      Ding, Y.: The Summer Monsoon in East Asia, in: Monsoons over
                                                                        China, 1–90, Atmospheric Sciences Library, vol 16. Springer,
Financial support. This research has been supported by the              Dordrecht, 1994.
National Natural Science Foundation of China (grant nos.              Du, Y., Wan, Q., Liu, H., Liu, H., Kapsar, K., and Peng,
42061134009, 42075072, and 41575010) and the National                   J.: How does urbanization influence PM2.5 concentra-

https://doi.org/10.5194/acp-21-9105-2021                                                Atmos. Chem. Phys., 21, 9105–9124, 2021
You can also read