DROUGHT INFORMATION STATEMENT SOUTH CENTRAL TEXAS - National Weather Service
←
→
Page content transcription
If your browser does not render page correctly, please read the page content below
D R O U G H T I N F O R M AT I O N S TAT E M E N T
SOUTH CENTRAL TEXAS
WFO AUSTIN/SAN ANTONIO, TX
ISSUED: FEBRUARY 14, 2020
Summary
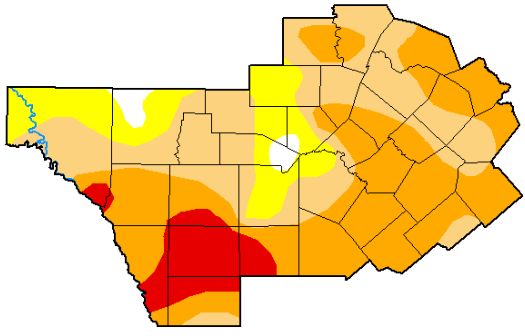
Drought conditions continue across much of South Central Figure 3, the U.S. Drought Monitor valid February 11th and
Texas. Abnormally Dry (D0) to Extreme Drought (D3) issued on February 13th through the National Drought
conditions were being reported across South Central Texas. Mitigation Center, showed drought conditions have
Locations across the southwest portion of the region were improved across the northern sections of the region. The
experiencing the driest conditions. Most locations remain in southwestern sections of South Central Texas have seen
year-round water conservation with some locations actually in conditions get worse. Abnormally Dry (D0) to Extreme
drought restrictions for landscape watering. Lakes and (D3) Drought conditions were present across the region.
reservoirs remain in good shape, with levels remaining steady or Currently 98 percent of South Central Texas is
slowly decreasing. Cold fronts continue to move through the experiencing Abnormally Dry (D0) to Extreme (D3)
region with additional moisture along the fronts when compared drought conditions.
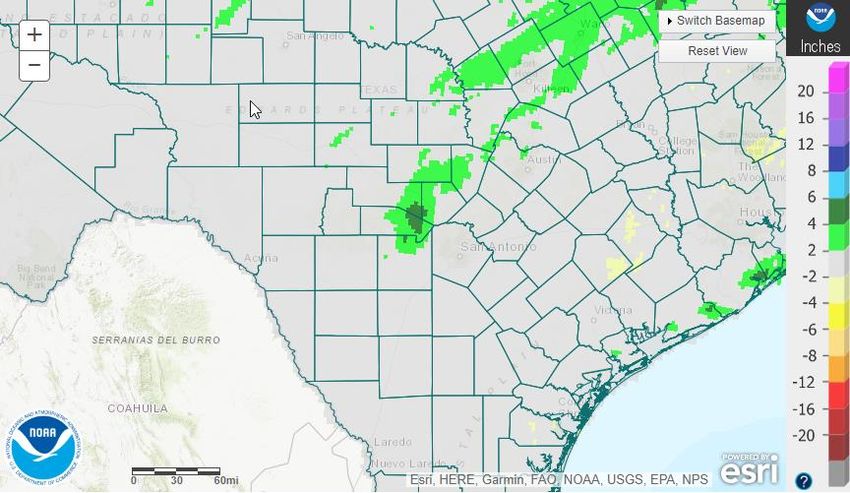
with January so more locations are receiving rain. Recent fronts
have brought 1 to 3 inches of rain to portions of Llano, Burnet,
Kendall, Hays, Travis and Williamson counties.
Figure 1 - Total Observed Rainfall January 1, 2020
to February 13, 2020
Figure 3 – February 11th U.S. Drought Monitor
County Level
The U.S. Drought Monitor is a comprehensive drought
monitoring effort between government and academic
partners. It is issued each Thursday morning and
incorporates hydrometeorological data through 7 AM
Tuesday.
Figure 2 – Departure from Normal Rainfall
January 1, 2020 to February 13, 2020
1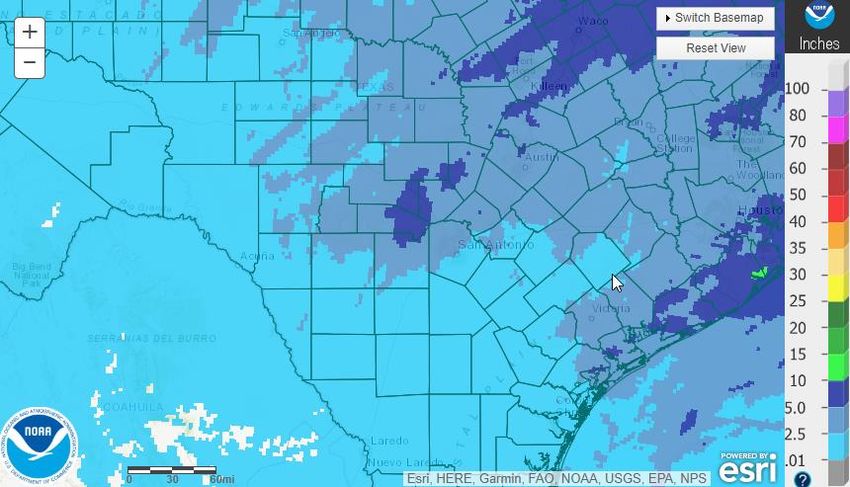
Hydrologic Impacts Fire Danger Impacts
According to the USGS Water Watch, the Rio Grande, As of February 14th, there were 14 counties with county-
Devils, Nueces, Frio, San Antonio, Medina, San Marcos, wide burn bans in effect. These burn bans are established by
Blanco, upper Guadalupe and middle Colorado basins were county officials.
reporting normal flows. The Lower Guadalupe, lower
Colorado, and the middle Brazos basins were reporting below
normal flows. The Pecos basin was reporting much below
normal flows.
Reservoir conditions as of February 14, 2020 are presented in
the following table.
Pool Current
Reservoir Elevation Elevation
(ft) (ft)
Amistad 1117.00 1085.8
Medina Lake 1064.2 1053.3
Canyon Lake 909.00 906.0
Granger Lake 504.00 505.0
Georgetown Lake 791.00 782.8
Lake Buchanan 1020.00 1016.8
Lake LBJ 825.00 820.5
Lake Marble Falls 738.00 736.3 Figure 5 - Burn Bans Currently in Effect
Lake Travis 681.00 670.5
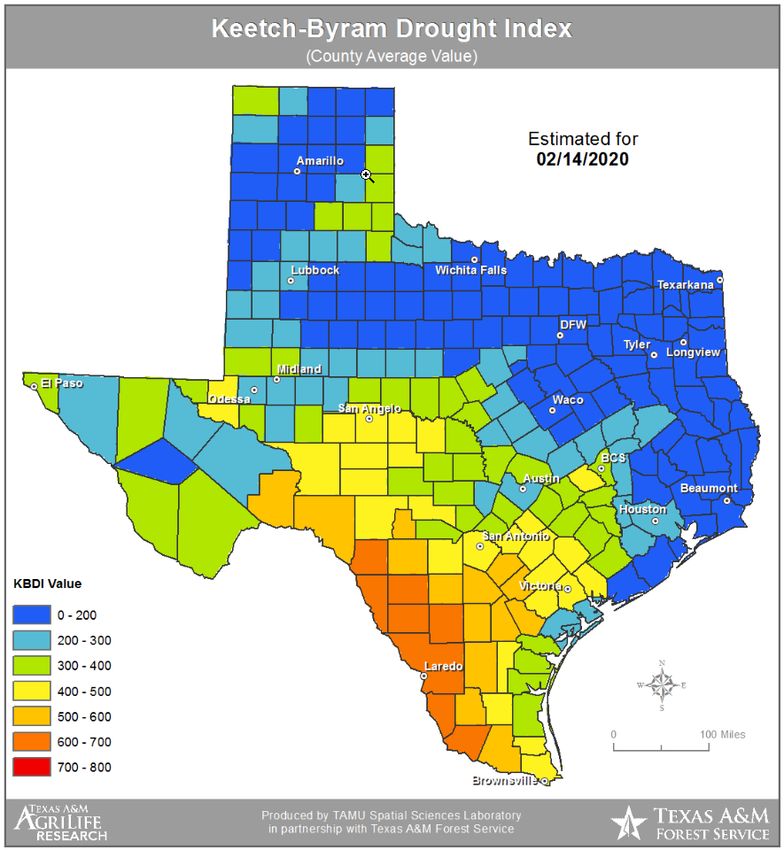
Lake Austin 492.91 491.1 The Texas Forest Service uses the Keetch-Byram Drought
Index (KBDI) as a system for relating current and recent
According to Texas Commission on Environmental Quality weather conditions to potential or expected fire behavior. It is
(TCEQ), there are 1062 public water supply systems with a numerical index calculated daily for each county. Each
voluntary or mandatory water use restrictions across the number is an estimate of the amount of rain, in hundredths of
entire state. Figure 4 shows the locations of affected systems an inch, needed to bring the soil back to saturation. The index
across Texas. This assessment is normally updated weekly. ranges from 0 to 800, with 0 representing a saturated soil and
800 a completely dry soil. As shown below, the February 14th
issuance of the KBDI showed values of 200 to 700 across the
region.
Figure 4 – Water Systems with Water Use Restrictions
February 12, 2020
2
Figure 6 – KBDI Map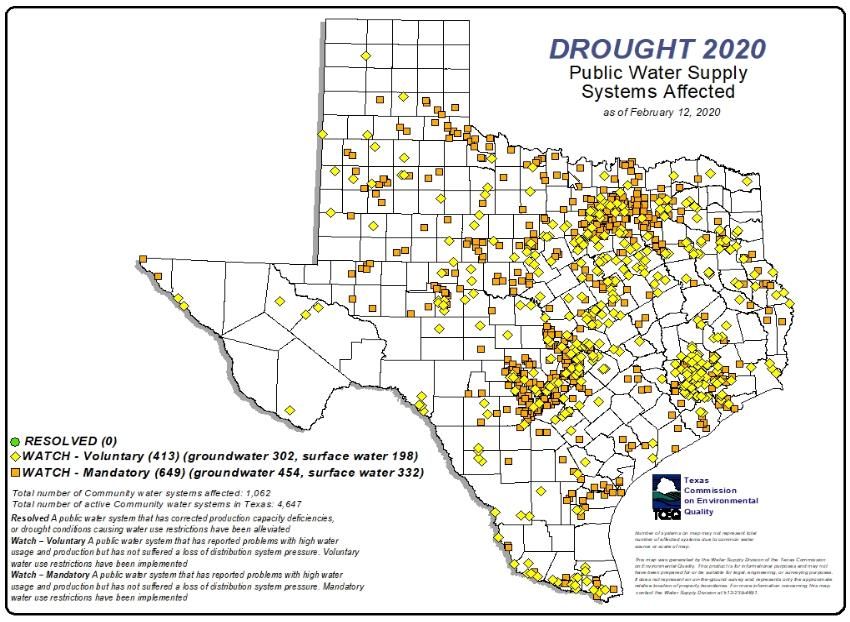
Agricultural Impacts Outlook
The CPC Outlooks for March 2020 through May 2020,
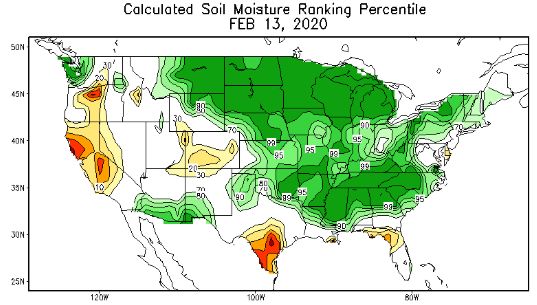
Each week, the Climate Prediction Center (CPC) analyzes the indicated stronger trends for above average temperatures
percent of available soil moisture as compared to normal. The (figure 8) and equal chances for average, below average or
February 13th available soil moisture ranges from 1 to 30 above average rainfall (figure 9) across South Central Texas.
percent of normal across South Central Texas. The next three-month outlooks are scheduled to be available
on February 20, 2020.
Figure 8 – Temperature Outlook
Figure 7 – Percent Available Soil Moisture
The Crop Moisture Index monitors short term need compared to
available water across major crop producing regions. This index
is not used to monitor long term drought conditions. The latest
Crop Moisture Index issued by the CPC on February 8th
indicated short term moisture conditions were moderately dry to
near normal across South Central Texas.
Figure 9 – Precipitation Outlook
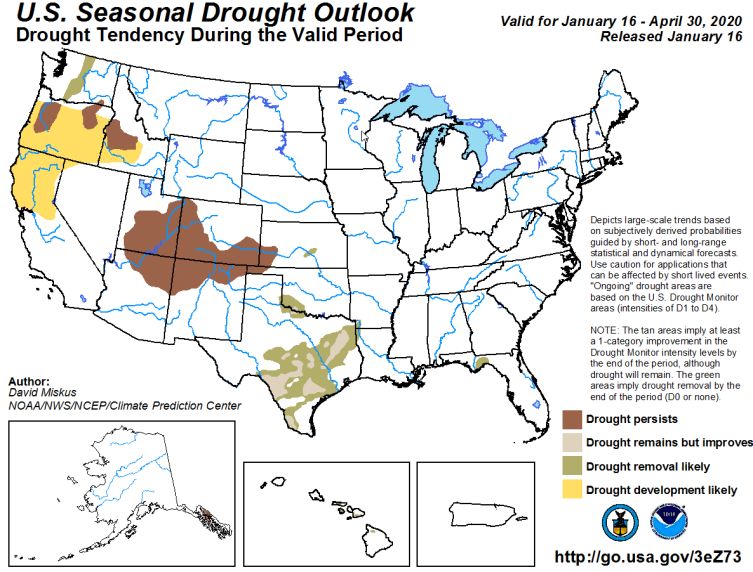
U.S. Seasonal Drought Outlook indicates drought conditions
may improve across the region through April 30, 2020.
3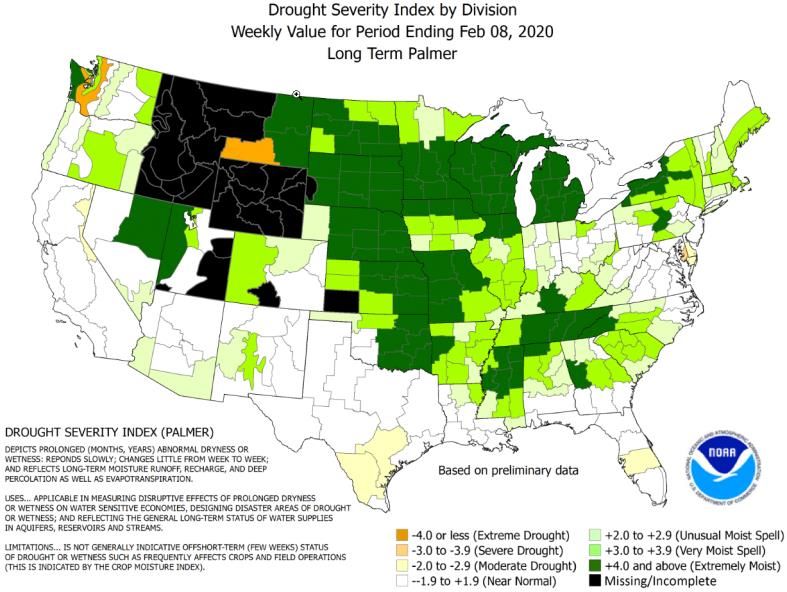
Contact Information:
Austin/San Antonio National Weather Service
             2090 Airport Road
         New Braunfels, TX 78130
            830.606.3617 Press 2

Website: http://www.weather.gov/austin/
Email: sr-ewx.webmaster@noaa.gov

Drought Related Links:
Precipitation Data:
http://water.weather.gov/precip/

The U.S. Drought Monitor:
http://droughtmonitor.unl.edu/

The USGS Water Watch:
http://waterwatch.usgs.gov/?m=pa07d_nwc&r=tx&w=map

TCEQ Map of Water Systems under Water Use Restriction
https://www.tceq.texas.gov/drinkingwater/trot/location.html

The Texas Counties Burn Ban Map:
http://tfsfrp.tamu.edu/wildfires/DecBan.png

The KDBI County Average Map:
http://twc.tamu.edu/tfs/kbdi_daily/kbdicounty.png

CPC Soil Moisture:
http://www.cpc.ncep.noaa.gov/products/Soilmst_Monitoring/US/Soilmst/Soilmst.s
html

Texas AgNews:
http://agnews.tamu.edu/

CPC Outlook Maps:
http://www.cpc.ncep.noaa.gov/

CPC U.S. Seasonal Drought Outlook:
http://www.cpc.ncep.noaa.gov/products/Drought/

                                              4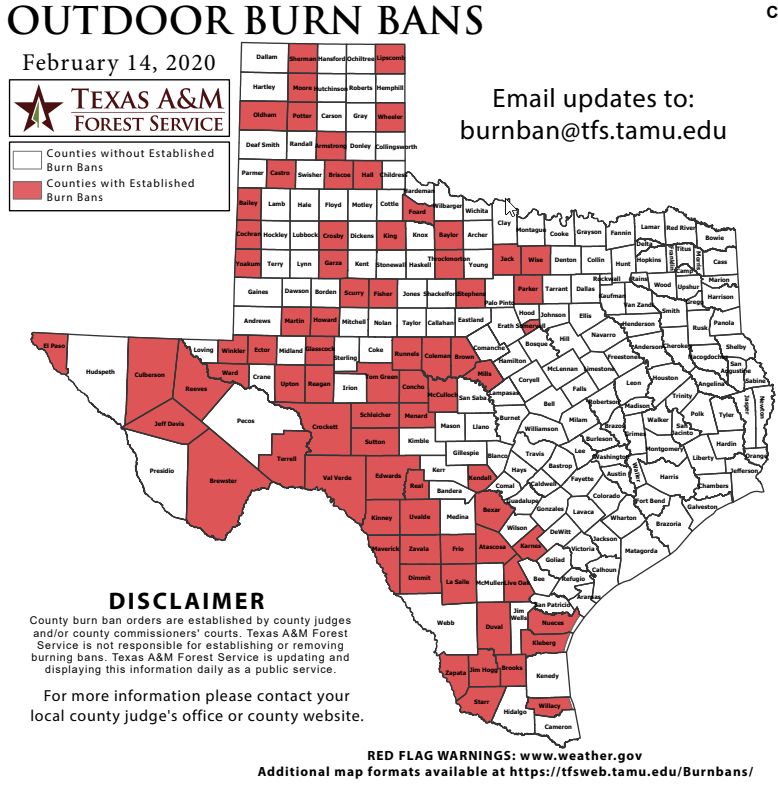
5
You can also read