Meteorological export and deposition fluxes of black carbon on glaciers of the central Chilean Andes
←
→
Page content transcription
If your browser does not render page correctly, please read the page content below
Research article
Atmos. Chem. Phys., 23, 1749–1768, 2023
https://doi.org/10.5194/acp-23-1749-2023
© Author(s) 2023. This work is distributed under
the Creative Commons Attribution 4.0 License.

            Meteorological export and deposition fluxes of black
              carbon on glaciers of the central Chilean Andes
             Rémy Lapere1 , Nicolás Huneeus2 , Sylvain Mailler1,3 , Laurent Menut1 , and Florian Couvidat4
           1 Laboratoire  de Météorologie Dynamique, IPSL, École Polytechnique, Institut Polytechnique de Paris,
                              ENS, Université PSL, Sorbonne Université, CNRS, Palaiseau, France
                               2 Department of Geophysics, Universidad de Chile, Santiago, Chile
                                      3 École des Ponts ParisTech, Marne-La-Vallée, France
                 4 Institut National de l’Environnement Industriel et des Risques, Verneuil-en-Halatte, France

                                  Correspondence: Rémy Lapere (remy.lapere@lmd.ipsl.fr)

                                  Received: 24 August 2022 – Discussion started: 19 September 2022
                        Revised: 21 December 2022 – Accepted: 21 January 2023 – Published: 31 January 2023

       Abstract. Air pollution in the central zone of Chile is not only a public health concern but also threatens
       water resources and climate, in connection with the transport and deposition of black carbon (BC) from urban
       centers onto the glaciers of the Andes. Chemistry-transport simulations reveal a seasonal dichotomy in the flux
       and latitudinal pattern of BC deposition on glaciers of the central Chilean Andes. The average deposition flux
       of BC on glaciers between 30 and 37◦ S is 4 times larger in winter, affecting mostly low-elevation glaciers,
       whereas the smaller summertime flux affects glaciers evenly, irrespective of their elevation. The contribution of
       emissions from the city of Santiago is dominant in summertime with more than 50 % along the Andes but minor
       in wintertime with less than 20 % even close to the capital city. Transport at larger scales and more local sources
       likely account for the remaining flux. The superimposition of synoptic-scale circulation and local mountain-
       valley circulation along the Andes drives the differences between summertime and wintertime deposition fluxes
       and generates a greater meteorological export potential during summer months. Future emissions and climate
       projections suggest that under the RCP8.5 scenario the gap between summertime and wintertime BC export
       and deposition flux could decrease, thereby pointing to summertime emission control gaining relevance. The
       chemistry-transport modeling approach for BC deposition on the Andes sheds light on the importance of the
       often disregarded summertime emissions on the radiative balance of its glaciers, particularly in the vicinity of
       Santiago.

1   Introduction                                                   Álamos et al., 2022). Among these emissions, black carbon
                                                                   (BC) particles constitute a large fraction, in relation to in-
                                                                   complete combustion of fossil fuel and biomass (Shrestha et
Urban areas in the central region of Chile (extending roughly      al., 2010; Villalobos et al., 2015).
between 30 and 37◦ S) face concerning air pollution issues,           Besides the health issues associated with air pollution (Il-
especially regarding fine particulate matter (PM2.5 ) (e.g.,       abaca et al., 1999), light-absorbing particles such as BC have
Saide et al., 2016; Barraza et al., 2017; Lapere et al., 2021b).   a strong radiative impact once deposited on snow and ice,
Strong anthropogenic emissions of primary particulate mat-         reducing their albedo and hence accelerating their melting
ter and precursors mostly stem from dense road traffic and         (Hadley and Kirchstetter, 2012; Hodson, 2014; Kang et al.,
industrial activities all year round and a large additional con-   2020; Niu et al., 2020). For example, Réveillet et al. (2022)
tribution from wood burning for residential heating in win-        found that BC and dust in snow in the French Alps and the
tertime, particularly in the metropolitan region of Santiago       Pyrenees advance the peak meltwater runoff by as much as
(Barraza et al., 2017; Marín et al., 2017; Mazzeo et al., 2018;

Published by Copernicus Publications on behalf of the European Geosciences Union.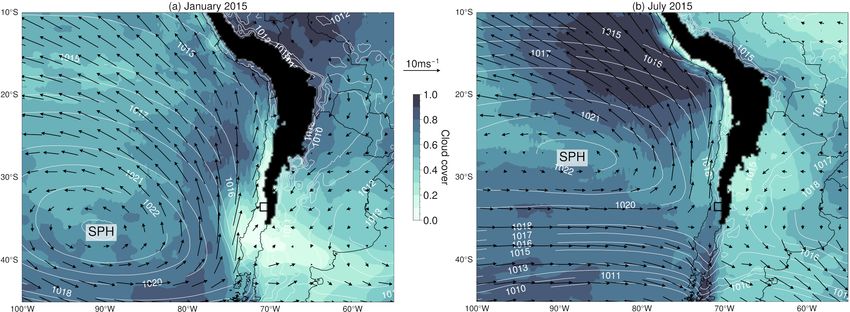
1750                                                R. Lapere et al.: Export and deposition of BC on glaciers of central Chile

2 weeks. Similarly, Ménégoz et al. (2013, 2014) found that         land in the Santiago Basin, in connection with the latitudinal
BC on snow can reduce the snow cover season duration by            displacement of the SPH and contrasts in solar radiation be-
up to 10 d in boreal and temperate regions and up to 8 d in        tween winter and summer affecting the mountain-valley cir-
the Himalayas. The evolution of the snow cover with climate        culation (Lapere et al., 2021b).
change is therefore strongly modulated by the deposition of           Several atmospheric measurement campaigns have been
BC and dust (Réveillet et al., 2022), and BC deposition on         conducted in the vicinity of Santiago aiming to investigate
Andean glaciers is of great concern, although it has received      the transport of urban BC into the adjacent Andean valleys,
little attention so far compared to other mountain areas in the    each focusing on a different canyon and/or time period (Cor-
world (Vuille et al., 2018).                                       dova et al., 2016; Gramsch et al., 2020; Huneeus et al., 2021).
    Glaciers in South America have been evidently retreating       Modeling studies also provided insight on this topic, again
in the last 30 years (Rabatel et al., 2013), with impacts on lo-   focusing on specific periods and/or canyons (Gramsch et al.,
cal population and economy (Barnett et al., 2005). Complex         2020; Lapere et al., 2021a). Although the aforementioned
climatic mechanisms are related to this melting in the An-         studies complement each other to refine the knowledge on
des mountain range, including a combination of atmospheric         BC transport near Santiago, a more holistic approach both
temperature and precipitation pattern changes (Barnett et al.,     temporally and spatially, with a regional and climatological
2005). In addition to these forcings, Magalhães et al. (2019)      relevance, is missing to the best of our knowledge.
showed that BC from Amazonian biomass burning and dust                It is now well established that particulate matter emitted
deposited on a glacier of the tropical Andes significantly in-     in Santiago has the ability to reach high-elevation areas in
crease its runoff. In the central Chilean Andes too, BC was        the nearby Andes both in summer and winter periods, with a
found in significant amounts in snow, creating an estimated        transport time of a few hours (Gramsch et al., 2020; Huneeus
additional radiative forcing of 1.4 W m−2 in the region of         et al., 2021). Nevertheless, the aforementioned works focus
Santiago for winter months (Rowe et al., 2019), which can          on atmospheric concentrations and do not investigate deposi-
go up to 10 W m−2 for the most impacted sites (Cordero et          tion on snow- or ice-covered terrain, which is ultimately the
al., 2022). Dust emitted by mining activities (Barandun et         issue at stake. Rowe et al. (2019) and Cordero et al. (2022)
al., 2022) and mineral dust from the Atacama desert lifted         measured wintertime BC deposition rates in the high Andes
by winds are also found to affect glaciers and snow in north-      but could not conclude on source attribution. Symmetrically,
ern Chile (Rowe et al., 2019), although the albedo effect for      Lapere et al. (2021a) used a model-based approach enabling
visible wavelengths is scaled down by a factor of about 200        them to trace back the origin of deposited BC on the Andean
compared to an equivalent mass of BC (Dang et al., 2015).          cryosphere but only for winter conditions and over a limited
    The central region of Chile has been facing a hydrological     area.
deficit since the last decade in relation to the recent mega-         The objective of this work is to provide a more complete
drought (Garreaud et al., 2017) so that the additional accel-      picture in terms of space, time and drivers of urban BC ex-
erated melting of glaciers and snowpack triggered by impu-         port towards the Andes. We use chemistry-transport model-
rities leads to an even higher stress on water resources at the    ing with WRF-CHIMERE to compute BC deposition rates
end of summer. In a short-term perspective an accelerated          on glaciers of the central Chilean Andes for a given year
melting increases river runoff and therefore freshwater avail-     and highlight differences between summertime and winter-
ability (Vuille et al., 2018). In the long-term however, peak      time. Then, based on local observations and reanalysis data,
water is reached and river runoff starts decreasing and even-      the meteorological processes driving these differences are
tually stops when glaciers have sufficiently retreated (Hock       identified. Finally, future trends in wind speeds in the San-
et al., 2019). Ayala et al. (2020) suggest that glaciers of cen-   tiago area are extracted from the COordinated Regional Cli-
tral Chile may have already passed peak water, making ac-          mate Downscaling EXperiment-COmmon Regional Exper-
celerated melting even more concerning. In this context it is      iment (CORDEX-CORE) simulations under the Represen-
paramount to expand the knowledge on BC transport towards          tative Concentration Pathway (RCP) 2.6 and 8.5 scenarios.
and deposition on glaciers of the Chilean Andes.                   BC emission rates associated with these two pathways are
    Central Chile is a narrow strip of land surrounded by the      also considered to assess a possible evolution in the seasonal
Pacific Ocean in the west and the Andes in the east. As a re-      asymmetry in BC transport from Santiago to the Andes.
sult, the atmospheric circulation is driven both by synoptic-
scale conditions related to the position of the South Pacific
                                                                   2     Data and methods
High (SPH) over the Pacific Ocean and by local mountain-
valley circulation dynamics. Mountain-valley circulation is        2.1    Modeling setup
related to the differential heating and cooling between nar-
row canyons and wide basins under radiative forcing, which         The chemistry-transport simulations performed in this work
generate up-slope and up-valley winds during the daytime           use the same modeling setup as the one adopted in Lapere
and a reversal at night (e.g., Whiteman, 2000). A direct corol-    et al. (2021b) and are recalled in Table 1. The same set of
lary is a strong seasonality in wind regimes, particularly in-     simulations is used, despite a different perspective. Here-

Atmos. Chem. Phys., 23, 1749–1768, 2023                                             https://doi.org/10.5194/acp-23-1749-2023
R. Lapere et al.: Export and deposition of BC on glaciers of central Chile                                                      1751

Table 1. WRF and CHIMERE configurations.

                              WRF configuration                              CHIMERE configuration
                                                   Spatial resolution 5 km
                    Vertical levels               60           Vertical levels             30
                    Microphysics                  WSM3         Chemistry                   MELCHIOR
                    Boundary and surface layer    MYNN         Gas and aerosol partition   ISORROPIA
                    Land surface                  Noah LSM     Horizontal advection        Van Leer
                    Cumulus parameterization      Grell G3     Vertical advection          Upwind
                    Longwave radiation            CAM          Boundary conditions         LMDz-INCA + GOCART
                    Shortwave radiation           Dudhia       Emission inventory          HTAP v2

after are presented only the most important features of the            ception terms. More details and formulas for the different
model. For full details and validation of meteorology and              components of Eq. (1) can be found in the CHIMERE model
pollutant concentrations, the interested reader is invited to          documentation (LMD et al., 2021). Another dry-deposition
refer to Lapere et al. (2021b). Simulations are performed              scheme is available in CHIMERE based on Wesely (1989).
with the CHIMERE chemistry-transport model (Mailler et                 The choice to use only one scheme rather than performing a
al., 2017), forced by meteorological fields simulated with the         sensitivity analysis with both schemes is discussed in Sect. 4.
Weather Research and Forecasting (WRF) mesoscale numer-                Regarding wet deposition, CHIMERE distinguishes between
ical weather model (Skamarock et al., 2008), version 3.9.1.1.          below-cloud scavenging by rain and by snow. The former
The set of WRF and CHIMERE parameterizations used in                   uses the raindrop size distribution from Willis and Tattel-
this work (Table 1) has been extensively tested for this region        man (1989) to compute the impaction of particles by falling
of Chile at several spatial resolutions and show good per-             droplets. The latter is based on the parameterization from
formance in reproducing meteorology and atmospheric com-               Wang et al. (2014). Furthermore, aerosols are distributed into
position over the region of Santiago (Mazzeo et al., 2018;             10 size bins with mass median diameters (10, 30, 70, 160,
Lapere et al., 2020, 2021a, b). A spin-up period of 15 d is            350, 760 nm, 1.7, 3.5, 7, 20 µm), following a log-normal dis-
included before the simulation periods considered here. An-            tribution.
thropogenic emissions only are considered for BC (i.e., wild-
fire events, which can be a large BC source, are not in-               2.2   Observations, reanalysis and future scenario data
cluded in the emission inventory) and are adapted from the
Hemispheric Transport of Air Pollution (HTAP) V2 inven-                Local observational data of wind speed and direction at sur-
tory (Janssens-Maenhout et al., 2015) using the methodology            face level in the Santiago area are extracted from the Chilean
from Menut et al. (2013). The simulation domain as shown               automated meteorological and air quality monitoring net-
in Fig. 2 comprises the central zone of Chile, at a 5 km spatial       work (Ministerio del Medio Ambiente, 2015), which will
resolution. A set of four simulations is performed: 1 month            be abbreviated as SINCA in the rest of this work, and the
in January 2015 with and without emissions from the city               Chilean weather service stations (Dirección Meteorológica
of Santiago (as defined by the black boxes in Fig. 2) and              de Chile, 2019), referred to as DMC hereafter. Wind verti-
1 month in July 2015 considering the same sensitivity analy-           cal profiles at an hourly frequency in Santiago, for the years
sis. Based on this set of simulations, typical deposition fluxes       2017 to 2019, are extracted from the Aircraft Meteorolog-
of BC, including the contribution of emissions from Santi-             ical Data Relay (AMDAR) data available for Santiago air-
ago, for summertime and wintertime can be derived.                     port (SCEL), as presented and analyzed in Muñoz et al.
   The aerosol dry-deposition scheme used in CHIMERE for               (2022). More information on the measurement stations (lo-
this work is based on Zhang et al. (2001), which relies on a           cation, variables used, frequency, source) considered in this
resistance analogy where the deposition velocity vd can be             work can be found in Table 2. The main observation sites and
written as in Eq. (1).                                                 the configuration of the Santiago Basin and its main canyons
                                                                       are shown in Fig. 1.
               1                                                          To analyze the large-scale circulation and vertical wind
vd = vs +           ,                                         (1)
            ra + rs                                                    profiles, reanalysis data from ERA5 at a 0.25◦ resolution for
                                                                       the year 2015 are used (Copernicus Climate Change Service,
where vs is the settling velocity related to the particle mass         2017). In particular, monthly averaged reanalyses of zonal
upon which gravity acts to bring it back to ground level, ra           and meridional winds on pressure levels, together with mean
is the aerodynamic resistance that accounts for turbulence             sea-level pressure, cloud cover, and 10 m zonal and merid-
and surface friction and roughness, and rs the surface re-             ional winds are incorporated into the analysis.
sistance including Brownian diffusion, impaction and inter-

https://doi.org/10.5194/acp-23-1749-2023                                               Atmos. Chem. Phys., 23, 1749–1768, 2023
1752                                                   R. Lapere et al.: Export and deposition of BC on glaciers of central Chile

Table 2. Weather and air quality stations used in this work and their available measurements and periods.

 Station                               Lat/long         Measurements                                  Frequency         Period    Source
 Parque O’Higgins (PQH)          33.45◦ S, 70.66◦ W     Wind speed, wind direction, PM2.5 , PM10      Hourly        2012–2015     SINCA
 Las Condes (CND)                33.36◦ S, 70.52◦ W     Wind speed, wind direction                    Hourly             2015     SINCA
 Puente Alto (PTA)               33.60◦ S, 70.56◦ W     Wind speed, wind direction                    Hourly              015     SINCA
 San Jose de Guayacan (SJG)      33.64◦ S, 70.35◦ W     Wind speed, wind direction                    Hourly             2015     DMC
 Santiago Airport (SCEL)         33.38◦ S, 70.78◦ W     Wind profile                                  Hourly        2017–2019     AMDAR
 Talca                           35.43◦ S, 71.65◦ W     Wind speed, PM2.5                             Hourly        2012–2015     SINCA
 Rancagua                        34.16◦ S, 70.74◦ W     Wind speed, PM2.5                             Hourly        2012–2015     SINCA
 Viña del Mar                    33.02◦ S, 71.55◦ W     Wind speed, PM2.5                             Hourly        2012–2015     SINCA
 Andacollo                       30.24◦ S, 71.08◦ W     Wind speed, PM2.5                             Hourly        2012–2015     SINCA

Figure 1. Localities and canyons of interest in the vicinity of Santiago. Measurement stations are designated with white circles. Canyons of
interest are evidenced with blue lines. Map background layer source: Imagery World 2D, © 2009 Esri.

   The analysis of future trends in surface winds in Santi-             Wind speeds are regarded as the ensemble mean of the six
ago is based on outputs from the CORDEX-CORE project                    realizations of each scenario. These trends in the regional
(Gutowski et al., 2016; Giorgi et al., 2021) in the South               climate are put into perspective with regard to the associ-
America domain at a 22 km resolution (SAM-22), for                      ated changes in BC emissions in the Santiago area. To do
two regional climate models (REMO2015 and RegCM4-7)                     this, RCP2.6 (van Vuuren et al., 2007) and RCP8.5 (Riahi et
driven by three different general circulation models (MOHC-             al., 2007) emission scenarios are considered. The data were
HadGEM2-ES, MPI-M-MPI-ESM and NCC-NorESM1) un-                          downloaded from the RCP Database (2009).
der two future scenarios (RCP2.6 and RCP8.5). The vari-
ables of interest were downloaded through the Earth Sys-
tem Grid Federation (ESGF) data platform (ESGF, 2014).

Atmos. Chem. Phys., 23, 1749–1768, 2023                                                    https://doi.org/10.5194/acp-23-1749-2023
R. Lapere et al.: Export and deposition of BC on glaciers of central Chile                                                              1753

Figure 2. Simulated emissions of BC and accumulated deposition on glaciers of the central Chilean Andes in (a) January and (b) July 2015.
Color map shows BC emission rates. The black box represents the Santiago city area. Two different zones are considered: 30–37◦ S (pink
color code) and 33–34◦ S (green color code). Pie charts show the share of deposition attributable to emissions from Santiago (lighter color)
and other regions (darker color). Pie chart sizes are proportional to total deposition. The white shaded area corresponds to snow-covered grid
points in the simulations.

2.3   Analysis methodology                                               3     Results
The methodological approach adopted in this study follows
three steps. First, using chemistry-transport modeling for a             3.1    Seasonal differences in BC deposition
summer month and a winter month in 2015, an estimate of
the deposition flux of BC on the glaciers of the Andes of cen-           Anthropogenic emissions of primary pollutants such as BC
tral Chile is derived, as is the share attributable to emissions         feature a pronounced seasonality, as shown in the HTAP in-
from the city of Santiago. These time-limited simulations are            ventory (color map in Fig. 2). In particular, this inventory
designed to provide insight into the seasonality, magnitude              evidences that in summer (January) BC emissions are con-
and areas most affected by BC deposition. The seasonality in             centrated in large urban centers such as the Santiago Basin
atmospheric circulation is then analyzed using data from re-             (black square in Fig. 2) and the Valparaíso (33◦ S, 71.5◦ W)
analysis and local observation, and its role in driving the de-          and Concepción (37◦ S, 73◦ W) regions. In contrast, winter-
position seasonality is discussed. Finally, future projections           time (July) emissions of BC are more evenly scattered across
of this circulation are analyzed using CORDEX-CORE data                  the domain, in relation to the widespread use of wood burn-
under RCP scenarios.                                                     ing for residential heating purposes during that season, all
   Throughout this work, the locations of glaciers are defined           throughout central Chile (e.g., Saide et al., 2016). This addi-
based on WGMS and National Snow and Ice Data Center                      tional emission source in wintertime leads to a monthly total
(2012). The nearest grid point in the CHIMERE domain is                  flux of BC over the domain of 163 % more in winter com-
used to compute the corresponding deposition flux on each                pared to summer, with 123 t per month for January and 324 t
individual glacier. Rock glaciers are excluded from the anal-            per month for July.
ysis as the main concern regarding BC deposition on glaciers                As a result of the combination of the seasonality both
is the impact on their albedo.                                           in emissions and circulation, total deposition fluxes of BC
                                                                         (dry+wet) differ greatly between January and July 2015 on
                                                                         the scale of central Chile. In particular, the glacier-averaged
                                                                         BC deposition flux between 30 and 37◦ S (pink lines in

https://doi.org/10.5194/acp-23-1749-2023                                                  Atmos. Chem. Phys., 23, 1749–1768, 2023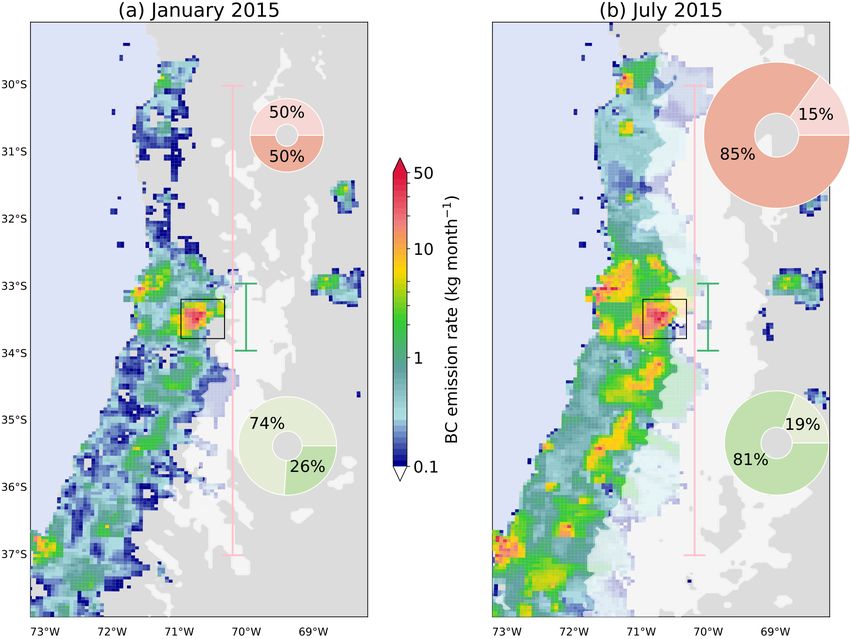
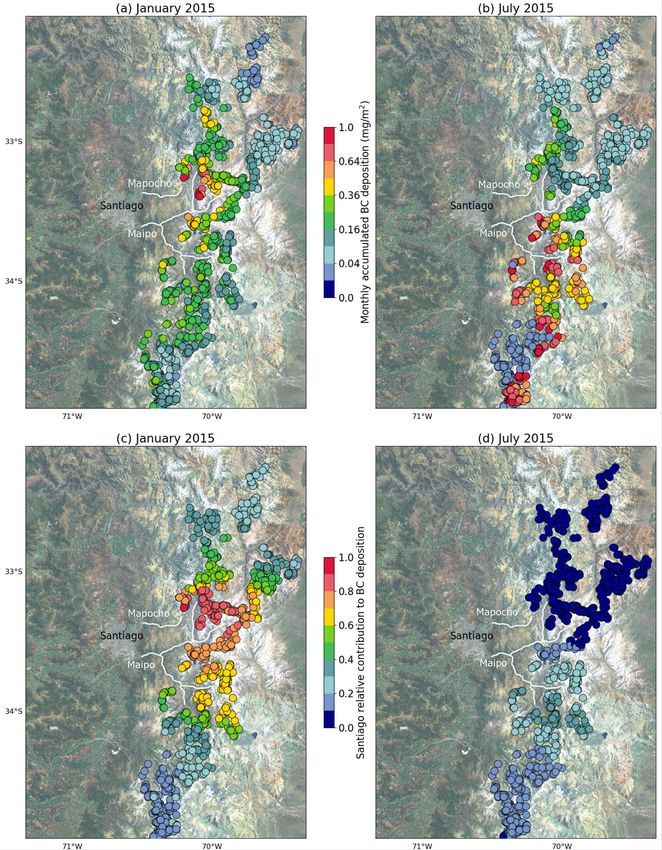
1754                                                R. Lapere et al.: Export and deposition of BC on glaciers of central Chile

Fig. 2) is 4 times larger in winter, at 634 µg m−2 per month,      month of January, associated with a relative standard devia-
compared to summer with 158 µg m−2 per month. In the               tion of 17 % (Fig. 4). In contrast, the same time series for July
direct vicinity of the city of Santiago, as defined by the         is more chaotic, featuring no clear variability mode and daily
glaciers located between latitudes 33 and 34◦ S (green lines       deposition rates between 4 and 68 µg m−2 d−1 with a rela-
in Fig. 2), the seasonality is less pronounced with a monthly      tive standard deviation of 88 %. The associated time series
total deposition flux of 292 µg m−2 per month in summer and        of deposition velocity (vd in Eq. 1) shows similar patterns
322 µg m−2 per month in winter.                                    (dashed lines in Fig. 4) and suggests that particulate matter
   In these absolute totals, the contribution of Santiago emis-    found in air parcels above glaciers have a similar probability
sions is larger in summertime with 50 % of the BC particles        of being deposited in summer and winter, given that vd has
deposited coming from the capital city, while it accounts for      the same magnitude in both seasons (2.30 µm s−1 on average
only 15 % in wintertime on the scale of central Chile (pink        in July and 2.18 µm s−1 in January). The winter time series
pie charts in Fig. 2). The seasonality in spatial patterns of BC   also includes a wet-deposition component that exacerbates
emissions mentioned above, with emissions found mostly in          its erratic behavior due to sporadic precipitation episodes in-
large urban centers in summer but more scattered in win-           ducing spikes in deposition. Wet deposition is an important
ter accounts for this observation. This seasonal difference is     contributor for wintertime BC deposition and accounts for
even greater close to the Santiago Basin, with 74 % of de-         34 % of deposition on glaciers in the simulation domain. This
position in summer related to Santiago emissions but only          component is absent in summertime due to essentially dry
19 % in winter between 33 and 34◦ S (green pie charts in           conditions in the region for that season.
Fig. 2). Summertime total BC emissions are 50 % smaller               Regarding the relative contribution of emissions from San-
than in wintertime in this area, according to the inventory        tiago, Fig. 3c and d also reveal contrasting patterns between
used in this work. This decrease does not translate into a de-     January and July. In the direct vicinity of the capital city
crease in deposition. In fact, when considering dry deposition     (between 33 and 34◦ S), the contribution ranges from 50 %
alone, the deposition flux on glaciers in the vicinity of Santi-   to 100 %, with a northward gradient in summertime. North
ago (33–34◦ S) even increases by 40 % in summertime com-           of 33◦ S and south of 34◦ S the contribution decreases to
pared to wintertime, despite emissions being halved. In this       around 30 %. Contrarily, in July the contribution from San-
case, seasonal variations in regional emissions only cannot        tiago emissions does not exceed 40 % and is concentrated in
explain this change. The additional factors explaining these       the south, near the Maipo River canyon (southernmost white
variations are investigated in Sect. 3.2.                          line connecting Santiago to the Andes in Fig. 3d). This find-
   To further investigate the large difference in the contri-      ing is consistent with Lapere et al. (2021a) that evidenced the
bution of Santiago emissions to BC deposition on Andean            transport mechanism of pollutants from Santiago to the An-
glaciers in the vicinity of the capital city, Fig. 3 provides a    des in wintertime and revealed the critical role of mountain-
more detailed picture with glacier-by-glacier simulated BC         valley circulation in the Maipo River canyon. In compari-
deposition rates and relative contribution for that region. In     son, all of the major canyons seem to significantly channel
absolute value, deposition rates feature a large spatial hetero-   BC higher up in large amounts in summer (at least 50 % in
geneity in both seasons, with affected areas varying between       the vicinity of the white lines in Fig. 3c). In particular, in
summer and winter (Fig. 3a and b). In summertime, depo-            the area of the Mapocho River canyon, moderate BC deposi-
sition is larger on glaciers closer to Santiago and decreases      tion fluxes are found in July, originating mostly from outside
further away, with a smooth gradient both in the west–east         Santiago, whereas they are larger in January and mostly at-
and north–south directions. It reaches a maximum slightly          tributable to Santiago emissions. This finding is consistent
north of the city, along the Olivares River canyon and near        with Gramsch et al. (2020) that observed more transport of
the tip of the Mapocho River canyon, at more than 1 mg m−2         BC inside this canyon in summer than in winter.
per month for the month of January (red circles in Fig. 3a).          Variations in emissions alone do not account for the dif-
In winter, the BC deposition flux is spatially more erratic        ferences in summertime and wintertime deposition patterns.
(Fig. 3b), in line with the previous comment on emissions          The mountain-valley circulation being radiatively driven, it
being scattered across the region. Maximum values are ob-          is theoretically more intense in summer, thus implying more
tained near the south of Santiago, particularly near the tip       channeling of BC into the canyons, which provides a first
of the Maipo River canyon, where deposition rates rise up          additional driver for these differences. Nonetheless, this phe-
to 1 mg m−2 per month. Deposition hotspots are also found          nomenon does not account for the reversed gradient in the
further south in connection with the presence of other large       contribution of Santiago emissions (northward in summer,
urban areas along the Andes.                                       southward in winter, as observed in Fig. 3c and d) given that
   The more heterogeneous picture in wintertime is consis-         the magnitude of emissions changes between seasons in our
tent with the underlying time dynamics of deposition. In           modeling experiment, but the location of the largest sources
summer, the glacier-averaged BC deposition time series fea-        within the Santiago Basin remains consistent. Besides, based
tures a pronounced, smooth diurnal cycle, with a steady daily      on the findings of Lapere et al. (2021a), mountain-valley-
deposition rate varying between 2 and 7 µg m−2 d−1 for the         circulation-driven transport of BC should primarily affect

Atmos. Chem. Phys., 23, 1749–1768, 2023                                              https://doi.org/10.5194/acp-23-1749-2023

R. Lapere et al.: Export and deposition of BC on glaciers of central Chile                                                          1755

Figure 3. (a) Monthly accumulated BC deposition on glaciers (colored circles) for January 2015. Panel (b) same as (a) for July 2015. (c)
Relative contribution of emissions from Santiago to accumulated BC deposition on glaciers for January 2015. Panel (d) same as (c) for July
2015. White lines indicate the main canyons connecting Santiago to the glaciers. Map background layer: Imagery World 2D, © 2009 Esri.

lower-elevation glaciers. However, Fig. 5a shows that, be-             4000 m elevation, more than twice as large as compared with
tween 30 and 37◦ S, deposition strongly decreases with                 the lowest glaciers, showing that BC has the ability to deposit
glacier elevation in wintertime (blue line), whereas in sum-           on higher-elevation glaciers in that season unlike in winter-
mertime the vertical profile is more homogeneous (orange               time. Theses differences in the vertical profile do not stem
line – note that the x axis has a different scale). In sum-            from a statistical bias, since many glaciers are found both in
mertime, a maximum in the deposition rate is obtained near

https://doi.org/10.5194/acp-23-1749-2023                                                Atmos. Chem. Phys., 23, 1749–1768, 2023

1756                                                    R. Lapere et al.: Export and deposition of BC on glaciers of central Chile

Figure 4. Time series of dry (solid black line) and wet (solid blue line) deposition flux and deposition velocity (dashed gray line) in
(a) January and (b) July. Average over glacier-containing grid points within the area considered in Fig. 3.

altitude zones of high and low deposition rates in both sea-              Chile, along with precipitation (Falvey and Garreaud, 2007)
sons as shown in Fig. 5b.                                                 and therefore result in even less intense southwesterly winds
   The homogeneity of the summer vertical profile deposition              in winter. The aforementioned elements point to synoptic
(Fig. 5a) and the more homogeneous horizontal spatial dis-                winds playing a key role in the transport of BC from the ur-
tribution in summer than in winter (Fig. 3a) suggest that for             ban basin towards the Andes.
summer months, larger-scale atmospheric transport phenom-                    Simultaneously, cloud cover is mostly nonexistent above
ena are likely at play compared to winter, when erratically               Santiago in January with less than 10 % cloud cover on av-
occurring mountain-valley-circulation-driven export domi-                 erage, while July exhibits around 60 % cloud cover (color
nates the deposition flux. This idea is further investigated in           map in Fig. 6). Consequently, solar radiation fully reaches
Sect. 3.2.                                                                the ground in summertime, resulting in very active mountain-
                                                                          valley circulation. In contrast, surface radiation is smaller
                                                                          and more variable in wintertime, leading to a comparatively
3.2    Role of local and synoptic-scale circulation
                                                                          weaker and more erratic mountain-valley circulation and
Synoptic-scale circulation in the central zone of Chile is                by extension less BC export through this process. There-
driven by the position of the SPH, in conjunction with the                fore, in addition to synoptic winds, mountain-valley circu-
passage of migratory anticyclones regularly leading to the                lation also governs BC transport in summertime and super-
formation of coastal lows disrupting circulation for a few                imposes on large-scale motions. Otherwise, the large depo-
days (e.g., Garreaud et al., 2002). In particular, the contours           sition rates obtained in the chemistry-transport simulations
in Fig. 6 show that the SPH is located near 37◦ S, 90◦ W                  along the Maipo River canyon (Fig. 3a), which has a NW–
in January 2015 and 10◦ northward, near 27◦ S, 90◦ W, in                  SE orientation perpendicular to the synoptic wind direction,
July 2015. As a result, strong southwesterlies (at 10 m above             would not be observed if only the synoptic-scale played a
ground) along the Chilean coast blow at the latitude of San-              role. This synoptic–local-scale interaction is consistent with
tiago in January, whereas no dominant winds are observed                  Zängl (2009), for instance, who observed an influence of
in July in this area. This synoptic forcing leads to dominant             synoptic forcing on valley-wind circulation when the associ-
southwesterlies inland as far as Santiago (black box in Fig. 6)           ated direction matches the direction of the considered valley.
in January. The summertime synoptic wind direction is thus                Mountain-valley circulation is naturally stronger in summer-
consistent with the orientation of the Mapocho and Olivares               time regardless of cloud cover considerations, due to longer
canyons (Fig. 1) neighboring the glaciers where maximum                   days and smaller solar zenith angles. The difference in cloud
deposition and contribution from Santiago are observed in                 cover evidenced here thus exacerbates this phenomenon.
the chemistry-transport simulations at that period. These av-                Vertical wind profiles also advocate in favor of a strong
erage circulation conditions can be perturbed, especially in              contribution of synoptic forcing to wind conditions in Santi-
winter, by the passage of cold fronts and cut-off lows. These             ago, thereby influencing the export of BC. Based on ERA5
perturbations usually bring northwest–west winds to central               data, Fig. 7a reveals that the aforementioned SPH-generated

Atmos. Chem. Phys., 23, 1749–1768, 2023                                                     https://doi.org/10.5194/acp-23-1749-2023
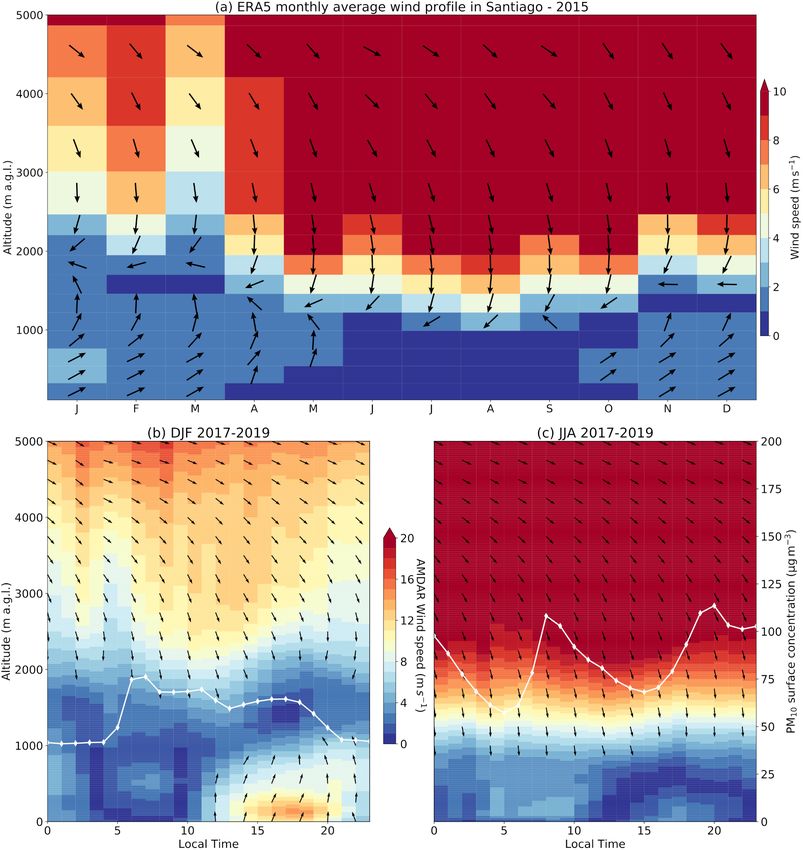
R. Lapere et al.: Export and deposition of BC on glaciers of central Chile                                                              1757

Figure 5. (a) BC accumulated deposition on glaciers between 30 and 37◦ S depending on their mean elevation. Average for January 2015
(orange line) and July 2015 (blue line). Colored shades show 1 standard deviation. Glaciers are clustered every 250 m of elevation. (b) Number
of glaciers for each model elevation bin (gray bars). In both panels, glacier elevation corresponds to the elevation of the model grid point
where the latitude–longitude coordinate of the glacier is found, according to WGMS and National Snow and Ice Data Center (2012).

Figure 6. Synoptic-scale circulation for (a) January and (b) July 2015. Contours indicate mean sea-level pressure (hPa), the color map
corresponds to cloud cover, and arrows show 10 m wind speed. The black area represents the Andes where elevation is higher than 2500 m.
The black box indicates the location of Santiago. Data from ERA5 single-level reanalysis (Copernicus Climate Change Service, 2017).

southwesterlies not only dominate near the surface but also              shear at the interface between the mixing layer and the free
throughout the mixing layer up to around 1500 m a.g.l.                   troposphere.
in summertime, with average wind speeds between 2 and                       Local measurements of wind profiles at the airport of San-
3 m s−1 . Above the mixing layer, a smooth transition towards            tiago (SCEL) from the AMDAR program for the period
stronger northerly– northwesterly winds of 6 to 8 m s−1 is ob-           2017–2019 reveal a picture consistent with ERA5 data and
served. The picture is different in wintertime: average wind             provide an additional dimension in terms of the evolution
speeds in the mixing layer up to 1000 m a.g.l. do not exceed             of the wind profile during the day. Figure 7b and c show
1 m s−1 and do not feature a dominant direction. Winds aloft,            the average daily cycle of wind speed (color map) and di-
however, are much stronger, well above 10 m s−1 , with a sim-            rection (arrows) profile in Santiago, averaged over DJF and
ilar direction as in summertime, and they create a strong wind           JJA, respectively. Although the comparison with ERA5 data

https://doi.org/10.5194/acp-23-1749-2023                                                  Atmos. Chem. Phys., 23, 1749–1768, 2023

1758                                                    R. Lapere et al.: Export and deposition of BC on glaciers of central Chile

Figure 7. (a) Monthly wind vertical profile in Santiago for 2010–2020. Colors indicate horizontal wind speed; arrows indicate the meteo-
rological direction of horizontal winds (i.e., upwards is southerly, rightward is westerly). Directions are displayed for average wind speeds
above 1 m s−1 only. Average of monthly means from ERA5 pressure-level reanalysis for the grid point located at 33.5◦ S, 70.75◦ W. (b)
Average daily cycle of wind vertical profiles in Santiago from AMDAR for DJF 2017–2019 (color map) and corresponding PM10 surface
concentration daily cycle (white line) at Parque O’Higgins (PQH) station (data from SINCA). Panel (c) same as (b) for JJA.

is not straightforward, similar patterns emerge with generally           paratively higher throughout the whole day in winter (white
lower wind speeds near the surface and a shallower bound-                line in Fig. 7c) but with weaker winds leading to less export.
ary layer in JJA. During the nighttime, DJF and JJA both ex-                Consistent with the conclusions drawn from ERA5 data,
hibit moderate to no wind near the ground up until 10:00 LT,             these local measurements also suggest that in wintertime
but in summertime wind speed starts to increase when solar               (JJA), there is no established wind within the boundary
radiation develops (up to more than 15 m s−1 ) in the after-             layer, which does not exceed 1000 m on average, thereby
noon, whereas in wintertime, wind speed decreases in the                 strengthening the accumulation and concentration of pollu-
daytime compared to the nighttime, reaching values between               tants (white line in Fig. 7c) and preventing their transport.
2 to 4 m s−1 on average. For summertime, wind speeds peak-               Contrarily, in summertime (DJF) afternoon winds are well
ing in the afternoon are critical when it comes to the export            established, blowing towards the Andes, and the deeper and
of pollutants, given that it is also a moment when the load of           more convective boundary layer also leads to a better venti-
pollutants in the urban atmosphere is high due to the accu-              lation of pollutants outside the urban area.
mulation of emissions during the day (white line in Fig. 7b).               These observations reinforce the idea that the summer-
This synchronicity signals an important export potential for             time BC export is governed by synoptic winds and mountain-
contaminants, especially given the direction of these after-             valley circulation combined, while only mountain-valley cir-
noon winds, which are southwesterlies, i.e., directed towards            culation drives the export in wintertime, with no synoptic
the Andes and its glaciers. Concentrations of PM10 are com-              component.

Atmos. Chem. Phys., 23, 1749–1768, 2023                                                     https://doi.org/10.5194/acp-23-1749-2023
R. Lapere et al.: Export and deposition of BC on glaciers of central Chile                                                        1759

Figure 8. Wind speed and direction distribution at (a) Parque O’Higgins (PQH – downtown Santiago), (b) Las Condes (CND – northeast
Santiago, near the entrance of the Mapocho canyon), (c) Puente Alto (PTA – southeast Santiago, near the entrance of the Maipo canyon),
and (d) San Jose de Guayacan (SJG – deep into the Maipo canyon). Wind roses display the distribution of hourly data for January and July
2015. Source SINCA for (a–c); source DMC for (d).

   Although the previous analysis is conducted on a sin-                 The observation at the PTA site near the Maipo River
gle data point, surface wind observations from the SINCA              canyon entrance (Fig. 8c) is similar: strong westerlies well
and DMC networks at different sites in the Santiago Basin             above 4 m s−1 dominate in January, and weaker winds form-
and inside nearby canyons show good agreement with the                ing a mountain-valley dipole are recorded in July. Nonethe-
proposed rationale for seasonal change in BC export. Fig-             less, for this location a summertime easterly component in-
ure 8 compares wind roses in January and July 2015 for four           dicative of down-valley winds is observed contrary to down-
sites (see Fig. 1): Parque O’Higgins (PQH) in the center of           town, thus evidencing the occurrence of mountain-valley ex-
the city (Fig. 8a), Las Condes (CND) in the northeast near            changes despite the dominance of synoptic westerlies.
the Mapocho River canyon entrance (Fig. 8b), Puente Alto                 The records show a different situation at PTA’s counterpart
(PTA) in the southeast near the Maipo River canyon entrance           site, CND, near the entrance of the Mapocho River canyon
(Fig. 8c), and San Jose de Guayacan (SJG) inside the merid-           (Fig. 8b). The mountain-valley dipole is observed both in
ional branch of the Maipo River canyon (Fig. 8d).                     January and July, with a shift from more frequent occur-
   In downtown Santiago (Fig. 8a), there is a clear dichotomy         rences of southwesterlies in January to more frequent north-
between January and July winds. January features a predom-            easterlies in July. This is consistent with the summertime
inant southwesterly component in wind direction, and wind             synoptic forcing being aligned with the axis of the canyon.
speeds frequently above 3 m s−1 . This is consistent with the         Nevertheless, both components of the dipole remain signifi-
synoptic forcing observed in Figs. 6 and 7. Wind speeds are           cant and wind speeds are in the same range for both seasons.
comparatively lower in July, rarely exceeding 2 m s−1 , and           The shift in the dominant wind direction explains the lim-
wind directions exhibit a clear southwesterly–easterly dipole         ited deposition flux in absolute and relative value observed in
consistent with mountain-valley circulation patterns of winds         July compared to January in the area of the Mapocho River
blowing towards the Andes during the day (westerlies) and             canyon (Fig. 3). In July, mostly down-valley winds (north-
back towards the urban basin during the night (easterlies).           easterlies) are observed with consequent wind speeds, thus
For this location however, there is no easterly component in          preventing the intrusion of BC into the canyon for a major-
January, meaning that mountain-valley circulation is inhib-           ity of the time. In January, wind conditions are the other way
ited by the strong synoptic winds.                                    around, thus favoring the transport of BC from Santiago into
                                                                      the canyon.

https://doi.org/10.5194/acp-23-1749-2023                                               Atmos. Chem. Phys., 23, 1749–1768, 2023
1760 R. Lapere et al.: Export and deposition of BC on glaciers of central Chile
Figure 9. Modeled 2-hourly BC deposition flux (colors) averaged on glaciers between 33 and 34◦ S as a function of modeled 10 m wind
speed (x axis) and wind direction (y axis) in downtown Santiago (33.5◦ S, 70.65◦ W) for (a) January and (b) July 2015. Gray histograms
indicate the density distribution of wind speed and direction on an arbitrary scale.
Wind speed data inside the canyons are available for only in Santiago, which dominate the circulation (gray histogram
one site, SJG, located in the meridional branch of the Maipo in Fig. 9). In winter, no clear predominant wind direction is
River canyon (Fig. 8d) so that a comparison with what oc- associated with deposition, consistent with more spread-out
curs in other canyons is not possible. Nonetheless, it is inter- wind directions and a more erratic advection. The contribu-
esting to observe that at the SJG site, northerlies greater than tion of the mountain-valley circulation is harder to illustrate,
5 m s−1 dominate the summertime winds, still with a signifi- given the diversity of orientations of canyon axes, causing
cant component from the south but related to moderate wind very diverse mountain-valley-associated wind directions.
speeds. In wintertime, northerlies are still the strongest winds In summary, chemistry-transport simulations, reanalysis
in terms of speed, but they are less frequent than southerlies and local observations consistently evidence and explain that
that occur the majority of hours, again associated with mod- (i) summertime conditions are more favorable for the export
erate wind speeds. Given the configuration of the canyon, of urban BC, explaining that despite lower emissions, deposi-
northerlies are associated with air masses coming from the tion rates on individual glaciers can be larger than in winter-
urban basin, thus bringing BC deep into the canyon as evi- time, and (ii) synoptic winds influence the summertime trans-
denced in Huneeus et al. (2021). These winds are the coun- port throughout the mixing layer, combining with mountain-
terpart of westerlies at PTA. As a result, Fig. 8d accounts valley circulation dynamics, while only the latter drives win-
very well for the larger contribution of Santiago emissions tertime deposition. Synoptic-scale southwesterlies in sum-
to BC deposition fluxes in summertime compared to win- mer enable the transport of the BC-containing, more convec-
tertime near the Maipo River canyon observed in Fig. 3c tive mixing layer air masses up to higher elevations. In par-
and d: the westerly-at-PTA–northerly-at-SJG combination is allel, mountain-valley circulation also favors the transport of
the most favorable for urban BC intrusions into the canyons BC through the canyon networks, in both summer and winter,
and is recorded more frequently in January than in July. Ab- although with a different intensity. The next section briefly
solute deposition fluxes in that area are still larger in winter explores whether and how this summertime–wintertime di-
than in summer on average, except near the Mapocho canyon chotomy could evolve under climate change and emission
(Fig. 3a and b). Advection conditions are more favorable scenarios.
in summer, but emissions are significantly larger in winter,
thus explaining the larger share from Santiago but generally 3.3 A glimpse at future trends
smaller absolute total in summer.
These observed winds and PM concentrations in Santiago Figure 10a shows the time series of future wind speed in
and their relation with deposition on glaciers can be further Santiago under the RCP2.6 and RCP8.5 scenarios, as down-
described using the modeled winds and BC deposition fluxes scaled within the CORDEX-CORE framework (see Sect. 2.2
in our simulations. On average for glaciers located between for details on the data and models used). In the context of
33 and 34◦ S, Fig. 9 shows the dependency of the BC de- the RCP2.6 scenario, the ensemble mean does not reveal a
position flux on surface wind speed and direction in Santi- significant trend (in the sense of a Mann–Kendall test) for ei-
ago. From this, it clearly appears that in summer maximum ther season (gray and black lines in Fig. 10a). Alternatively,
deposition occurs concurrently with strong southwesterlies the RCP8.5 scenario leads to significant trends (at the 99 %
level) in wind speed in January (+0.02 m s−1 per decade) and
Atmos. Chem. Phys., 23, 1749–1768, 2023 https://doi.org/10.5194/acp-23-1749-2023R. Lapere et al.: Export and deposition of BC on glaciers of central Chile 1761 Figure 10. (a) Times series of future monthly surface wind speed in Santiago under scenarios RCP8.5 (blue/green) and RCP2.6 (black/gray) for the months of July/January. Ensemble mean of six model realizations. Trends significant at the 99 % level based on a Mann–Kendall test are shown as a dashed line. Data from CORDEX-CORE taken at the grid point 33.5◦ S, 70.65◦ W. (b) BC emission scenarios for Santiago under the RCP8.5 (blue) and RCP2.6 (gray) scenarios. Data from the RCP database, averaged over the grid points between 33.25 and 33.75◦ S and 70.25 and 71.25◦ W. July (−0.03 m s−1 per decade). Although they are significant, terestingly, the scenario in which climate change is limited these computed trends are small and much smaller than the (RCP2.6) is associated with a lesser reduction in BC emis- ensemble standard deviation. As a result, the following anal- sions compared to the business-as-usual scenario (RCP8.5) ysis is by far uncertain but serves as an illustration of possible for Santiago, with almost no emissions at the end of the 21st futures. century in RCP8.5 but still more than 200 t yr−1 in RCP2.6 In the present-day climate, wind speeds in the Santi- at that time (Fig. 10b). This comparison is reversed at the ago area in CORDEX-CORE ensemble are higher in July global scale where BC emissions remain higher in RCP8.5 (2.6 m s−1 ) than in January (2.2 m s−1 ). In scenario RCP8.5, (not shown here). The reason for the RCP8.5 featuring fewer at the end of the century, average wind speeds become equiv- BC emissions than RCP2.6 is that the latter is a climate- alent in January and July (2.4 m s−1 ). In other words, based focused scenario where BC emission reductions are mostly a on the findings of Sect. 3.2, the summertime–wintertime di- co-product benefiting from policies on greenhouse gas emis- chotomy in BC export potential could be exacerbated in the sions, while the former assumes that in regions of the world future, with even more favorable conditions for export in with high exposure to atmospheric pollution, the effort is fo- summer and even less favorable export conditions in win- cused on designing stringent air quality policies (van Vuuren ter, assuming that, at the first order, BC transport is driven by et al., 2011). This category of regions comprises Santiago, surface wind in Santiago (as illustrated in Fig. 9). However therefore accounting for comparative trends in emissions in this can be moderated by changes in precipitation patterns, both RCP scenarios. which can lead to changes in scavenging and wet deposition, RCP emission scenarios do not provide intra-yearly detail. so that the previous inference is an idealized one. Neverthe- No information is available on whether the seasonal cycle of less, this illustrates that summertime emissions could matter emissions would change under such scenarios. Nevertheless, even more in the coming decades when it comes to BC de- the RCP8.5 climate scenario leads to increasing average tem- position on Chilean glaciers. peratures in the Santiago area, especially in winter months Along with climate, anthropogenic emissions of green- (e.g., Cabré et al., 2016). In that case, one could guess that house gases and pollutants also evolve in RCP scenarios. In- the need for residential heating would either slightly decrease https://doi.org/10.5194/acp-23-1749-2023 Atmos. Chem. Phys., 23, 1749–1768, 2023
1762                                                   R. Lapere et al.: Export and deposition of BC on glaciers of central Chile

Figure 11. (a) Relevance of the year 2015 for wind speed and PM2.5 in January (left) and July (right). Daily mean from hourly data from the
SINCA network, for five stations throughout central Chile (Andacollo, Viña del Mar, Parque O’Higgins, Rancagua and Talca – see Table 2
for their location). Each color shade corresponds to a different station. Data from 2015 (blue) is compared to data for the period 2012–2018
(orange) excluding 2015. (b) Relevance of January and July as representative of summertime and wintertime. Same data as (a), but orange is
now DJF (left) and JJA (right) and blue is January (left) and July (right).

or at most remain constant and therefore increase BC emis-              tertime, respectively. Figure 11a shows the mean daily sur-
sions, given the sensitivity to temperature of wood burning             face PM2.5 concentrations and wind speeds observed at five
for heating in Chile (Saide et al., 2016). Since the difference         stations throughout central Chile for the period 2012–2018
in BC emissions between summer and winter mostly stems                  in January (left) and July (right) and distinguishes between
from the contribution of this source, it is likely that under the       2015 (blue) and other years (orange). The envelope of wind
RCP8.5 scenario, the seasonality in BC emissions remains                speed and PM2.5 for 2015 is well contained within the enve-
similar or marginally decreases.                                        lope of the other years for both months. Similarly, Fig. 11b
   Consequently, despite currently larger regional BC depo-             shows that the PM2.5 concentrations and wind speeds in Jan-
sition fluxes on glaciers in wintertime, summer could likely            uary and July, for the period 2012–2018, are not different
become an equally important season in the future in this re-            from DJF and JJA conditions, respectively. Therefore, Jan-
spect.                                                                  uary and July 2015 are typical months, representative of sum-
                                                                        mertime and wintertime conditions, respectively.
4   Discussion
                                                                           The El Niño–Southern Oscillation (ENSO) can affect
                                                                        atmospheric circulation in central Chile. In particular, El
In this work, the year 2015 only was considered for the simu-           Niño and La Niña phases are related to above-average and
lation of BC deposition fluxes. Figure 11 illustrates the rele-         below-average rainfall, respectively, in winter (Montecinos
vance of choosing January and July 2015 as representative of            and Aceituno, 2003). ENSO also modulates wind speeds in
pollution and transport conditions in summertime and win-               coastal central Chile by affecting the position of the south-

Atmos. Chem. Phys., 23, 1749–1768, 2023                                                    https://doi.org/10.5194/acp-23-1749-2023
R. Lapere et al.: Export and deposition of BC on glaciers of central Chile 1763 eastern Pacific anticyclone, leading to generally decreased choice. However, Beegum et al. (2020) for example showed alongshore winds during El Niño and increased ones during that the compared performance of both deposition schemes La Niña (Rahn and Garreaud, 2014). However, this telecon- available in CHIMERE depends on the season and location nection between ENSO and atmospheric circulation in cen- considered. Thus, including a second set of simulations with tral Chile seems to have weakened during the particular con- the other deposition scheme would not result in more confi- text of the 2010–2018 mega-drought (Garreaud et al., 2020). dent results. Only extensive comparisons with observations, Therefore, it is difficult to discuss whether the recorded onset which are not available, could constrain the uncertainty of of a strong El Niño phase around April–May 2015 affects the the model. relevance of the July 2015 results presented here on longer The accuracy of dry-deposition fluxes relies on a proper timescales. However, the previous discussion on observed representation of surface properties such as slope, albedo or wind speeds and PM2.5 concentrations (Fig. 11) supports the roughness. The areas of interest are located in steep terrain, hypothesis that 2015 conditions were not exceptional with with large subgrid-scale variability in terms of these three respect to the surrounding years in terms of the transport of properties. We acknowledge that biases may thus arise in the aerosols. model, but the nonexistence of measurements of such param- The chemistry-transport simulations used in this work eters in the region prevents validation, although their magni- were performed with a 5 km resolution domain. Given the tudes appear to be realistic. The roughness length of glaciers steep topography of the region, the subgrid variability in el- in our simulations is taken around a few millimeters, con- evation is large at that scale. The altitude of the glaciers as sistent with the usual magnitudes for ice- and snow-covered represented in the model might thus be too low compared ground (e.g., Fitzpatrick et al., 2019). The end-of-summer to reality due to the grid-point averaging. This may result in albedo of glaciers of the central Chilean Andes is between excessive deposition fluxes, especially in wintertime when 0.2 and 0.6 (Shaw et al., 2021), consistent with the mean deposition is found to be altitude-dependent. Over the 845 0.33 in our WRF-CHIMERE runs. In wintertime this average glaciers found in the simulation domain, the comparison with reasonably increases to 0.72 due to additional snow cover, data from WGMS and National Snow and Ice Data Center consistent with Malmros et al. (2018). Finally, the slope of (2012) yields a mean bias of −287 m in the model, asso- the largest glaciers in central Chile is comprised between 15 ciated with a normalized root-mean-square error (NRMSE) and 25◦ (Shaw et al., 2021), which is likely reasonably cap- of 11 % and a Pearson correlation coefficient of 0.85. Thus, tured by the large subgrid-scale orography variance in WRF the glaciers’ altitudes are reasonably well reproduced by the over the Andes. Also, wet-deposition processes are highly model, and the bias induced by the representation of the to- dependent on the proper representation of precipitation in pography is not expected to affect the results. WRF over complex terrain in our simulations. This is known Another large source of uncertainty in the simulations to have relatively poor performance, although at sufficiently stems from the BC emission fluxes. The HTAP inventory is high resolution, it is possible to capture the main characteris- static as of 2010 and with a relatively coarse resolution com- tics of seasonal precipitation over the Central Andes (Schu- pared to the processes studied in this work. Simulated PM2.5 macher et al., 2020). concentrations could not be extensively validated across the It is worth noting that deposition fluxes of BC obtained domain except for a few cities where automated air quality with CHIMERE are in line with or above modeled fluxes in monitoring networks are present, and no validation on the the Tibetan Plateau (Ji, 2016) and comparable to the results BC fraction of PM2.5 could be performed either (see Lapere of measurement campaigns on specific glaciers in that same et al., 2021b, for more detail on the validation). As a result, region (Wang et al., 2017; Yan et al., 2019). However, this BC deposition fluxes presented in this work are to be un- region receives comparatively greater attention from the re- derstood as indicative of the order of magnitude rather than search community. The deposition fluxes in Ji (2016) over the precise estimates of the actual fluxes. Tibetan Plateau, lower than what we found for the Chilean Deposition is among the most uncertain processes in Andes, were estimated to correspond to a radiative forcing chemistry-transport models. Consequently, there is a sig- of 3 to 6 W m−2 . A quantitative comparison between the two nificant margin for error in the deposition fluxes obtained very different regions cannot be carried out here and only and presented in Sect. 3.1. However, a comparison of dry- 2 months are considered so that the cumulative effect of BC deposition rates simulated by the model and measured by deposition cannot be assessed. Also, there is a lack of infor- Rowe et al. (2019) for one snowy site in the Andes near mation on snow properties in the model for the proper eval- Santiago in winter results in good agreement between both uation of BC radiative effect in snow and ice. Nevertheless, (Lapere et al., 2021a). Although this is only for one site qualitatively this might point to possibly larger impacts on due to lack of more available data, this comparison gives glaciers of the Central Andes than the 1.4 W m−2 first es- confidence in the model’s ability to represent deposition in timated in Rowe et al. (2019). The radiative impact of BC this topographically complex area. Conducting multiple sim- on snow and ice, however, strongly depends on several char- ulations, using different deposition parameterizations, could acteristics of the snowpack, which are not available in our help estimate the variability of our results related to this model, and might greatly change between the two regions of https://doi.org/10.5194/acp-23-1749-2023 Atmos. Chem. Phys., 23, 1749–1768, 2023
You can also read