ProbFire: a probabilistic fire early warning system for Indonesia
←
→
Page content transcription
If your browser does not render page correctly, please read the page content below
Nat. Hazards Earth Syst. Sci., 22, 303–322, 2022
https://doi.org/10.5194/nhess-22-303-2022
© Author(s) 2022. This work is distributed under
the Creative Commons Attribution 4.0 License.

ProbFire: a probabilistic fire early warning system for Indonesia
Tadas Nikonovas1 , Allan Spessa1 , Stefan H. Doerr1 , Gareth D. Clay2 , and Symon Mezbahuddin3
1 Department of Geography, Swansea University, Swansea, SA2 8PP, UK
2 Department of Geography, University of Manchester, Manchester, M13 9Pl, UK
3 Department of Renewable Resources, University of Alberta, Edmonton, Alberta T6G 2E3, Canada

Correspondence: Tadas Nikonovas (tadas.nik@gmail.com)

Received: 16 August 2021 – Discussion started: 20 September 2021
Revised: 6 December 2021 – Accepted: 22 December 2021 – Published: 4 February 2022

Abstract. Recurrent extreme landscape fire episodes associ-       1   Introduction
ated with drought events in Indonesia pose severe environ-
mental, societal and economic threats. The ability to predict
severe fire episodes months in advance would enable rele-         Recurrent severe fires in Indonesia release globally signifi-
vant agencies and communities to more effectively initiate        cant amounts of greenhouse gases and particulate matter into
fire-preventative measures and mitigate fire impacts. While       the atmosphere. Emitted toxic haze can shroud the region for
dynamic seasonal climate predictions are increasingly skilful     several months (Marlier et al., 2013), with devastating im-
at predicting fire-favourable conditions months in advance        pacts on people’s health and livelihoods (Crippa et al., 2016;
in Indonesia, there is little evidence that such information is   H. H. Lee et al., 2017), whilst also damaging local ecosys-
widely used yet by decision makers.                               tems and biodiversity (B. P. Lee et al., 2017). Every year,
   In this study, we move beyond forecasting fire risk based      during the dry season, fire is widely used for land clear-
on drought predictions at seasonal timescales and (i) de-         ing and in agriculture across the archipelago. In some years,
velop a probabilistic early fire warning system for Indone-       however, anomalously severe droughts do develop, triggering
sia (ProbFire) based on a multilayer perceptron model using       catastrophic uncontrolled burning events. Two of the biggest
ECMWF SEAS5 (fifth-generation seasonal forecasting sys-           such episodes, the 1997–1998 and 2015 events each released
tem) dynamic climate forecasts together with forest cover,        0.81–2.57 (Page et al., 2002) and 0.21–0.53 Tg C (Huijnen
peatland extent and active-fire datasets that can be operated     et al., 2016; Yin et al., 2016), equivalent to 12 %–40 % and
on a standard computer; (ii) benchmark the performance of         2 %–5 % of total global carbon emissions for the year, re-
this new system for the 2002–2019 period; and (iii) evaluate      spectively (Boden et al., 2017). Increasingly skilful seasonal
the potential economic benefit of such integrated forecasts       climate predictions by dynamic forecasting systems (Doblas-
for Indonesia.                                                    Reyes et al., 2013; Johnson et al., 2019) can potentially be
   ProbFire’s event probability predictions outperformed          utilized in early warning systems, helping to prepare for and
climatology-only based fire predictions at 2- to 4-month lead     mitigate the worst of the damaging burning events. How-
times in south Kalimantan, south Sumatra and south Papua.         ever, relevant non-climatic drivers of fire occurrence have to
In central Sumatra, an improvement was observed only at           date not been integrated with seasonal climate predictions,
a 0-month lead time, while in west Kalimantan seasonal pre-       leaving an untapped potential for improving early fire event
dictions did not offer any additional benefit over climatology-   prediction systems. Furthermore, evaluation of the potential
only-based predictions. We (i) find that seasonal climate fore-   value of such predictions for the decision makers in the re-
casts coupled with the fire probability prediction model con-     gion has not yet been carried out to date.
fer substantial benefits to a wide range of stakeholders in-         In recent decades, Indonesia’s fire problem has been ex-
volved in fire management in Indonesia and (ii) provide a         acerbated by non-climatic drivers such as commodity-driven
blueprint for future operational fire warning systems that in-    loss and degradation of primary forests (Turubanova et al.,
tegrate climate predictions with non-climate features.            2018), drainage of peatlands (Hooijer et al., 2012), and con-
                                                                  version of land to industrial plantations and small-holder

Published by Copernicus Publications on behalf of the European Geosciences Union.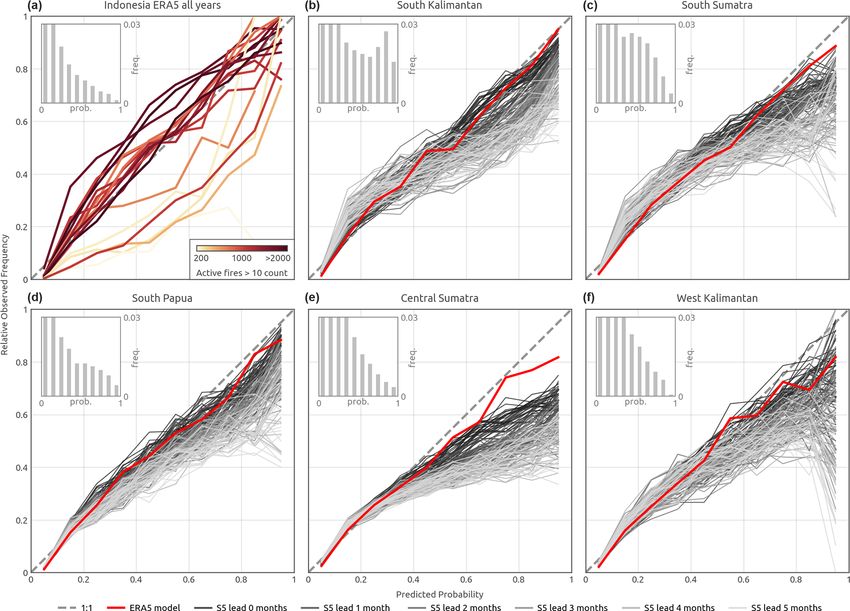
304                                   T. Nikonovas et al.: ProbFire: a probabilistic fire early warning system for Indonesia

agriculture (Miettinen et al., 2012). Loss of fire-resilient       up to a few months in advance (Spessa et al., 2015; Shawki
closed-canopy forests (Cochrane et al., 1999; Nikonovas et         et al., 2017). However, these previous efforts did not integrate
al., 2020) has resulted in more severe local fire weather due      non-climate information into fire activity prediction models
to increased surface heating and substantially warmer micro-       and had only aggregated regional resolution.
climates in the deforested landscapes (Sabajo et al., 2017).          The climate–fire relationship in Indonesia is strongly reg-
In peatlands, fire presence was also increased by artificially     ulated at finer spatial scales by human-driven rapid transfor-
lowered water table depth due to extensive drainage, which,        mation of land cover in Indonesia, particularly in peatland
in combination with increased surface heating, has exposed         ecosystems (Miettinen et al., 2012; Turubanova et al., 2018;
more peat to desiccation (Jauhiainen et al., 2014) and the         Nikonovas et al., 2020). As such, land cover change and for-
establishment of fire-prone herbaceous vegetation in defor-        est fragmentation are critical ingredients for predicting fire
ested areas (Hoscilo et al., 2011). These factors, coupled with    activity in Indonesia. No studies have assessed how well the
widespread use of fire by humans for land clearing and crop        skill of seasonal drought prediction at regional scales trans-
rotation (Cattau et al., 2016), have dramatically amplified        lates to fire activity forecasting at fine spatial scales, which
drought sensitivity of fire activity across the region.            would add value to potential users of the forecasts such as
   The duration and severity of the dry season in different        fire managers, forest conservationists and peatland protection
parts of the Indonesian archipelago is modulated by interac-       agencies. While the integration of non-climate information
tions between atmospheric processes associated with interan-       datasets, development of high-spatial-resolution probabilis-
nual irregular oscillations in sea surface temperature anoma-      tic forecasting models and long-term performance validation
lies in the Pacific and Indian oceans. Drier-than-normal           have been identified by the previous studies as key require-
conditions across Indonesia are generally associated with          ments for building future early warning systems and increas-
cooler-than-normal sea surface temperatures (SSTs) which           ing the usability of the seasonal climate information in fire
occur during a strong positive El Niño–Southern Oscillation        management (Spessa et al., 2015; Chen et al., 2016; Turco et
(ENSO) event (El Niño) and/or positive phase of the Indian         al., 2018), these challenges have not yet been addressed.
Ocean Dipole (IOD) cycle. Reduced precipitation in south              This study aims to (i) move beyond seasonal forecasting of
Sumatra, south Kalimantan and south Papua are typically            fire activity solely as a function of climate variables, (ii) pro-
linked to El Niño events, while dry conditions in northern         vide a blueprint for future operational landscape-scale fire
central Sumatra tend to coincide with a positive IOD phase         forecasting systems and (iii) evaluate the system from a po-
(Aldrian and Dwi Susanto, 2003; Field and Shen, 2008; Field        tential user’s perspective in terms of skill and economic util-
et al., 2016). While the most severe droughts and widespread       ity. Specifically, we developed a probabilistic early fire warn-
burning do occur when both El Niño and IOD are in positive         ing system (ProbFire) for Indonesia that integrates informa-
phases (Reid et al., 2012; Pan et al., 2018), short droughts and   tion from ECMWF SEAS5 (fifth-generation seasonal fore-
associated burning events can also develop in neutral ENSO         casting system) seasonal climate forecasts and non-climate
and IOD years, triggered by events such as the dry phase of        datasets and produces probabilistic fire event predictions at
the Madden–Julian Oscillation (Gaveau et al., 2014; Oozeer         0.25◦ spatial resolution with monthly time steps. ProbFire
et al., 2020).                                                     performance was assessed using MODIS active-fire observa-
   The chaotic nature of atmospheric circulation (Lorenz,          tions during the 2002–2019 period. To assess the added value
1963) prevents reliable numerical weather prediction beyond        of SEAS5 seasonal forecasts, the ERA5 climatology-based
a couple of weeks (Bauer et al., 2015). Nonetheless, cur-          model was used as a benchmark. In addition to evaluating
rent state-of-the-art dynamic seasonal forecasting systems         model skill at predicting observed fire occurrences, we also
show skill in seasonal prediction of 2 m air temperature and       assessed the economic value and benefits of ProbFire predic-
precipitation, especially in tropical regions (Doblas-Reyes        tions for potential stakeholders in Indonesia and beyond.
et al., 2013; Johnson et al., 2019). The predictability of
these chaotic weather parameters at monthly timescales is at-
tributable to an increasingly realistic representation of slowly   2     Data
evolving SST anomalies associated with the ENSO and IOD
variability in seasonal climate forecasting systems (Stock-        2.1    Fire activity data
dale et al., 1998; Johnson et al., 2019; Fan et al., 2020;
Lavaysse et al., 2020).                                            As a proxy for fire activity across Indonesia this study used
   Global assessments of seasonal predictability of fire activ-    the Collection 6.1 active-fire dataset MCD14ML (Giglio et
ity have shown that climate information from dynamic mod-          al., 2016) based on Moderate Resolution Imaging Spec-
els (Turco et al., 2018) and observed sea surface temperature      troradiometer (MODIS) imagery at thermal wavelengths.
anomalies (Chen et al., 2016, 2020) can be used to skilfully       The product contains centre coordinates of MODIS pixels
predict fire occurrence across different regions, including In-    (∼ 1 km2 at nadir, ∼ 10 km2 at the extreme sensor view edge)
donesia. Other studies focused on Indonesia have demon-            which were flagged as active fires by the thermal-anomalies
strated that anomalous drought conditions can be predicted         algorithm.

Nat. Hazards Earth Syst. Sci., 22, 303–322, 2022                                    https://doi.org/10.5194/nhess-22-303-2022
T. Nikonovas et al.: ProbFire: a probabilistic fire early warning system for Indonesia                                            305

Figure 1. Study region showing total MODIS active-fire counts for the 2002–2019 period at 0.25◦ resolution. Also shown are the bounding
boxes of the sub-regions used in the study.

   The MCD14ML product has been shown to perform well                 have any active fires for the given month. Active-fire counts
in detecting large fire events and to have a low false-alarm          for the grid cells with fire detections (∼ 20 % of the dataset)
rate. Validation of the product for the equatorial Asia re-           were highly skewed, with the majority containing very few
gion indicated 8 % error of commission (Giglio et al., 2016).         detections, while the relatively low number of grid cells had
Low levels of false detections were also confirmed during the         very high monthly fire counts (up to ∼ 2500). Approximately
2013 burning episode in north Riau, where 96 % of MODIS               three-quarters of the grid cells with active-fire detections had
active-fire pixels were found to fall within the burned-area          1–10 fire pixels, while the remaining upper quartile (5 % of
extent estimated using higher-resolution imagery (Gaveau et           the total dataset) had > 10 active-fire detections per month.
al., 2014). Omission errors for small fires of the MODIS              Importantly, while the number of grid cells having a low
active-fire product are inevitably high due to the relatively         active-fire pixel count (1–10) show a clear pattern of Indone-
coarse spatial resolution of the sensor (pixel size of 500 m at       sia’s dominant dry season (Aldrian and Dwi Susanto, 2003),
nadir). For fires over 0.125 km2 in size, the estimated omis-         there are only small differences when comparing the fire grid
sion error was 10 %, while for fires of 0.250 km2 or larger,          cell counts for different years (Fig. 2a). In contrast, the num-
the omission error was below 5 % (Giglio et al., 2016). Al-           ber of the top quartile of all fire-containing grid cells varied
though low-temperature smouldering peatland fires are gen-            considerably more between years. Total active-fire counts de-
erally more difficult to detect using thermal-anomalies algo-         picted in Fig. 2b exhibit even greater interannual variability
rithms (Giglio et al., 2016), such fires typically have long          indicating that most of the region’s fire impacts can be at-
residence times, and as a result detection probability in-            tributed to the grid cells containing > 10 fire pixels.
creases with each satellite overpass. In any case, omission              The main objective of ProbFire is to predict the probability
of small fires in the product is not critical for early warn-         that the monthly active-fire count will exceed a given thresh-
ing systems aimed at alerting the risk of unusually high-fire-        old. We present results of predicting both the monthly active-
activity events, rather than quantify fire effects such as fire-      fire count of > 0 cases (20 % of the dataset) and the monthly
affected area. A recent study comparing fire emission inven-          active-fire count of > 10 cases (5 % of the dataset); our anal-
tories based on MODIS burned-area and active-fire datasets            ysis focuses on the latter class. While prediction of increas-
for Indonesia showed that active-fire-based emission mod-             ingly rare events is a more challenging problem, it is also a
els reproduce regional aerosol optical thickness more accu-           more important one due to the greater impacts that such fire
rately when compared to burned-area methods, resulting in             events have.
a smaller underestimation of fire activity in extreme burning
years (Liu et al., 2020).                                             2.2   Climate variables

Fire occurrence patterns in Indonesia and prediction                  This study used three climatic variables as inputs for pre-
objective                                                             diction of fire activity in Indonesia: total precipitation, air
                                                                      temperature and relative humidity. These climate indicators
The MODIS active-fire detections were aggregated to a                 are strongly linked to fire occurrence and as a result are
0.25◦ spatial grid and monthly time step. Monthly active-fire         widely used as key inputs for calculating various fire dan-
counts were used both as model training targets and for pre-          ger indices (van Wagner and Forest, 1987; Dowdy et al.,
diction validation. Most of the grid cells (∼ 80 %) did not           2009). The variables were obtained from the European Cen-

https://doi.org/10.5194/nhess-22-303-2022                                       Nat. Hazards Earth Syst. Sci., 22, 303–322, 2022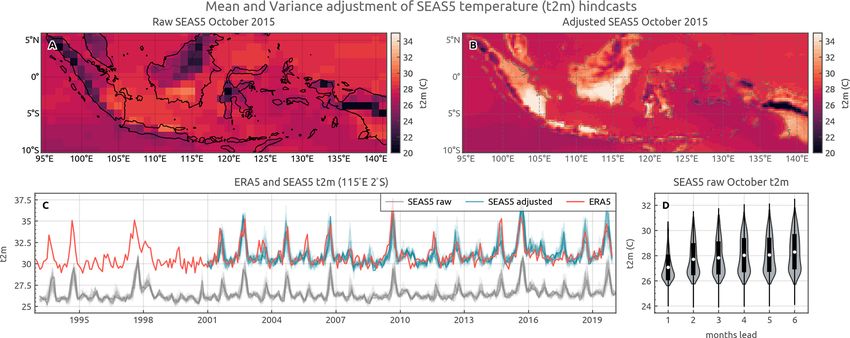
306                                      T. Nikonovas et al.: ProbFire: a probabilistic fire early warning system for Indonesia

Figure 2. MODIS active-fire record for Indonesia during the 2002–2019 period. (a) Percentage of total land grid cells in the study region
(n = 2080) with active-fire detections. The two categories shown are for grid cells with relatively low fire counts (1–10 fire pixels per month)
and a higher degree of fire presence (> 10 fire pixels) in blue and red colours, respectively. (b) Total monthly MODIS active-fire counts
attributable to grid cells of the two categories.

tre for Medium-Range Weather Forecasts (ECMWF) grid-                      and we also used term forecasts in describing SEAS5 data
ded reanalysis and long-range forecasts products distributed              from both hindcast and forecast periods. The spatial resolu-
via the Copernicus Climate Change Service. For model train-               tion of the SEAS5 product was 1◦ , while the temporal step
ing, validation and computing climatological values we em-                was 1 month.
ployed the ECMWF’s ERA5 reanalysis dataset, while for                        While the mean 2 m temperature was readily available and
predictions of fire occurrence probability at 0- to 5-month               total monthly precipitation was simply calculated from pre-
lead times we have used ECMWF’s SEAS5 long-range fore-                    cipitation rates given in the respective ERA5 and SEAS5
casting model simulations.                                                products, relative humidity was derived from the 2 m temper-
   ERA5 is the latest version of ECMWF reanalysis products.               ature and 2 m dew point temperature using August–Roche–
It is based on the centre’s Integrated Forecast System’s cou-             Magnus approximation (Alduchov and Eskridge, 1996):
pled atmosphere–ocean model simulations constrained with
                                                                                            17.625td
many assimilated satellite-based and in situ observational                           exp 243.04+t   d
datasets (Hersbach et al., 2020). The ERA5 product used in                RH = 100                   ,                           (1)
                                                                                            17.625t
this study has a regular longitude–latitude grid with a 0.25◦                         exp 243.04+t
spatial resolution and 1-hourly time step. We have resampled              where RH is relative humidity, td is the 2 m dew point tem-
the ERA5 weather parameters to monthly values by comput-                  perature and t is the 2 m temperature. In total, we used eight
ing the monthly mean 2 m temperature, mean monthly 2 m                    climate features as inputs into ProbFire: total monthly pre-
relative humidity and total monthly precipitation.                        cipitation, total monthly precipitation for the 5 preceding
   SEAS5 is the fifth-generation ECMWF seasonal forecast-                 months (t − 1 to t − 5), mean monthly temperature and mean
ing system and has been operational since 2017 (Johnson                   monthly relative humidity. Precipitation for 5 months pre-
et al., 2019). The system consists of 51 ensemble members                 ceding the month of interest was included to characterize
which are initialized on the first day of every month and                 long-term build-up of drought conditions, and the number of
simulate the state of the atmosphere for a 7-month period.                months was determined empirically during the model opti-
The individual ensemble members are initialized using per-                mization stage.
turbed initial conditions and atmospheric model parameters
to represent uncertainties associated with the initial state and          SEAS5 bias and variance adjustment
missing or misrepresented model processes. While the sys-
tem consists of 51 ensemble members when operated in fore-                Raw SEAS5 model ensemble forecasts, like any other long-
casting mode (since 2017), for the years prior to 2017 the                range climate modelling system outputs, are affected by sys-
SEAS5 system was initialized using only 25 members pro-                   tematic model biases and drift, and, as a result, forecast
ducing climate hindcasts (alternatively termed reforecasts)               climatology (for example long-term mean and variance) is
for the period covering 1981–2016. In this study, we used the             often significantly different from the observed climatology
same subset of 25 SEAS5 members which were available for                  (Doblas-Reyes et al., 2013; Johnson et al., 2019). Further-
the whole of the study period covering 2002 through 2019,                 more, publicly available SEAS5 forecasts have a spatial res-
                                                                          olution of 1◦ and consequently cannot represent local con-

Nat. Hazards Earth Syst. Sci., 22, 303–322, 2022                                             https://doi.org/10.5194/nhess-22-303-2022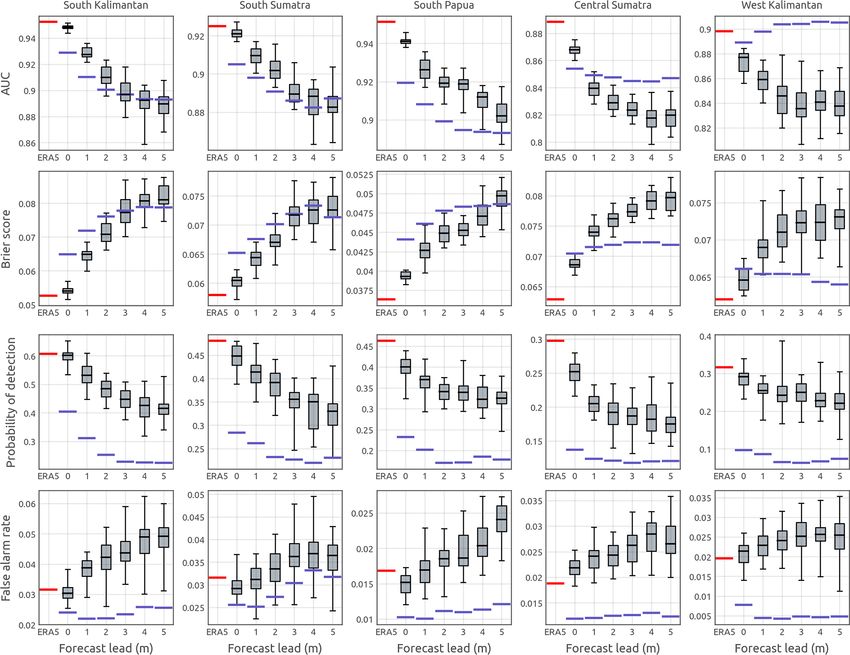
T. Nikonovas et al.: ProbFire: a probabilistic fire early warning system for Indonesia                                        307

ditions well, particularly in coastal and mountainous areas       2016). Frequent fires prevent forest regrowth, and the land-
(Fig. 3).                                                         scape becomes dominated by flammable grasses (Hoscilo et
   To address SEAS5 biases and to downscale SEAS5 hind-           al., 2011). The positive feedback between fire and vegetation
casts to match the spatial resolution of the ERA5 reanaly-        means that areas which did experience burning in the past
sis (0.25◦ ), we performed a mean and variance adjustment         are more likely to burn again. To represent fire occurrence
(MVA) of the raw SEAS5 outputs. The method has been               in previous years as a model input, the maximum monthly
extensively applied in seasonal forecasting (Barnston, 1994;      active-fire detection count for each 0.25◦ grid cell in the years
Doblas-Reyes et al., 2005) and has been shown to have sim-        preceding the prediction year was used.
ilar performance when compared to more complex and com-              We used two different active-fire products to cover past fire
putationally intensive methods (Manzanas et al., 2019).           observations for all years in the study period (2002–2019).
   The MVA was applied in two steps. First, the raw SEAS5         The MODIS active-fire record was extended beyond 2002
forecast data at 1◦ resolution were re-gridded to match the       with Along Track Scanning Radiometer (ATSR) World Fire
0.25◦ resolution of the ERA5 reanalysis data using nearest-       Atlas (WFA) nighttime fire monthly counts for the 1997–
neighbour interpolation. Second, the mean and variance of         2001 period. This was done to reduce the impact of the lack
monthly hindcasts for each SEAS5 ensemble member were             of past fire observations for the first few years in the study
transformed to match those ERA5 values of the 1993–2019           period on the model performance. The ATSR WFA night-
period for that grid cell following Eq. (2):                      time fire product contains several times fewer active-fire de-
                         σ                                      tections when compared to the MODIS product due to a
                              o
fcorm,t = frawm,t − y t         + ot ,                   (2)      lack of daytime retrievals (Arino et al., 2012), and as a re-
                            σf                                    sult, pre-2002 maximum monthly counts are underestimated
                                                                  when compared to the MODIS estimates. However, this step
where fcorm,t and frawm,t are the mean-and-variance-
                                                                  was important to identify areas affected by the 1997–1998 El
adjusted and raw SEAS5 hindcast ensemble member m for
                                                                  Niño event and the associated fire episode which was one of
month t, y t is the SEAS5 ensemble mean of all times t,
                                                                  most severe in Indonesia’s history (Page et al., 2002).
ot is the ERA5 mean for month t, σo denotes the ERA5
standard deviation, and σf is the SEAS5 ensemble stan-
                                                                  2.3.2   Forest cover features
dard deviation for the calibration period (Fig. 3). The cali-
bration period was 1993–2019, as determined by the avail-
                                                                  Loss and degradation of primary-forest cover in recent
ability of both the SEAS5 hindcasts and ERA5 reanalysis
                                                                  decades has been closely associated with an increase in fire
on the Copernicus Climate Change Service system (https:
                                                                  occurrence in the region (Langner and Siegert, 2009; Field et
//cds.climate.copernicus.eu, last access: 31 January 2022).
                                                                  al., 2016). Undisturbed humid primary forests in Indonesia
2.3     Non-climate variables                                     are extremely fire-resilient (Cochrane et al., 1999; Nikono-
                                                                  vas et al., 2020) and can resist ignition even during pro-
In addition to the climate variables, we used environmental       longed droughts. By contrast, industrial plantations and agri-
features which are closely associated with fire occurrence in     cultural land, which are replacing primary forests, have sub-
the region. These datasets were per-grid-cell peatland extent,    stantially higher fire activity rates (Nikonovas et al., 2020).
past fire activity, primary-forest cover extent, primary-forest   We used two high-resolution Landsat data-based tree cover
loss in the previous year and secondary-forest loss in the pre-   datasets used to represent changes in forest cover during the
vious year (described in detail in the following paragraphs).     study period at 0.25◦ spatial resolution and at an annual time
In contrast to climate features which had a monthly time step,    step. A co-located analysis of primary-forest cover extent
all the environmental features had an annual time resolution      in the year 2000 (Margono et al., 2014) and version 1.6 of
except for peatland extent, which was fixed for the whole         the dataset of global annual forest cover loss (Hansen et al.,
study period. While numerous other sources of potential fea-      2013), which covers 2001 to 2018, was performed to de-
ture data exist, they were not selected because they did not      termine annual primary-forest cover fraction, primary-forest
cover the whole of Indonesia for the full study period and/or     loss and secondary-forest loss. Pixels classed as primary for-
did not have at least an annual time step. This last criterion    est in the year 2000 were matched with the pixels for an-
was particularly important for determining the selection of       nual forest loss for the years 2001–2018. Firstly, we deter-
datasets because the fire prediction model was built to form      mined if the estimated forest loss had occurred in primary- or
the basis for an operational early fire warning system.           secondary-forest areas. Secondly, primary-forest cover loss
                                                                  for each year was derived by subtracting cumulative primary-
2.3.1    Past fire activity                                       forest loss from the year 2000 primary-forest extent estimate.
                                                                  Following these two steps, the annual primary-forest cover,
In many parts of the region, in deforested and unmanaged          primary-forest loss and secondary-forest cover loss estimates
peatlands in particular, the fire return interval is short due    at the Landsat pixel level were aggregated to the study’s
to frequent repeated anthropogenic burning (Cattau et al.,        0.25◦ resolution.

https://doi.org/10.5194/nhess-22-303-2022                                  Nat. Hazards Earth Syst. Sci., 22, 303–322, 2022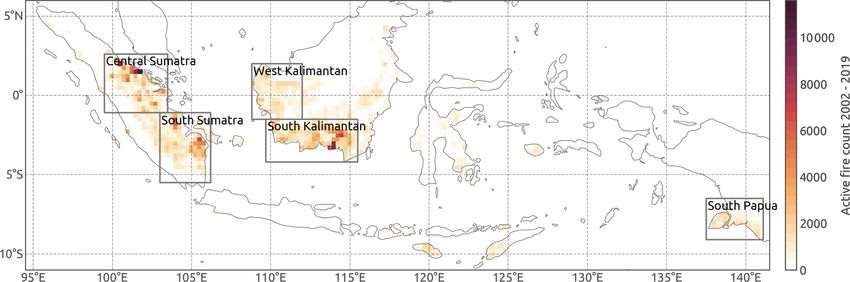
308                                   T. Nikonovas et al.: ProbFire: a probabilistic fire early warning system for Indonesia

Figure 3. Illustration of mean and variance adjustment applied to raw SEAS5 ensemble member forecasts. (a) Raw SEAS5 member of 1 for
temperature at 2 m (t2m) for October 2015 with a lead time of 2 months. (b) October 2015 mean-and-variance-adjusted 2 m temperature of
the same SEAS5 member based on calibration against overlapping 1993–2019 series between the ERA5 reanalysis and SEAS5 forecasts.
(c) SEAS5 ensemble member raw and bias-adjusted and ERA5 2 m temperature at the 115◦ E, 2◦ S location for the 1993–2019 period (bias-
corrected SEAS5 is only shown for the study period 2002–2019). (d) Mean SEAS5 member 2 m temperature for all October months in the
record for different lead times, showing ensemble mean drift (warming in this case) and increasing spread.

   Definitions of forest cover and primary forests in this study     sult, the region’s peatlands experience fire occurrence rates
follow the definitions given in the global forest cover loss         up to several times higher when compared to non-peatlands
and primary-forest extent of the year 2000 products. Both            (Vetrita and Cochrane, 2020; Nikonovas et al., 2020). To rep-
datasets considered all Landsat pixels with a tree height of         resent elevated fire activity in peatland areas we estimated
> 5 m and canopy cover of > 30 % as forest cover. Primary            the peatland fraction in the 0.25◦ grid cells using the high-
forest was defined as a contiguous block of > 5 ha of nat-           resolution vector maps of peatland distribution and carbon
ural forest which has not been cleared in recent decades.            content by Haryono et al. (2011). The vector maps were ras-
Note that the definition of primary forest includes both             terized to a 0.01◦ grid. Any cells whose centroid was in-
intact and degraded primary-forest types (Margono et al.,            side the peatlands polygons were considered peat areas. Fol-
2014). Forest cover loss in the dataset of annual forest cover       lowing the rasterization step, the peatland’s fraction at 0.25◦
loss was defined as a stand replacement disturbance. Both            resolution was determined from the number of 0.01◦ cells
Landsat-based forest cover datasets were found to agree well         classed as peatlands falling within the lower-resolution cells.
with alternative estimates. The primary-forest extent of the
year 2000 dataset showed approximately 90 % agreement                2.3.4    Sub-region identifier features
when compared to the primary-forest map of the year 2000
issued by the Ministry of Forestry of Indonesia (Margono             Drivers of fire activity varying across different parts of
et al., 2014), while validation of tree cover loss suggested         the archipelago have different fire activity rates even when
that forest loss was correctly flagged in more than 80 % of          experiencing comparable drought conditions (Aldrian and
the cases (producer’s accuracy of 83.1 %) in tropical regions        Dwi Susanto, 2003; Field and Shen, 2008; Field et al., 2016).
(Hansen et al., 2013).                                               To enable the model to represent regional differences in
                                                                     drought sensitivity across Indonesia, we used five additional
                                                                     features representing binary identifiers for each of five sub-
2.3.3   Peatland fraction
                                                                     regions within Indonesia (Fig. 1).

Deforestation and drainage of the region’s carbon-rich peat-
lands in recent decades has rendered large amounts of near-          3     Model description and experimental setup
surface peat vulnerable to frequent repeated burning (Hoscilo
et al., 2011). Intentional fires in peatlands that are ignited to    3.1     The model
clear land and prevent vegetation regrowth often develop into
uncontrolled sub-surface peat combustion events which may            To predict fire occurrence probability we used a multilayer
last weeks or even months (Widyastuti et al., 2020). As a re-        perceptron (MLP) classifier (i.e. a shallow artificial neural

Nat. Hazards Earth Syst. Sci., 22, 303–322, 2022                                      https://doi.org/10.5194/nhess-22-303-2022
T. Nikonovas et al.: ProbFire: a probabilistic fire early warning system for Indonesia                                            309

network) (Hastie et al., 2009). The main reason for choos-         3.4     SEAS5-based predictions
ing an MLP model was the fact that MLPs do produce well-
calibrated probabilities, while at the same time they are able     ProbFire prediction of fire probability at lead times of 0–5
to approximate more complex non-linear relationships when          months was based on SEAS5 climate forecasts for the cor-
compared to simpler probabilistic prediction models such as        responding lead times. Total precipitation for the previous
logistic regression (Niculescu-Mizil and Caruana, 2005; Guo        months (t −1 through t −5) was also based on SEAS5 values
et al., 2017).                                                     for the months within the lead time window, while ERA5 pre-
   The model consisted of three fully connected layers: a          cipitation for the previous months was used if those months
layer with 18 inputs (see Fig. S3), one hidden layer with          were outside the lead time period. For example, prediction
15 nodes and an output layer with 2 nodes. For the hid-            for October 2015 at a 2-month lead time was based on the
den layer, rectified linear unit (ReLU) activations were used,     SEAS5 hindcast issued in August 2015. Precipitation for the
while sigmoid activation was applied to the output layer           preceding months, t − 1 and t − 2, was also based on the
nodes to obtain class (active-fire counts below or above           SEAS5 hindcasts issued in August; meanwhile total precip-
the threshold) probabilities. The model weights were opti-         itation for the months t − 3 through t − 5 was derived from
mized by employing an LBFSG (limited-memory Broyden–               ERA5 precipitation rates for July–May 2015. This approach
Fletcher–Goldfarb–Shanno algorithm) solver with a learn-           enabled us to utilize all the observational information avail-
ing rate value of 0.001 and cross-entropy loss function us-        able at the time when forecasts were issued.
ing L2 regularization with an alpha parameter value of 1.
The input features (climate parameters and land cover infor-       3.5     Climatology model
mation) were scaled to a zero mean and unit variance. The
                                                                   The potential skill and value of long-range fire predictions
model architecture and optimal parameter setup were deter-
                                                                   based on SEAS5 seasonal climate forecasts was bench-
mined by performing grid search cross-validation and evalu-
                                                                   marked against climatology-based model predictions. The
ating the model’s performance on validation data. The model
                                                                   climatology model had the same input features, except that
(http://github.com/ToFEWSI/ProbFire, last access: 31 Jan-
                                                                   SEAS5 forecasts were substituted with ERA5 mean values
uary 2022) was implemented in the Python 3 programming
                                                                   for the 1993–2019 period for a given month. Like the fore-
language using the scikit-learn machine learning library (Pe-
                                                                   casting feature setup, climatological values of total precip-
dregosa et al., 2011).
                                                                   itation for the preceding months were used for the months
                                                                   within the forecasting time window; otherwise ERA5 total
3.2   Model validation design
                                                                   precipitation was used. For example, climatology-based pre-
                                                                   diction for October 2015 at a lead time of 2 months was con-
To evaluate ProbFire performance, we employed a leave-1-
                                                                   structed using mean climate values for October 1993–2019
year-out training and testing dataset splitting strategy. This
                                                                   and climatological values of total precipitation for Septem-
approach provides a more realistic representation of the
                                                                   ber and August (t −1 and t −2), but ERA5-based values were
potential of the model to forecast fire occurrence proba-
                                                                   used for total precipitation at months t − 3 to t − 5.
bilities for future fire seasons. The whole 17-year record
was used (2002–2019), and the MLP model was iteratively            3.6     Model performance evaluation
trained using 16 years’ worth of ERA5 reanalysis climate
and land cover data and predicting fire probabilities for          3.6.1    Skill scores
the left-out year. For example, fire occurrence probabili-
ties for year x were predicted and evaluated using data            To assess model performance, we used reliability diagrams
from all years except year x for model training. This re-          (Murphy and Winkler, 1992), the probability of detection
sulted in 17 different realizations of the model (one for each     and false-alarm rate analysis (receiver operating character-
year in the record) all having different weights and biases,       istic) (Mason, 1982), and the Brier score (Murphy, 1973).
due to different subsets of the dataset being used for train-      Reliability diagrams inform how well predicted-event occur-
ing. Pretrained models with weights and biases are avail-          rence probabilities correspond to the actual observed-event
able at https://doi.org/10.5281/zenodo.5206278 (Nikonovas,         frequency. For example, we would have a reliable forecast
2021a).                                                            if taking all cases when 70 % event probability was issued;
                                                                   the event would have occurred in close to 70 % of those
3.3   ERA5-based predictions                                       cases. The reliability diagrams were calculated by splitting
                                                                   predicted probabilities into 10 equally spaced bins in a range
The first set of model predictions was made using ERA5 re-         of [0, 1] with a step of 0.1 and determining fire event occur-
analysis monthly climate values employing the leave-1-year-        rence frequency for each of the bins. To complement the reli-
out strategy. This set of predictions represents the base model    ability diagrams, we also constructed prediction histograms,
and the best-case scenario of this study’s fire activity predic-   which indicate forecast sharpness. Sharpness is a measure of
tion results.                                                      the ability of a forecast to issue a range of probabilities. It is a

https://doi.org/10.5194/nhess-22-303-2022                                     Nat. Hazards Earth Syst. Sci., 22, 303–322, 2022
310 T. Nikonovas et al.: ProbFire: a probabilistic fire early warning system for Indonesia
desirable property of a forecasting system because forecasts The Brier score is sensitive both to discrimination and cali-
that issue low or high event probabilities are potentially more bration (reliability), and it is strictly a “proper” score. The lat-
useful. In contrast, while a forecast that often gives probabil- ter property forces forecasters to issue a probability which is
ities close to event climatological frequency may be reliable, equal to their true expectation (Gneiting and Raftery, 2004).
it lacks sharpness and hence is of little use for decision mak- In contrast to proper scores, “improper” scores can be im-
ers. proved by “hedging”, i.e. issuing probabilities which are dif-
The probability of detection expresses the fraction of all ferent from the true expected probability. The Brier score is
events that were correctly classified, while the false-alarm sensitive to class prevalence and suffers from becoming van-
rate indicates the fraction of predicted events which did not ishingly small for extremely rare events. As a result, it only
occur: makes sense to compare the scores of different forecasts for
the same sample.
TP
pod = , (3)
(TP + FN) 3.6.2 Relative value of the forecasts
The scores discussed above are useful in assessing forecast
FP skill and for comparing the performance of different mod-
far = , (4)
(TP + FP) els; however, they do not explicitly reveal if the decision
makers would benefit from using the proposed forecasting
where “pod” refers to the probability of detection; “far”
system. Indeed, it is possible for forecasts to be simulta-
refers to the false-alarm rate; TP refers to a true positive,
neously skilful but not useful. The cost–loss ratio analy-
which equals the number of events that have been correctly
sis (Murphy, 1985; Richardson, 2000) addresses the useful-
classified as events; FN refers to a false negative, which is
ness question directly by providing an assessment of the po-
the number of events that were not predicted; and FP refers
tential economic value of the forecasts. This model, while
to false positives, which indicates the number of predicted
simplistic and of limited applicability when accounting for
events that did not occur. The probability of detection is sen-
non-economic impacts, nonetheless allows us to quantify the
sitive to true positives but ignores false positives, while the
value of forecasts for a range of users with a range of specific
false-detection rate is sensitive to false alarms but ignores
cost–loss ratios.
false negatives. Both scores may be artificially inflated, by
For example, if the event is a “peatland fire”, and the ac-
increasing and reducing the number of event forecasts in the
tion is “fire-preventative measures”, then loss would equal
case of the probability of detection and false-alarm rate, re-
the total economic loss caused by the fire event, and the
spectively. While both scores can indicate if the forecasts are
cost would be the total economic cost of the preventative
potentially useful, they are calculated at a particular proba-
measures. Each time a decision maker takes no action and
bility threshold. In reality, different users might benefit from
a fire event occurs, it results in a loss. Alternatively, every
choosing different probability thresholds at which they de-
time the decision maker acts it incurs a specific cost. Ev-
cide to act. The receiver operating characteristic (ROC) curve
ery time action is taken, and the predicted fire event occurs,
addresses this by showing both the probability of detec-
the difference between the reduced loss and invested costs
tion and false-alarm rate at a range of increasing probability
constitutes the total amount saved. In Indonesia, a range of
thresholds. The metric indicates the ability of the forecasting
different fire-preventative actions could be utilized depend-
system to discriminate between events and non-events. The
ing on the lead time of forecasts. Early warning (lead times
area under the receiver characteristic curve is a single num-
of several months) would allow forecasters and relevant au-
ber summary score which is used in this study to compare
thorities to inform the communities in fire-prone areas, leg-
receiver characteristic curves obtained by different models.
islate to prevent agricultural fire use for the season, and in-
The Brier score is a metric that is widely used to eval-
crease preparedness and train fire service personal. Forecasts
uate probabilistic predictions (Murphy, 1973; Gneiting and
issued at less than 1-month lead times could be utilized to
Raftery, 2004). Conceptually it is similar to mean squared
implement local bans of specific fire uses (e.g. agricultural
error but rather than measuring the difference between ob-
waste burning) and to deploy monitoring and fire-fighting re-
served and predicted real values, the Brier score evaluates
sources to the high-risk areas. A reliable forecasting system,
the difference between predicted probability in the range [0,
therefore, can inform the decision maker when (and where)
1] and event occurrence:
to act to minimize the total expenditure. As a result, such a
1 Xn forecasting system has a potential economic benefit, and the
Brier score = (f − ot )2 ,
t=1 t
(5) cost–loss analysis indicates this potential economic gain, or
n
in other words, the relative value of the forecasts.
where ft is the probability of the tth forecast and ot is 0 if This relative value is expressed as a fraction of value of a
the event did not occur and 1 if it did. The score takes values perfect (theoretical) forecast and indicates improvement over
between 0 and 1, with smaller values indicating better skill. a scenario when the only information available to the user is
Nat. Hazards Earth Syst. Sci., 22, 303–322, 2022 https://doi.org/10.5194/nhess-22-303-2022T. Nikonovas et al.: ProbFire: a probabilistic fire early warning system for Indonesia 311
the climatological-event occurrence frequency. The relative 4 Results and discussion
value of a forecast depends on the user-specific cost and loss
and is positive over a limited range of cost–loss ratios. If the 4.1 Reliability of probability prediction
cost is larger than the loss, not acting is always better and
vice versa; if the cost is very low in relation to the potential ProbFire forecasts of active-fire counts of > 0 cases in any
loss, always acting is the best option. Both these scenarios given grid cell in any particular month generally exhibited
negate the need for a forecasting system. The potential value a good degree of reliability (Fig. 4). Reliability diagrams of
of the forecasts is highest at the cost–loss ratio value which is ERA5-based prediction for the study years indicate, with a
equal to the event climatological frequency. Benefits vary for few exceptions, that for most years reliability curves were
different users with different cost–loss ratios, and, assuming close to the perfect diagonal line (Fig. 4a). For low-fire-
reliable probabilistic forecasts, an optimum probability de- activity years, the predictions were generally overconfident
cision threshold is equal to the user cost–loss ratio (Richard- (i.e. probabilities higher than the observed fire event fre-
son, 2000). As a result, users with high cost–loss ratios would quency). Predictions were less reliable only for two of the
benefit most from choosing to act at higher event probability relatively high-fire-activity years, 2002 and 2019. Predictions
thresholds and vice versa. In this study, relative value was for 2002 were underconfident, meaning that the model gener-
calculated for a range of cost–loss ratios [0.001, 1] following ally underestimated fire event occurrence frequency for that
Eqs. (7) and (8). year. Active fires were more frequently detected in grid cells
for which the model issued low probabilities. This underesti-
c
l (TP + FP − 1) + FN mation may be because 2002 was the first year in the record
relative value = c
l (Pclim − 1) which had no prior MODIS active-fire observations and also
c only a limited primary-forest loss record. Although we tried
if < Pclim , (6) to extend back the MODIS observations beyond 2002 with
l
c
(TP + FP) + FN − Pclim the ATSR WFA nighttime active-fire dataset, the later prod-
l
relative value = c uct has much lower fire counts and could not provide a suffi-
l (Pclim − 1) cient record of fire activity prior to 2002.
c
if ≥ Pclim , (7) By contrast, predictions issued for the year 2019 were too
l high across the whole range of probabilities. This overes-
where cl is the cost–loss ratio and Pclim is the climatolog- timation could be due to several factors. Firstly, the 2019
ical probability of occurrence of the fire event (i.e. active- drought was driven by a positive IOD, while ENSO was neu-
fire count of > 10 cases) for the sub-region of interest. Note tral. Secondly, since the 2015 burning episode, the Indone-
that the relative value (same as the probability of detection sian government has implemented further policies aimed at
and false-alarm rate) is calculated at a particular probability reducing deforestation and fire occurrence (Hergoualc’h et
threshold, in effect transforming the continuous probabilistic al., 2018; Carmenta et al., 2020), which may have contributed
forecasts to binary predictions of fire event vs. no fire event to lower-than-expected fire detections in 2019.
to derive true positives, false positives and false negatives. ERA5- and SEAS5-based prediction probabilities for an
As a result, relative values are derived for a range of prob- active-fire count of > 0 cases pooled for all years but split
ability thresholds indicating potential benefits for users with into different sub-regions generally indicate good reliabil-
different cost–loss ratios. ity (Fig. 1b–f). However, there are some notable differences
when comparing the spatial domains. Notably, all predic-
3.6.3 Mean SEAS5 ensemble probability tions for south Kalimantan and south Papua indicate over-
confidence, while forecast (SEAS5-based) probabilities for
In contrast to the traditional ensemble evaluation methods west Kalimantan were underconfident. SEAS5-based predic-
that derive probabilistic forecasts from the distribution of de- tions performed generally well for all regions and all lead
terministic predictions of the individual ensemble members, times, exhibiting only a gradual degradation in the relia-
the modelling method employed by this study predicts prob- bility of high-probability predictions with increasing lead
abilities of fire counts exceeding a given threshold for all times. There were noteworthy differences when comparing
25 members of the SEAS5 ensemble. For deriving ensemble the ERA5-based probability histograms for different sub-
mean skill scores we combined the estimates based in indi- regions. Predictions for central Sumatra and west Kaliman-
vidual members into a single probability estimate by com- tan lack sharpness, a property which is manifested by a rela-
puting a simple equally weighted average probability. tively low number of very high probabilities issued for those
regions. In contrast, the model was able to discriminate be-
tween no fire and an active-fire count of > 0 cases more
easily in south Sumatra, south Kalimantan and south Papua.
This difference coincides with the fact that drought severity
in the latter group of sub-regions is influenced by El Niño,
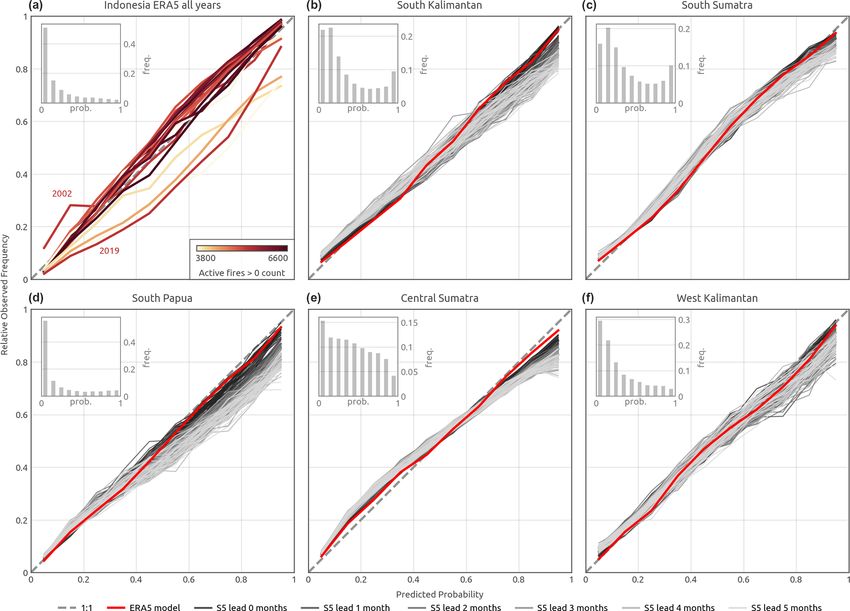
https://doi.org/10.5194/nhess-22-303-2022 Nat. Hazards Earth Syst. Sci., 22, 303–322, 2022312 T. Nikonovas et al.: ProbFire: a probabilistic fire early warning system for Indonesia Figure 4. Reliability diagrams of occurrence probability predictions of active-fire counts of > 0 cases. Inset axes show ERA5-based prob- ability prediction frequency histograms. (a) ERA5-based prediction reliability curves for all of Indonesia for each year in the record. The colour of the lines corresponds to an active-fire count of > 0 cases for the year. (b–f) Mean reliability curves for the sub-regions (Fig. 1), showing ERA5- (red) and SEAS5-based ensemble mean prediction reliability curves at different lead times (shades of grey, bottom legend). Dotted lines indicate perfect reliability (1 : 1 fit). while in central Sumatra and west Kalimantan, a positive two fire occurrence classes was observed for SEAS5-based IOD is the most important driver of droughts (Field et al., issued probabilities. The reliability of high-probability pre- 2016; Pan et al., 2018). dictions of occurrences of an active-fire count of > 10 cases ProbFire prediction of an active-fire count of > 10 cases deteriorated rapidly with lead time. Notably, low numbers of class occurrence probability was generally less reliable and high-confidence predictions limited the reliability estimation substantially less confident (Fig. 5) when contrasted with the for the central Sumatra and west Kalimantan sub-regions, model reliability performance for an active-fire count of > 0 which had very small numbers of high-confidence predic- cases seen in Fig. 4. Reliability of ERA5-based predictions tions (low sharpness). This highlights that a reliable and con- for different years (Fig. 5a) exhibited much more variabil- fident prediction of an active-fire count of > 10 cases is more ity. The large spread is partially attributable to the fact that difficult compared to predicting an active-fire count of > 0 low-fire-activity years did not have enough grid cells of an cases. Low prediction confidence could be in part attributable active-fire count of > 10 cases needed to determine the re- to dataset imbalance as grid cells of an active-fire count liability of probability prediction. The reliability of ERA5- of > 10 cases comprise only ∼ 5 % of the training dataset. based predictions for different sub-regions (Fig. 5b–f) was However, the most important factor here is perhaps an intrin- also slightly worse when compared to the prediction dia- sic difficulty of the discrimination between grid cells which grams of an active-fire count of > 0 cases, in particular for do contain a few active fires (0 > active fires < 11) and those central Sumatra and west Kalimantan (Fig. 5e and f). The in which the count exceeded 10 active fires. Fire occurrence biggest difference in reliability of predictions between the and severity in Indonesia, besides the climatic drivers, is in- Nat. Hazards Earth Syst. Sci., 22, 303–322, 2022 https://doi.org/10.5194/nhess-22-303-2022
T. Nikonovas et al.: ProbFire: a probabilistic fire early warning system for Indonesia 313
Figure 5. Same as Fig. 4 but for prediction of probability for an active-fire count of > 10 cases.
fluenced by the interplay of many location-specific factors optimize the classification problem as well for the latter sub-
including land management practices, policy decisions and regions given the predictors used in this study. Consequently,
fire suppression efforts (Page and Hooijer, 2016; Tacconi, even in the case of perfect seasonal forecasts, fire activity
2016), none of which could be realistically represented in a prediction performance would be worse in central Suma-
region-wide fire prediction model. Despite this difficulty, our tra and west Kalimantan when compared to the other sub-
results indicated that prediction of the category of an active- regions. Lower model skill is likely to be attributable to dif-
fire count of > 10 cases (Fig. 6) was potentially more useful ferent dry-season patterns coupled with a stronger influence
for decision makers. of human drivers. West Kalimantan and central Sumatra in
particular do experience early-season drought (in February–
4.2 Prediction skill scores March) as well as the main dry season (July–September)
which is common across all sub-regions. In contrast to El
The model prediction metrics for an active-fire count of > 10 Niño-dominated regions, high-fire-activity episodes in cen-
cases (Fig. 7) exhibited patterns which generally followed tral Sumatra and west Kalimantan are typically shorter and
those of the reliability diagrams. All of the scores were better do occur outside the times of the two dry seasons (Gaveau
for the El Niño-dominated sub-regions (i.e. south Kaliman- et al., 2014) (Fig. 8). As a result, the monthly time step used
tan, south Sumatra and south Papua). By contrast, west Kali- by the modelling system of this study may be insufficient for
mantan and in particular central Sumatra had a lower AUC resolving this rapid climatic variability.
(area under the curve), higher Brier score and substantially SEAS5-based prediction skill scores gradually degraded
lower probability of detection. Importantly, not only were with increasing lead time in all sub-regions. The performance
the climatology- and SEAS5-based forecast scores worse, of seasonal forecasts was substantially better in the El Niño-
but also the ERA5-based predictions yielded lower validation dominated sub-regions. Notably, in south Papua SEA5 en-
values. This result indicates that the model was not able to semble predictions had both AUC and Brier scores better
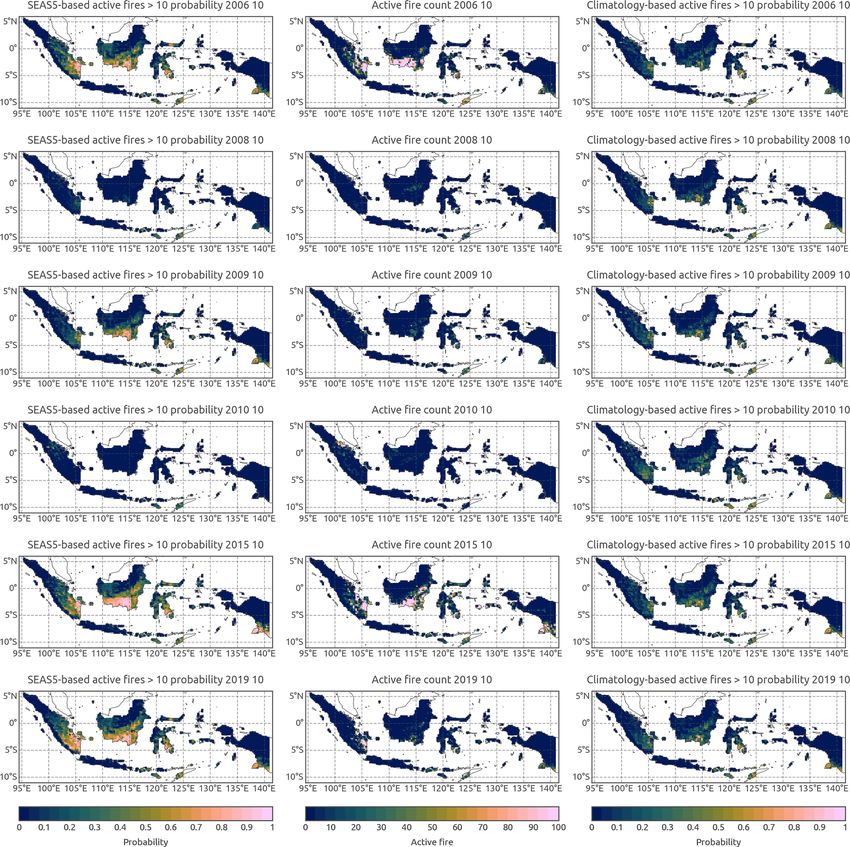
https://doi.org/10.5194/nhess-22-303-2022 Nat. Hazards Earth Syst. Sci., 22, 303–322, 2022314 T. Nikonovas et al.: ProbFire: a probabilistic fire early warning system for Indonesia Figure 6. Model prediction of probability of an active-fire count of > 10 cases and observed active-fire counts. Shown are SEAS5-based (left column) and climatology-based (right column) probability predictions at lead time of 2 months and observed monthly active-fire counts (middle row) for October in 6 example years (rows). Please note that the date format used in this figure is year month. when compared to climatology predictions at lead times up These results demonstrate that ProbFire driven by SEAS5 to 4 months. Skill scores of SEAS5 ensemble predictions ensemble forecasts has a relatively high potential value for in south Kalimantan and south Sumatra indicated potential the development of early warning systems in south Kaliman- gains when compared to climatology-based model predic- tan, south Sumatra and south Papua. Skilful and reliable pre- tions at lead times of up to 2 months. By contrast, AUC and diction of elevated fire activity 2 to 4 months in advance al- Brier scores of SEAS5-based predictions in central Sumatra lows for ample time to act on the predictions. This result may outperformed climatology-based model predictions only at be attributable to the increasingly realistic representation of a 0-month lead. In west Kalimantan there was no benefit of ENSO-driven SST variability in seasonal forecasting models using SEAS5 ensemble forecasts at any lead times. (Johnson et al., 2019). The skill of SEAS5-based fire occur- Nat. Hazards Earth Syst. Sci., 22, 303–322, 2022 https://doi.org/10.5194/nhess-22-303-2022
T. Nikonovas et al.: ProbFire: a probabilistic fire early warning system for Indonesia                                                315

Figure 7. Skill scores for prediction of an active-fire count of > 10 cases. Shown are mean values of the area under the receiver operating
characteristic curve (AUC), Brier score, probability of detection and false-alarm rate (figure rows) for the different sub-regions (figure
columns). ROC curves are shown in Fig. S2 in the Supplement. The values for ERA5-based model predictions are shown as red bars, and
climatology-based predictions are depicted as blue bars, while boxplots indicate SEAS5 ensemble member prediction values at different lead
times. For boxplots, shown are the median value (grey bar), interquartile range (boxplot body) and the full range (boxplot whiskers) of the
SEAS5 ensemble member predictions at a given lead time.

rence forecasts at a 0-month lead in central Sumatra indicated          bility sharpness. Climatology-based prediction lacked sharp-
some potential value; however, utilization of such forecasts            ness and therefore had a low probability of detection and low
in the early warning systems is challenging because warn-               false-alarm rate. Meanwhile, SEAS5 forecasts enabled the
ings could be issued at most a few weeks before the onset of            model to issue more confident probabilities (Fig. S1) which
a potentially elevated fire activity phase.                             consequently had not only a higher probability of detection
   ProbFire predictions of events of a monthly active-fire              but also somewhat higher false-alarm rates.
count of > 10 cases derived using seasonal forecasts had
a substantially higher probability of detection (Fig. 7)                4.3   Relative value of the forecasts
when compared to climatology-based predictions in all sub-
regions. This was true for all lead times, although there was
                                                                        The cost–loss analysis of ProbFire fire activity forecasts
a consistent decrease in the probability of detection with an
                                                                        demonstrated the potential economic benefit of the sys-
increasing lead time. At the same time, SEAS5-based predic-
                                                                        tem’s fire occurrence predictions when compared to forecasts
tions had slightly higher false-alarm rates which were also
                                                                        based only on the fire event climatological occurrence fre-
increasing with lead time. Such a pattern was an expected re-
                                                                        quency (Figs. 8 and 9). While at least some forecasts users
sult and is a manifestation of differences in forecasted proba-
                                                                        in all study sub-regions would have benefited to some de-

https://doi.org/10.5194/nhess-22-303-2022                                         Nat. Hazards Earth Syst. Sci., 22, 303–322, 2022
316 T. Nikonovas et al.: ProbFire: a probabilistic fire early warning system for Indonesia Figure 8. Difference in mean monthly Brier scores between climatology-based and SEAS5-based model predictions of occurrence predic- tions at lead times of 0–5 months of an active-fire count of > 10 cases and a mean monthly active-fire count for the study’s sub-regions. Positive Brier score difference values (red shades) indicate smaller Brier values for SEAS5-based predictions (better), while negative Brier difference values (blue shades) indicate that climatology-based predictions performed better for that month and lead time. Note different colour scales for different sub-regions. Nat. Hazards Earth Syst. Sci., 22, 303–322, 2022 https://doi.org/10.5194/nhess-22-303-2022
You can also read