Nelson-Tasman Housing We'd Choose Housing Demand Preferences - June 2021 Version: FINAL
←
→
Page content transcription
If your browser does not render page correctly, please read the page content below
Nelson-Tasman Housing
We’d Choose
Housing Demand
Preferences
June 2021
Version: FINAL
Prepared for
Nelson City Council and Tasman District Council

Document reference: TDC 002.21 HWC Tasman Nelson
Date of this version: 09 June 2021
Version:        FINAL v2
Report authors: Rodney Yeoman, Greg Akehurst and Kieran McLean.
Research authors: James Maguire.
Director approval: Greg Akehurst.
www.me.co.nz
Disclaimer: Although every effort has been made to ensure accuracy and reliability of the information
contained in this report, Market Economics Limited, nor any of their employees shall be held liable for the
information, opinions and forecasts expressed in this report.

Contents
EXECUTIVE SUMMARY...................................................................................................................... 1

1            INTRODUCTION ................................................................................................................. 3

1.1         PURPOSE OF REPORT .............................................................................................................. 3

1.2         SCOPE OF REPORT .................................................................................................................. 4

1.3         STRUCTURE OF REPORT ........................................................................................................... 5

2            NELSON-TASMAN HOUSING MARKET ............................................................................... 6

2.1         BACKGROUND ....................................................................................................................... 6

2.2         HOUSING SUPPLY................................................................................................................... 7

2.3         HOUSING DEMAND .............................................................................................................. 10

2.4         HOUSING MARKET PRICES ..................................................................................................... 11

2.5         FINDINGS ON THE HOUSING MARKET SITUATION ....................................................................... 13

3            HOUSING WE’D CHOOSE METHOD ................................................................................. 14

3.1         SURVEY METHOD ................................................................................................................ 14

3.2         SURVEY SAMPLE .................................................................................................................. 15

3.3         SURVEY SECTORS ................................................................................................................. 16

3.4         SURVEY STRUCTURE ............................................................................................................. 17

4            DEMAND PREFERENCES SURVEY ..................................................................................... 19

4.1         CURRENT SITUATION ............................................................................................................ 19

4.2         WHAT IS IMPORTANT TO HOUSEHOLDS? .................................................................................. 20

4.3         WHAT DID HOUSEHOLDS CHOOSE? ........................................................................................ 30

4.4         FINDINGS OF DEMAND PREFERENCE SURVEY ............................................................................. 33

5            CONCLUSION................................................................................................................... 35

APPENDIX A – SURVEY TECHNICAL REPORT .................................................................................... 36

APPENDIX B – SURVEY SAMPLE ...................................................................................................... 37

Figures
FIGURE 2.1: MAP OF NELSON AND TASMAN REGIONS .................................................................................... 6

FIGURE 2.2: NEW DWELLING CONSENTS NELSON AND TASMAN REGIONS, 1991-2020 ...................................... 8

FIGURE 2.3: TYPES OF NEW DWELLING CONSENTED NELSON AND TASMAN REGIONS, 1991-2020 ...................... 9

FIGURE 2.4: POPULATION GROWTH 1996 – 2020, NELSON AND TASMAN REGIONS ....................................... 11

FIGURE 2.5: MEDIAN HOUSE PRICES NELSON AND TASMAN REGIONS, 2003-2020 ......................................... 12

FIGURE 2.6: MEDIAN WEEKLY RENTAL NELSON AND TASMAN REGIONS, 2003-2020 ....................................... 13

FIGURE 3.1: OVERVIEW OF DATA COLLECTION PROCESS ................................................................................. 15

FIGURE 3.2: LOCATIONS – POPULATION, QUOTA’S AND COMPLETED SURVEYS................................................. 16

FIGURE 3.3: SURVEY SECTORS WITHIN NELSON AND TASMAN REGIONS ........................................................... 17

FIGURE 4.1: PREFERENCES FOR LOCATION FEATURES OF HOUSING – NELSON URBAN ........................................ 21

FIGURE 4.2: PREFERENCES FOR LOCATION FEATURES OF HOUSING – TASMAN URBAN ....................................... 22

FIGURE 4.3: PREFERENCES FOR FACILITIES FEATURES OF HOUSING – NELSON URBAN ........................................ 23

FIGURE 4.4: PREFERENCES FOR FACILITIES FEATURES OF HOUSING – TASMAN URBAN ....................................... 23

FIGURE 4.5: PREFERENCES FOR ENVIRONMENTAL FEATURES OF HOUSING – NELSON URBAN .............................. 24

FIGURE 4.6: PREFERENCES FOR ENVIRONMENTAL FEATURES OF HOUSING – TASMAN URBAN ............................. 25

FIGURE 4.7: PREFERENCES FOR PROPERTY FEATURES OF HOUSING – NELSON URBAN ........................................ 26

FIGURE 4.8: PREFERENCES FOR PROPERTY FEATURES OF HOUSING – TASMAN URBAN ....................................... 27

FIGURE 4.9: RANKED PREFERENCES OF HOUSING – NELSON URBAN ............................................................... 28

FIGURE 4.10: RANKED PREFERENCES OF HOUSING – TASMAN URBAN ............................................................ 28

FIGURE 4.11: NELSON TASMAN RENTERS OVERALL PREFERENCE RANKING ..................................................... 29

FIGURE 4.12: RENTAL RESPONDENTS LEVELS OF IMPORTANCE FOR DECISION FACTORS ON HOUSING CHOICE....... 30

FIGURE 4.13: DWELLING LOCATION - UNCONSTRAINED VS CHOICE EXPERIMENT – NELSON URBAN..................... 31

FIGURE 4.14: DWELLING LOCATION - UNCONSTRAINED VS CHOICE EXPERIMENT – TASMAN URBAN .................... 31

FIGURE 4.15: DWELLING TYPE - CURRENT VS CHOICE EXPERIMENT – NELSON URBAN ....................................... 32

FIGURE 4.16: DWELLING TYPE - CURRENT VS CHOICE EXPERIMENT – TASMAN URBAN ...................................... 33

Tables
TABLE 2.1: NELSON AND TASMAN REGIONS DWELLING CONSENTS BY TYPE, 1990 - 2020 ................................ 10

TABLE 2.2: STUDY AREA URBAN AND RURAL DWELLING CONSENTS BY TYPE, 1990 - 2020 .............................. 10

TABLE A.0.1: DISTRIBUTION OF HOUSEHOLD TYPE BY CATCHMENT AREA, 2018 CENSUS (%) .............................. 37

TABLE A.0.2: DISTRIBUTION OF HOUSEHOLD TYPE BY SECTOR, SURVEY SAMPLE (%) ........................................... 38

TABLE A.0.3: HOUSEHOLD INCOME DISTRIBUTION, SURVEY SAMPLE VS POPULATION .......................................... 39

TABLE A.0.4: DWELLING TENURE, SURVEY SAMPLE COMPARED TO POPULATION ................................................ 40

TABLE A.0.5: ETHNIC DISTRIBUTION, SURVEY SAMPLE COMPARED WITH POPULATION ......................................... 41

TABLE A.0.6: AGE DISTRIBUTION, SURVEY SAMPLE COMPARED WITH POPULATION ............................................. 42
Executive Summary
As with other regions and areas across New Zealand, Nelson and Tasman regions are facing growth
pressures and are assessing how to deliver housing solutions to address housing needs and affordability,
while delivering well-functioning urban environments. The Nelson and Tasman region, with Nelson City as
its core urban centre, is a high growth area, facing pressures from internal growth as well as from growth
in retirees from further south, and from other areas in New Zealand.

Aligned with this growth are changes in the nature of households, their formation, and their needs. A
desire to maximise the efficiency of urban space, reduce sprawl and consumption of highly productive
lands, along with a belief that the current planning provisions are not delivering an appropriate mix of
housing, means the councils are looking closely at what people need and want in terms of their dwelling
choices and the forces working behind those choices. Through the use of planning provisions and with
reinforcement from Central Government by way of the National Policy Statement on Urban Development,
councils are aiming to ensure supply and demand are more closely aligned. Recognising a gap in their
understanding of demand, Nelson/Tasman have commissioned this study into the housing choice process.

What did this research investigate?

The Housing We’d Choose study contributes a unique understanding of the demand side of the housing
equation. This study collected the views of more than 600 residents across the Nelson and Tasman regions
to understand what is important to them in choosing a place to live, and it has explored what types of
housing they would choose to buy or to rent, if it were available, within their current income and financial
constraints. The main difference between this study and previous research into housing preferences is that
this research introduced ‘real life’ constraints on people’s choices. As the report discusses in more detail,
respondents were asked to choose between a variety of housing types, sizes and locations across the
Nelson and Tasman regions, within their own financial constraints. These constraints were established
using household and financial information that they provided during the survey.

Respondents were recruited by phone and invited to complete the online survey. Being online allowed
presentation of unique visuals and allowed calculations of affordability to occur in real time, adjusting to
respondents’ answers throughout the process – again in real time. Efforts were made to ensure the survey
sampled an appropriate cross section of Households. In total, 891 respondents indicated they were
interested in taking part in the survey. Of those, some 622 completed the questionnaire. This equates to
a completion rate of 70%. With an achieved sample size of 622, the results have a margin of error of +/-
3.9% at a 95% confidence level.

What did households choose?

It is clear from this study that residents in the Nelson and Tasman regions are generally willing to trade off
both the type of dwelling and location, with dwelling price being a critical consideration. While the demand
for stand-alone dwellings remains high, demand for attached dwelling, such as apartments, terraces and
duplexes, is significant when compared to the supply that is being provided by the market.

Page | 1
The following are key findings of the demand preference survey:
Respondents consider that the most important features of a dwelling are that it is Safe from
crime, followed by having a Freehold Title and is Sunny. Other important features of housing
include; Safe from natural hazards and that it is Standalone.
In terms of location choice, there is a difference between unconstrained and constrained choice.
The difference between the choices shows that financial constraints mean that respondents did
not pick popular urban fringe areas (Stoke and Motueka) due to price. It would seem that
respondents traded away from this location for other lower cost, potentially rural parts of the
region due to prices being too high.
The constrained choice data showed that some respondents currently living in stand-alone
dwellings, would be willing to live within higher density dwelling types, mostly attached dwellings
and some apartments.
Page | 21 Introduction Within the Nelson and Tasman regions, as with other regions and growth areas across the country, there is considerable interest in the manner in which residential capacity is being supplied and enabled under District Plan planning provisions. There is a belief that demand for dwellings is exceeding the ability of the market to supply housing, resulting in significant house price increases and reductions in housing affordability. There is also a concern that the various planning provisions may not be providing an appropriate mix of housing by type, price and location to meet market demands. While it is important to understand the raw scale of growth in residential demand and capacity to meet that demand, it is as important to have a strong understanding of the type and nature of housing demand and more importantly, when presented with a range of choices and constraints, the trade-offs households are prepared to make to meet their needs. This report is a study of housing preferences of the community that lives within and around the urban areas of Nelson and Tasman (‘Urban Nelson-Tasman’1). The research method applied in this study is a continuation of similar research called Housing We’d Choose (‘HWC’), which has been conducted by Market Economics/Research First for other cities in New Zealand (Auckland2, Dunedin3, Hamilton4) and Australia (Melbourne/Sydney5 and Perth6). 1.1 Purpose of report Nelson City Council and Tasman District Council are currently preparing a Housing and Business Capacity assessment (‘HBA’) as required by the National Policy Statement on Urban Development (‘NPSUD’). To inform the HBA the councils need to understand the choices households make in response to their housing needs. The ability to provide for sufficient housing, in places where people want to live, and where services can be provided in an efficient and effective manner, is a critical matter that the updated HBA and Future Development Strategy review (‘FDS’) will need to address. In relation to housing, the NPSUD seeks to enable sufficient capacity to meet community demand for housing at a range of locations and dwelling types, and prices. The first objective of the NPS-UD is for “New Zealand to have well-functioning urban environments that enable all people and communities to provide for their social, economic and cultural well-being and for their health and safety, now and into the future”. Therefore, provisions within planning documents need to provide for a range of residential opportunities such that all people can meet their needs. The final objective of the NPSUD is that “New Zealand’s urban 1 Urban Nelson-Tasman is defined as Nelson, Richmond, Brightwater, Wakefield, Mapua and Motueka. See Figure 3.3 for details on the spatial extents of each of the urban areas. 2 Yeoman, R. and Akehurst, G. (2015). The Housing We’d Choose: A study of housing preferences, choices and trade-offs in Auckland. A report prepared by Market Economics Limited for Auckland Council. 3 Akehurst, G. (2019). Housing Framework Predictions: The Housing We’d Choose. A report prepared by Market Economics Limited for Dunedin City Council. 4 Akehurst, G., Tucker, M., Yeoman, R. and Ashby, H (2020) Future Proof sub-region Housing Study: Demand Preferences and Supply Matters. 5 Kelly, J.F., Weidmann, B., and Walsh, M. (2011). The Housing We’d Choose. Melbourne, Australia: Grattan Institute. 6 Department of Housing & Department of Planning. (2013). The Housing We’d Choose: a study for Perth and Peel. Perth: Government of Western Australia. Page | 3
environments; (a) support reductions in greenhouse gas emissions.” In this context that means planning
provisions should be designed to support development, largely intensification and higher density forms of
housing close to centres and transport nodes, thereby reducing the transport friction that generates
greenhouse gas emissions and commuter time. The purpose of this piece of research is to understand how
households trade off higher priced stand-alone dwellings in more remote suburbs against more intensive
forms of dwellings (Terraced houses, duplexes and apartments) that are significantly closer to places of
high urban amenity (such as centres, work areas, the river, parks and social infrastructure).
The second objective of the NPSUD supports future housing development (and intensification) by seeking
to ensure that planning decisions improve housing affordability by supporting competitive land and
development markets. The NPSUD incorporates a new focus on offering people access to a choice of
homes that meet their dwelling needs or demands, as well as providing access to jobs, opportunities for
social interaction, high-quality diverse services, and open space. There is a focus on providing a range of
dwelling types and locations, which include significant intensification within walking distance of large
centres (central city).
Nelson City Council and Tasman District Council have significant data and models of household growth
translated into housing units projected to be needed over the next 30 years. This shows where and how
they are looking to provide for demand however, very little research has been carried out into people’s
housing preferences. Nelson City Council and Tasman District Council decision makers do not have a clear
idea of preferences in terms of; housing attributes, preferred environments and the relative importance of
all dwelling and locational characteristics households weigh up when making a housing decision. Finally,
and importantly, there is virtually no research to date that explores the kinds of trade-offs households may
be willing to make if they can’t meet all of their preferences in a way that is affordable to them. The Housing
We’d Choose research is seeking to better understand these trade-offs.
Tasman and Nelson Councils, will also use the report to provide evidence for the individual Resource
Management Plans (RMA), which are currently at different stages of preparation, to inform the scale of
zoning for different types of residential in its District/City.
1.2 Scope of report
The scope of the research was to investigate housing preferences in the Urban Nelson-Tasman area. The
following objectives were noted by Nelson City Council (‘NCC’) and Tasman District Council (‘TDC’):
Establish research specific to the Urban Nelson-Tasman area;
Establish a better understanding of what is important to people in the Urban Nelson-Tasman area
when choosing a place to live;
Exploring the type and location of housing that people would choose to live in, if the options were
available, based on real-world constraints; and
Comparing existing housing stock and what is coming online (currently being built, or planned to
be built), with what people say they would choose if they could.
The scope of this report was to focus on new housing within the private market, primarily for purchase by
owner occupiers or for rental. It is acknowledged that there is a housing continuum which includes non-
market housing types, such as social housing, papakāinga and co-housing. It was beyond the scope of this
report to test the preferences of households that are not catered for in the private market. We consider
Page | 4that a separate study of household needs within this segment of the community would be valuable.
However, such a study may be outside the purview of local government and therefore likely to be more
appropriately handled by central government, iwi and other community providers who control most non-
market housing.
Market Economics has led a team to undertake two sets of research to meet these objectives. First, was to
collect secondary data on the households and dwellings within Nelson-Tasman regions, along with other
relevant secondary data. This information was used to define the survey population, sub areas of interest
within the Nelson Tasman Urban Area, dwelling typology, sales/rents of these dwellings and mortgage
calculator (economic research by Market Economics).
Second, to take the information from the economic research to design a survey script that would collect
primary data on the housing preferences of the community (a survey conducted by Research First Ltd).
Finally, develop a short report that provides results from the research streams. In other HWC research
Market Economics has conducted post survey modelling, which has included;
1) statistical analysis of relationships that exist in the primary data. This would take the form of
building a discreet choice model or conditional logit model that provided insight into what was
driving trade-offs.
2) projections of housing demand based on the preferences observed in the primary data.
The team would be available to provide additional economic research if required into either of these areas.
1.3 Structure of report
This report is structured as follows:
Section 2 – Nelson-Tasman Housing Market, provides a discussion on the current housing market in
Nelson-Tasman area which briefly discusses the dwelling stock (both existing and new), dwelling
sales prices and rents and some aspects of the community (demographics and household types).
This discussion provides context about the market conditions, demand and supply, which exist
within the Nelson-Tasman area.
Section 3 – Housing We’d Choose Method, outlines a summary of the key steps undertaken in the
research. This methodology has been applied by Market Economics and Research First to many of
the high growth urban areas in New Zealand.
Section 4 – Demand Preferences Survey, presents the responses that were observed in the survey,
both in terms of unconstrainted preferences and constrained preferences.
Section 5 – Conclusions, provides a summary of the report’s findings.
Page | 52 Nelson-Tasman Housing Market
2.1 Background
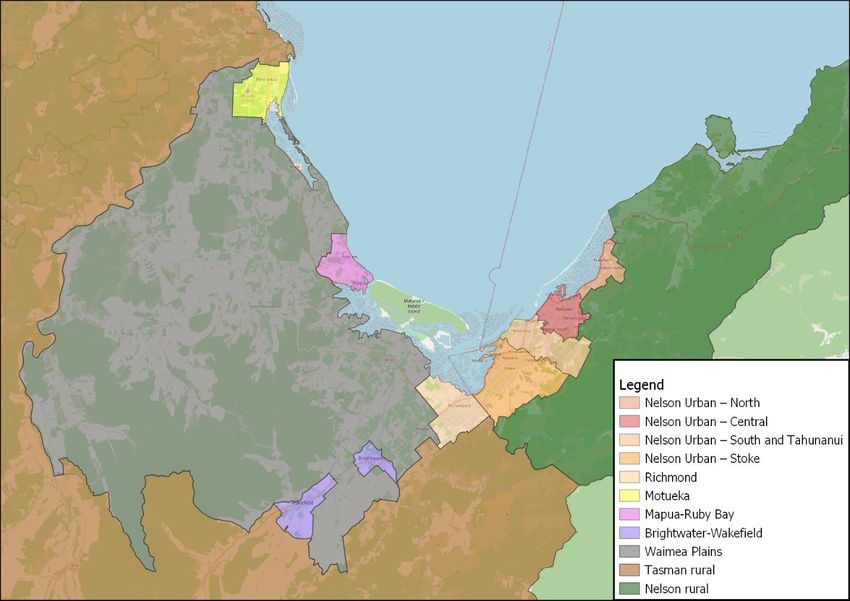
The Nelson and Tasman regions are renowned for receiving the most sunshine hours in New Zealand. The
regions are located in north-westerly part of the South Island, which means that they are sheltered from
cold weather systems arriving from the south (Figure 2.1). Unsurprisingly the regions have experienced
rapid growth, from both international and internal migrants moving to live in the area.
The population growth in Nelson City and Tasman District has been faster than most of the other areas in
New Zealand. Tasman District’s population grew by 2.4%, or 1,300 residents in the last year, while Nelson
City’s population grew by 1.9% or 1,000 residents. In total, the two areas now have a population of 111,000
residents.7 It is likely that Nelson and Tasman region will continue to grow strongly in the coming decades.
The official projections suggest that another 30,000 people may locate in the regions over the coming three
decades.8
Growth pressures have extended out from Nelson into the urban parts of Tasman region, with large scale
developments occurring around many of the towns in Tasman – Richmond, Brightwater, Wakefield, Mapua
and Motueka. Nelson City has also experienced strong growth, which has mainly occurred within the
existing urban area.
Figure 2.1: Map of Nelson and Tasman Regions
7 Stats NZ (2020) Subnational population estimates (TA, SA2), by age and sex, at 30 June 1996-2020 (2019 boundaries).
8 Stats NZ (2021) Population projections, by age and sex, 2018(base)-2048 – high projection.
Page | 6A key concern of the councils is to understand how best to accommodate growth. Specifically, how best to encourage growth in forms that best meet the demands of households while achieving the objectives of the NPSUD and the various plans and strategic documents that outline the regions’ future. A key driver for both councils is how to provide a diversity of housing options and what does this diversity look like. The councils want to understand how households will respond to a range of dwelling typologies, prices and locations and most importantly, the trade-offs households will make to achieve either locational preference or to maximise their private amenity in another manner. Specifically, what types of dwellings and what locations should be encouraged within the regions. For the purposes of this study and to ensure that the findings of the research are able to be applied to council’s HBA reporting under the NPS-UD, the focus is on the Nelson Tasman Urban Environment. However, it is recognised that this market operates in a wider sub-regional context – especially because the distances involved are not significant from some of the ‘rural’ hinterlands into the core urban zones. This means that the trade-offs households may be making in terms of trading more distance for a lower cost dwelling are not necessarily onerous. 2.2 Housing Supply Dwelling consents data9 suggests that the number of new dwellings built in the Nelson and Tasman regions peaked in early 2000 at around 950 per annum, then declined to a little over 400 per annum around 2009- 2011 and has since recovered to over 800 per annum in 2020 (see Figure 2.2). While there was a significant decline in new dwelling consents during the Global Financial Crisis, supply has recovered strongly over the last decade reaching record levels in Tasman last year10. Figure 2.2 also shows that the role of Nelson and Tasman regions has switched, with Nelson issuing more consents in the first 5 years (1990 – 95), but with Tasman District playing the major role in supplying new dwellings from then on (58%) and Nelson providing the balance (42%). The dwelling consent data indicates that since 1991, there has been a fairly constant split between Urban and non-urban development. In total, over the 30 years around 75% of consents have been issued in the Nelson Tasman Urban Environment and 25% in rural areas. Over the last 5 years it has averaged 78% urban, but this is similar to the 1991 – 95 period where 79% of consent were urban. 9 Statistics New Zealand, February 2021, Building Consents issued: December 2020 10 Year ending March 2021, Tasman recorded a record 601 building consents issued Page | 7
Figure 2.2: New Dwelling Consents Nelson and Tasman Regions, 1991-2020

           1,000
             900
             800
             700
             600
             500
             400
             300
             200
             100
              -
                   1991      1996         2001         2006         2011         2016       2020
                                         Nelson City   Tasman District

                                                                             Source: Statistics New Zealand

The types of dwellings consented in the Nelson and Tasman regions have changed over the last three
decades, with a growing share being retirement units and a decline in apartments in Nelson City. The
number of retirement units as a share of the total has increased from 2% in the 1990 – 94 time period to
almost 12% over the past decade (2010 – 2020). Apartments on the other had have declined, with over
840 issued in the 1990 – 94 period in Nelson, declining to 27 in the 2010 – 14 period before rising to 125
between 2015 and 2020. Townhouses/flats as a share have remained fairly stable across each TA. In both
cases they represent around 4-5% of total consents issued. Their share peaked in Nelson during the late
1990’s early 2000’s at 6% share. While both low- and high-density dwelling consents have increased
significantly since the GFC, there has been much more growth in consents for high density units. It is likely
that Tasman has only medium density, while Nelson will have both medium density and high density.

In addition, much of the change in dwelling types has occurred in the last five years and has been driven by
the developments of retirement units.

Page | 8
Figure 2.3: Types of New Dwelling Consented Nelson and Tasman Regions, 1991-2020
1,000
900
800
700
600
500
400
300
200
100
-
1991 1996 2001 2006 2011 2016 2020
Houses Townhouses/Flats Apartments Retirement units
Source: Statistics New Zealand Building Consents by SA2, 1990-2020
Figure 2.3 highlights recent growth in importance of more intensive forms of residential accommodation
witihn the Nelson and Tasman regions – in particular retirement accommodation. This growth has mostly
occurred over the past five years (2015 – 2020). The growth in more intensive forms is also concentrated
spatially into Nelson. In 2009, Nelson consented 24 retirement units and 0 apartments. By 2020 this had
grown to 48 retirement units and 57 apartments – although the interveening years the data is lumpy.
Tasman District in this time had an increase from 16 Townhouses/Flats, 0 retirement units and 1 apartment
in 2009 to 38 townhouses and 27 retirement units in 2020 (Table 2.1). Table 2.2 presents the same data
but cut according to the Nelson Tasman urban rural divide.
Interestingly for Nelson City, while there has been an increase in consents for apartments over the past 6
years (2015-2020), up to 125 issued compared with only 27 in the previous 5 years (2010 – 2014), the
number of retirement units has declined slightly (down to 241 over the past 6 years versus 266 for the
previous 5). Standalone dwellings are also growing strongly with over 1,060 consents issued from 2015 –
20, compared with 860 from 2010 – 2014.
In Tasman District, the total number of consents has increased to almost 2,540 (over the 2015-20 period).
This is almost double the number issued between 2010 and 2014 (1,350 an 87% increase). However,
consents for standalone houses have increased by 75% between these 2 periods. Tasman has experienced
a significant increase in consents for Retirement Village Units (up to 229 from 2015 – 2020, up from 36
between 2010 and 2015).
This means standalone houses as a share of total consents is dropping slowly over time. IN the 2000 – 2004
period they made up 90% of building consents issued, by the 2015 – 2020 period they accounted for 81%
of the total. has dropped from 83% to 78% in the combined Nelson and Tasman regions .
Page | 9Table 2.1: Nelson and Tasman Regions Dwelling Consents by Type, 1990 - 2020
Nelson Tasman
Townhouses, Townhouses,
Retirement Retirement
Years Houses Apartments flats, units, Houses Apartments flats, units,
village units village units
other other
1990 - 94 981 846 0 65 1,530 14 59 85
1995 - 99 878 153 20 69 1,612 3 28 55
2000 - 04 1,098 110 55 82 2,093 12 42 47
2005 - 09 1,141 91 110 29 1,284 1 16 57
2010 - 14 862 27 266 72 1,261 1 36 54
2015 - 20 1,061 125 241 55 2,206 0 229 104
Share of Each TA Total
1990 - 94 52% 45% 0% 3% 91% 1% 3% 5%
1995 - 99 78% 14% 2% 6% 95% 0% 2% 3%
2000 - 04 82% 8% 4% 6% 95% 1% 2% 2%
2005 - 09 83% 7% 8% 2% 95% 0% 1% 4%
2010 - 14 70% 2% 22% 6% 93% 0% 3% 4%
2015 - 20 72% 8% 16% 4% 87% 0% 9% 4%
Source: Statistics New Zealand’s, Building Consents by SA2
Table 2.2: Study Area Urban and Rural Dwelling Consents by Type, 1990 - 2020
Nelson Tasman Urban Environment Rural Areas
Townhouse Townhouse
Retirement Retirement
Years Houses Apartments s, flats, Houses Apartments s, flats,
village units village units
units, other units, other
1990 - 94 1,793 854 59 116 718 6 0 34
1995 - 99 1,787 153 48 102 703 3 0 22
2000 - 04 2,216 110 97 98 975 12 0 31
2005 - 09 1,688 91 126 49 737 1 0 37
2010 - 14 1,484 27 302 111 639 1 0 15
2015 - 20 2,412 125 470 129 855 0 0 30
Share of Each TA Total
1990 - 94 64% 30% 2% 4% 95% 1% 0% 4%
1995 - 99 86% 7% 2% 5% 97% 0% 0% 3%
2000 - 04 88% 4% 4% 4% 96% 1% 0% 3%
2005 - 09 86% 5% 6% 3% 95% 0% 0% 5%
2010 - 14 77% 1% 16% 6% 98% 0% 0% 2%
2015 - 20 77% 4% 15% 4% 97% 0% 0% 3%
2.3 Housing Demand
Over the past 25 years, the Nelson and Tasman regions have grown strongly. Between 1996 and 2020 they
have grown by approximately 40% or by around 31,000 residents, collectively. The majority of growth
occurred in Tasman district (57%), where population grew by 17,600 between 1996 and 2020. Nelson City
grew by 13,400 people over this period, which is 43% of the regions’ growth.
Page | 10Figure 2.4: Population Growth 1996 – 2020, Nelson and Tasman Regions
120000
100000
80000
60000
40000
20000
0
1996 1999 2002 2005 2008 2011 2014 2017 2020
Tasman district Nelson city
Source: Statistics New Zealand, Subnational Population Estimates 30 June 1996 - 2020
2.4 Housing Market Prices
Housing Demand has increased markedly in the Nelson and Tasman region. Since 2003 house prices have
more than doubled, from $310,000 to over $680,000 for the median house.11 Compared with six years ago,
since March 2015 median house prices in Tasman have increased by around 64%12. This trend has been
fairly consistent across the two regions, however prices in Nelson have been marginally higher than
Tasman. Nationally, the median house price has increased at a faster rate than in the Nelson and Tasman
regions. This is mostly driven by strong growth in Auckland and its high volume causing Auckland growth
rates to drive the New Zealand national average.
Embodied in this growth is a general price rise (CPI). Over the same time period prices in general have
increased by 40%, meaning that House Price inflation in the Nelson and Tasman region is almost 3 times
general inflation (over the same time period). This is a significant level of price change, yet below the
national average which is driven by Auckland growth.
11 Corelogic (2021) 12-month rolling Dwelling Sales Price (actual) – median price series.
12 Ministry of Housing and Urban Development, Dashboard
Page | 11Figure 2.5: Median House Prices Nelson and Tasman Regions, 2003-2020
$900,000
$800,000
$700,000
$600,000
$500,000
$400,000
$300,000
$200,000
$100,000
$-
2003 2009 2015 2020
Nelson City Tasman District New Zealand
Source: Corelogic (2021) 12 month rolling Dwelling Sales Price – median price series
Demand for rental properties has also been strong in the Nelson and Tasman regions. However, weekly
rents have increased by a smaller amount relative to house prices. The average weekly rent increased from
$240 per week in 2003 to over $450 per week in 2020.13 Interestingly, rental prices have not moved as far
or as fast as house prices as rental prices are more likely to be driven by the need for a place to live,
therefore driven more by population growth. House prices are also driven by things other than the drive
to have somewhere to live. Housing’s role as an investment means prices are tied to capital markets or the
price of other investment goods, interest rates, tax policy and so on.
In the Nelson Tasman area, over the same time period, rentals have almost doubled – which is roughly one-
fifth slower than the rate of house price growth.
13 MBIE (2020) 12-month rolling Dwelling Rents (actual) – nominal mean rents private bond lodgement.
Page | 12Figure 2.6: Median Weekly Rental Nelson and Tasman regions, 2003-2020
$600
$500
$400
$300
$200
$100
$-
New Zealand Tasman District Nelson City
2.5 Findings on the Housing Market Situation
The Nelson and Tasman regions have experienced rapid growth, which has resulted in key changes in the
housing market and housing policy. This growth is expected to continue in the coming decades, with
potential for 30,000 new residents living within regions under the Statistics New Zealand High growth
future (2018 – 2048)14. Growth will place pressure on the urban areas within the regions.
Discussion in this section provides the following key findings about the housing market,
Consent data indicates that the market has been shifting to supply greater numbers of higher
density dwellings, townhouses, flats, apartments and retirement units. Over 22% of new supply is
now in these higher density typologies.
The location of consents has changed over the last three decades, with Tasman district playing a
greater role (57%) and Nelson City reducing in importance (43%).
The majority of growth remains within the Nelson Tasman Urban Environment which has captured
75% of dwelling consents over the past 25 years. This split is reasonably stable on a year to year
basis.
Sales data shows a significant increase in prices over the last two decades, from $310,000 to over
$680,000 for the median dwelling. This rapid increase in prices indicates that housing demand has
been strong in the regions.
Rental costs have grown, albeit at a slower rate compared to the sales data. The average weekly
rent has increased from $240 per week to over $450 per week.
Housing policy has responded to the changing housing market. The implementation of two National Policy
Statements has required councils to provide sufficient capacity for housing within Regional Policy
Statements and District Plans.
14 Statistics New Zealand’s Population Projections, 2018 (base) – 2048.
Page | 133 Housing We’d Choose Method This chapter briefly outlines the data collection methods used in this study. The content provided here is intended to provide the reader with a broad understanding of the techniques used. Further detail is provided in the appendices and Research Firsts’ technical report. 3.1 Survey Method The primary research utilised a mixed-method research design, as it involved initial telephone recruitment of the sample population, who (subject to meeting certain criteria) were invited to complete a survey online. Respondents were asked to agree from the outset to complete the survey. In the initial telephone contact, the purpose of the research was outlined, and people were offered an incentive to participate, in line with standard market research practise. If they agreed, they were then communicated with by email. An online surveying method was used, for a variety of reasons. First, it is not possible to display the visual or the dynamic components of the survey using traditional methods (such as telephone or hard copy). In addition, online data collection is cost-effective, as there is no interviewer presence and labour costs are minimised; and it allows respondents to complete the survey in their own time, which can maximise response rates. The survey combines what had previously been 2 surveys into a single package using the online interview suite NEBU. An overview of the data collection process is shown in Figure 3.1. The second part of the survey required respondents to undertake a discrete choice experiment in which they had to trade-off housing type, size, and location within ‘real world’ financial constraints base on the answers they provided in the first part of the survey and a house price and rental cost framework by location and type developed by M.E from Nelson and Tasman specific housing costs. The fieldwork took place in March and April 2021 and was administered by Research First. Page | 14
Figure 3.1: Overview of data collection process

                                                Initial telephone contact
             Randomised sample of Nelson-Tasman urban residents drawn from Research First’s database. This
               sample was matched to quotas from the sample frame, as interviewers gathered demographic
                             information (household composition and suburb they lived in).
                       The purpose of the research was outlined and email addresses were collected.

                                            Email with link to online survey
               Participants were sent an email containing a hyperlink to the first online survey. This link was
            personal to the individual and matched their responses in the online survey to the information they
                                     had provided during the initial telephone contact.
            The text in the email reiterated the purpose of the project and informed participants that they would
                             need to disclose some personal financial details in the second survey.

                                                    Follow up emails
                         Participants who had not yet completed the survey were sent up to three
                                                   reminders via email.

3.2         Survey Sample
In total, some 14,309 people were contained in the sample. Of these some 891 indicated that they were
interested in taking part in the survey. This represents a response rate of 6%. Of these, approximately 622
respondents completed the survey for a completion rate of 70%. As further outlined in Chapter 4, there
were several points at which respondents could be ‘exited’ from the online survey however, and a total of
450 respondents completed the discrete choice experiment. Regardless of whether respondents
completed the fulfilled discrete choice experiment, they provided information about their preferences and
who they were. This important information has been retained.

Efforts were made during recruitment and sampling to ensure that the final sample represented a variety
of household types across Nelson-Tasman urban area, as it was considered by the research team that
household composition plays a key role in driving housing needs and requirements. The survey was split
between the two regions. In total 315 interviews were carried out with Nelson urban respondents, and
219 in Tasman urban (Figure 3.2).

Details of error margins at contained in Appendix A. However, overall the Survey has a confidence level of
+/-3.9%. This is inside the maximum recommended for these types of surveys (+/-5%). Once the sample
is split between the two regions, the error margins increase (see Appendix A). This limits (to a certain
Page | 15
extent), the reliability of smaller sub-samples and conclusions drawn from them for small towns in Tasman
when viewed in isolation. However, the collective values still apply.
Figure 3.2: Locations – Population, Quota’s and Completed Surveys
Household Surveys % of % of Survey
Location Quota
Estimates Complete Population Respondents
Nelson
Nelson Urban 19,112 289 315 96% 95%
Nelson Rural 710 11 17 4% 5%
Subtotal 19,822 300 332 100% 100%
Tasman
Tasman Urban 11,017 240 219 56% 76%
Tasman Rural 8,535 60 71 44% 24%
Subtotal 19,552 300 290 100% 100%
Nelson Tasman Urban
Environment 30,129 529 534 77% 86%
Source: Research First, Housing Preferences Study, Technical Report, May 2021
In addition, despite best efforts, households with children were under-represented in the final sample,
while couples without children were over-represented. With respect to individual characteristics of the
respondents, it should be noted that Māori, Pacific, and Asian people, and those in younger age groups (29
years and under) and less wealthy (under $30,000 income) were also under-represented, when compared
to the general population. For an overview of the survey sample characteristics please refer to Appendix B.
3.3 Survey Sectors
For the purposes of sample selection and the discrete choice experiment, the Nelson and Tasman regions
were divided into eleven ‘sectors’ according to land value and spatial location, with the goal of defining a
limited number of markets. The sectors are as follows (also refer to map in Figure 3.3):
Sector 1: ‘Nelson Urban - Central’, which covers the City centre and inner suburbs of Nelson.
Sector 2: ‘Nelson Urban - North’, which covers the north suburbs of Nelson.
Sector 3: ‘Nelson Urban - South and Tahunanui’, the suburbs south of Nelson central, which includes
Tahunanui.
Sector 4: ‘Nelson Urban - Stoke’, the urban area around Stoke up to the edge of regional boundary.
Sector 5: ‘Richmond’, the urban area around Richmond.
Sector 6: ‘Motueka’, the urban area around Motueka.
Sector 7: ‘Wakefield-Brightwater’, two townships of Wakefield and Brightwater.
Sector 8: ‘Mapua-Ruby Bay’, the township of Mapua and the coastal area north of the town (Ruby
Bay).
Sector 9: ‘Waimea Plans’, which covers the rural land in the Waimea Plans, which surrounds the
towns in Tasman region.
Page | 16 Sector 10: ‘Tasman Rural’, the remainder of the rural area in Tasman region.
Sector 11: ‘Nelson Rural’, the remainder of the rural area in Nelson region.
Figure 3.3: Survey Sectors within Nelson and Tasman Regions
Each sector covers many suburbs, which have some unifying characteristics and geography, but also have
very different characteristics. In order to identify which sector respondents lived in, they were asked what
suburb they lived in and were later allocated to a sector during the data analysis stage.
The selection of eleven sectors was a compromise between providing sufficient detail and difference across
parts of Nelson and Tasman regions for the choice modelling, and being succinct enough to ensure the
questionnaire was not onerous. The previous Australian and New Zealand studies used similar numbers of
spatial sectors and used land value as a tool to delineate boundaries between sectors.
3.4 Survey Structure
The survey was structured in two separate parts, telephone invitation and online survey.
The telephone invitation was short, with only seven questions. Many of the questions act as a filter to
removing respondents that are not the target of the survey (market researchers, people 18 years and
younger, non-residents) or who do not want to participate in an online survey. The remaining questions
collect information about the respondent, which includes the household make up, suburb, first name and
Page | 17email address. The respondents that successfully passed the invitation criteria were then sent an email
with a link to the online survey.
The online survey asked a range of questions about preferences for housing, which includes questions that
are both unconstrained and constrained by respondents’ financial information. The Survey is separated
into the following five sections,
Section 1: About Your Current Situation, collects information about the respondents current
housing situation. The respondents were asks questions about their current dwelling, type (stand-
alone, attached, apartment, etc), ownership (occupier, rent, etc), length of tenure, intentions to
move (with location considered) and motivation for move.
Section 2: About your Preferred Housing Features, examines how important various features are to
respondents when thinking about choosing a place to live. The respondents were asked to rate the
importance of features of housing on a three-point scale of Not Important, Of some importance
and Very important.
Section 3: Living and Working, which collects information about the respondent’s current address,
where they work and where they would prefer to live in the Nelson and Tasman regions.
Section 4: Financial Situation, collects information about household composition, income,
expenses, liabilities, and assets. This information is used to establish the maximum amount that
the respondent’s household can afford to buy, or to rent.
Section 5: Choice Experiment, this section of the survey shows the respondent four sets of dwellings
that the respondent can afford to buy or rent, with the options shown being constrained by the
financial situation of the respondent. The respondent was shown the four dwellings that they
selected and asked to select which of the dwellings best reflects the housing they would choose.
This report focusses on the results in Section 2 and Section 5 of the online survey. Section 2 asks
respondents about their housing preferences, in terms of types of features i.e. what dwelling would you
like? Section 5 constrains the respondent preferences based on their financial position, i.e. what dwelling
can you afford? The choice experiment tests how respondents undertake trade-offs when deciding which
house to buy?
Page | 184 Demand Preferences Survey In this section of the report, we summarise some of the key findings of the Housing Preferences Survey. First, we explore housing preferences to establish what households are seeking when selecting a dwelling. Household preferences at the conceptual level are then translated into a real-world selection process. In the first instance households are asked to select where they would choose to live in terms of dwelling type and location in an unconstrained way. Finally, they are asked to repeat the process with financial constraints derived from their responses. The outcomes are then compared to provide insight into the manner in which households trade off size, space and location once they are not able to have it all. The focus in this section is on responses from Nelson Tasman Urban Environment respondents, so respondents from the rural areas have been excluded. 4.1 Current Situation The majority of the urban respondents stated that they currently lived in stand-alone dwellings (85%), while 11% lived in a unit or a semi-detached dwelling, 2% lived in an apartment and 2% live in other dwellings.15 Home ownership was relatively high among the sample. Over two thirds (77%) of respondents owned the dwelling they lived in, either with or without a mortgage, and a further 7% stated that a family trust owned the dwelling (it is not possible to ascertain from the results however, whether the person completing the survey was part of that family trust). About one in five (13%) were renting from a private landlord and 3% renting from a community housing provider (Kāinga Ora, Ministry, iwi, a religious group, or a community group). The ownership distribution was the same for Nelson and Tasman respondents. Before being asked to rate what was important to them in choosing a place to live, respondents were asked whether they were planning to move in the next five years, and if so, where to and why. Many were not planning on moving (49%), with almost a quarter indicating that they were considering moving (24%) and the rest (27%) were unsure.16 Of those respondents who stated they were considering moving in the next five years, over two thirds (67%) said they were thinking of moving within Nelson and Tasman area, and 17% said they would move outside of Nelson and Tasman area, while the rest (16%) were unsure. Reasons for considering a move were mixed. For example, while 30% of survey respondents stated that they would move if they had a change in their personal circumstances, 10% said they would consider a move to a better location, 19% would consider a move to a smaller home if they were to move, a further 15 Nelson Urban - stand-alone dwellings (83%), while 13% lived in a unit or a semi-detached dwelling, 2% lived in an apartment and 2% live in other dwellings. Tasman Urban - stand-alone dwellings (88%), while 11% lived in a unit or a semi-detached dwelling, 2% lived in an apartment and 2% live in other dwellings. 16 The plans to move was more or less the same for Nelson and Tasman respondents. Page | 19
8% said they wanted to move to a bigger home. Approximately half of renters wished to move from renting
to buying a home.

Of the people who provide free text reasons for moving many referenced the following reasons; shift to
retirement villages, wish to build, or live on a lifestyle block. Many of the respondents had individual
reasons for wanting to shift, such as travel, gardens, a missing characteristic of existing house, etc.

4.2         What is Important to Households?
The respondents were asked to rate the importance of features of housing on a three-point scale of Not
Important, Of some importance and Very important. The “features of housing” include; its location,
facilities, environment, and the nature of the property. The respondent was then asked to rank the group
of features that they selected as ‘Very Important’.

The set of features respondents could choose from have been drawn from both the HWC studies carried
out in other parts of the country and to reflect local conditions. In the original Auckland work, the selection
set of housing and locational attributes was generated through focus groups held across the city.
Respondents were asked to identify the range and list of attributes that might be important to them when
thinking about choosing a place to live. The set of attributes was generic enough to be applied more
generally to studies of this nature. In subsequent studies, there was a good alignment between the list of
selection attributes and the choices people felt they would make.

4.2.1       Location Features
The 12 features in this category related to ease of access to work, school, tertiary education facility, family
and friends, restaurants and bars, as well as transport options. Because there is no universal measure of
“easy access to”, the survey relied on each respondent to translate “easy access to…” in their own way
relative to their own situation. However, overall, these characteristics did not rate highly relative to the
features in other categories.

The item rated as most important among these features was easy access to shops – over a third rated this
as being very important (Figure 4.1 and Figure 4.2). Other important features include being near family and
friends, access to town centre and access to places of work was very important for 20-30% of respondents.
In summary, the Nelson respondents placed more importance on the location features than Tasman
respondents. However, interestingly Tasman respondents placed higher importance on being near family
and friends, than Nelson respondents.

For Nelson, the item rated as very important the most among these features was also easy access to shops,
however, this was more prominent than in Tasman with 36% rating this as being very important. This was
followed by easy walking/cycling distance to centre, easy access to city or town centre, and easy access to
places of work (Figure 4.1). The lowest proportion rated as being very important was easy access to place
of study and the airport. In general, when compared to Tasman, the features have higher proportions rating
them as very important. This may suggest that respondents in Nelson place a greater value on proximity to
features.

Page | 20
Figure 4.1: Preferences for Location Features of Housing – Nelson Urban

                                               General Location Features - Nelson

                                      Easy access to shops

                        Easy access to City or town centre

                   Easy walking/cycling distance to centre

                           Easy access to centre amenities

                            Easy access to public transport

                             Easy access to places of work

                           Ability to cycle to work or study

                                   Near family and friends

                                          In a familiar area

 Easy access to bars, pubs, nightlife, restaurants and cafes

                                 Easy access to the airport

                              Easy access to place of study

                                             Very important    Of some importance   Not important

For Tasman respondents, the item rated as very important the most among these features was easy access
to shops, where 29% rated this as being very important. This is followed by near family and friends, easy
walking/cycling distance to centre, easy access to city or town centre, and easy access to places of work. The
lowest proportion rated as being very important was easy access to place of study and the airport with 6%
or less of the respondents.

Page | 21
Figure 4.2: Preferences for Location Features of Housing – Tasman Urban
General Location Features - Tasman
Easy access to shops
Near family and friends
Easy walking/cycling distance to centre
Easy access to City or town centre
Easy access to places of work
Easy access to centre amenities
Ability to cycle to work or study
In a familiar area
Easy access to public transport
Easy access to bars, pubs, nightlife, restaurants and cafes
Easy access to the airport
Easy access to place of study
Very important Of some importance Not important
4.2.2 Facilities Features
The ‘facilities’ category included 11 features related to aspects of the neighbouring environment. Generally,
most of these features were not rated as being ‘very important’ (Figure 4.3 and Figure 4.4). The preferences
were different between Nelson and Tasman respondents.
For Nelson the highest rated features were near a park or reserve, community centre, sportsclub/fields and
Near recreational activities. While for Tasman highest rated features were being near a GP/healthcare
provider, and the coast/beach. This may reflect the different distribution of facilities within these two areas,
with respondents in Nelson being comparatively close to healthcare and the coast, relative to Tasman
respondents.
It may also be because Tasman residents are older than Nelson residents, therefore proximity to a GP or
health care provider is more important.
Page | 22Figure 4.3: Preferences for Facilities Features of Housing – Nelson Urban
Proximity to Facilities - Nelson
Near a park or reserve
Near a community centre
Near a sports club/fields
Near a recreation activities involving, walking, running, cycling tracks,
kayaking
Near the coast or beach
Near a library
Near a GP/healthcare provider
Near a hospital
Near a preferred school
Near to a place of worship
Near a gym
Very important Of some importance Not important
Figure 4.4: Preferences for Facilities Features of Housing – Tasman Urban
Proximity to Facilities - Tasman
Near a GP/healthcare provider
Near the coast or beach
Near a park or reserve
Near a recreation activities involving, walking, running, cycling tracks,
kayaking
Near a hospital
Near a library
Near a preferred school
Near to a place of worship
Near a community centre
Near a sports club/fields
Near a gym
Very important Of some importance Not important
Page | 23You can also read