Observations and ancillary information aggregated to monthly time steps across terrestrial ecosystems - ESSD
←
→
Page content transcription
If your browser does not render page correctly, please read the page content below
Earth Syst. Sci. Data, 14, 179–208, 2022
https://doi.org/10.5194/essd-14-179-2022
© Author(s) 2022. This work is distributed under
the Creative Commons Attribution 4.0 License.

             The ABCflux database: Arctic–boreal CO2 flux
          observations and ancillary information aggregated to
           monthly time steps across terrestrial ecosystems

       Anna-Maria Virkkala1 , Susan M. Natali1 , Brendan M. Rogers1 , Jennifer D. Watts1 , Kathleen Savage1 ,
       Sara June Connon1 , Marguerite Mauritz2 , Edward A. G. Schuur3,4 , Darcy Peter1 , Christina Minions1 ,
          Julia Nojeim1 , Roisin Commane5 , Craig A. Emmerton6 , Mathias Goeckede7 , Manuel Helbig8,9 ,
             David Holl10 , Hiroki Iwata11 , Hideki Kobayashi12 , Pasi Kolari13 , Efrén López-Blanco14,15 ,
        Maija E. Marushchak16,17 , Mikhail Mastepanov15,18 , Lutz Merbold19 , Frans-Jan W. Parmentier20,21 ,
          Matthias Peichl22 , Torsten Sachs23 , Oliver Sonnentag9 , Masahito Ueyama24 , Carolina Voigt16,9 ,
             Mika Aurela25 , Julia Boike26,27 , Gerardo Celis28 , Namyi Chae29 , Torben R. Christensen15 ,
           M. Syndonia Bret-Harte30 , Sigrid Dengel31 , Han Dolman32 , Colin W. Edgar30 , Bo Elberling33 ,
           Eugenie Euskirchen30 , Achim Grelle34 , Juha Hatakka25 , Elyn Humphreys35 , Järvi Järveoja22 ,
          Ayumi Kotani36 , Lars Kutzbach10 , Tuomas Laurila25 , Annalea Lohila25,13 , Ivan Mammarella13 ,
         Yojiro Matsuura37 , Gesa Meyer9,38 , Mats B. Nilsson22 , Steven F. Oberbauer39 , Sang-Jong Park40 ,
             Roman Petrov41 , Anatoly S. Prokushkin42 , Christopher Schulze9,43 , Vincent L. St. Louis6 ,
      Eeva-Stiina Tuittila44 , Juha-Pekka Tuovinen25 , William Quinton45 , Andrej Varlagin46 , Donatella Zona47 ,
                                             and Viacheslav I. Zyryanov42
              1 Woodwell      Climate Research Center, 149 Woods Hole Road, Falmouth, MA 02540-1644, USA
                         2 Environmental      Science and Engineering, University of Texas at El Paso,
                                           500W University Rd, El Paso, TX 79902, USA
            3 Center for Ecosystem Science and Society, Northern Arizona University, Flagstaff, AZ 86001, USA
                 4 Department of Biological Sciences, Northern Arizona University, Flagstaff, AZ 86001, USA
                     5 Department of Earth & Environmental Sciences, Lamont-Doherty Earth Observatory,

                                          Columbia University, Palisades, NY 10964, USA
                    6 Department of Biological Sciences, University of Alberta, Edmonton, Alberta, Canada
               7 Department Biogeochemical Signals, Max Planck Institute for Biogeochemistry, Jena, Germany
          8 Department of Physics and Atmospheric Science, Dalhousie University, Halifax, Nova Scotia, Canada
                        9 Departement de Geographie, Universite de Montreal, Montreal, Quebec, Canada
                    10 Institute of Soil Science, Center for Earth System Research and Sustainability (CEN),

                                              Universität Hamburg, Hamburg, Germany
                          11 Department of Environmental Science, Shinshu University, Matsumoto, Japan
              12 Research Institute for Global Change, Japan Agency for Marine-Earth Science and Technology,

                                                          Yokohama, Japan
                       13 Institute for Atmospheric and Earth System Research/Physics, Faculty of Science,

                                              University of Helsinki, Helsinki, Finland
                     14 Department of Environment and Minerals, Greenland Institute of Natural Resources,

                                                  Kivioq 2, 3900, Nuuk, Greenland
                              15 Department of Bioscience, Arctic Research Center, Aarhus University,

                                           Frederiksborgvej 399, 4000 Roskilde, Denmark
         16 Department of Environmental and Biological Sciences, University of Eastern Finland, Kuopio, Finland
            17 Department of Biological and Environmental Science, University of Jyväskylä, Jyväskylä, Finland
               18 Oulanka research station, University of Oulu, Liikasenvaarantie 134, 93900 Kuusamo, Finland

Published by Copernicus Publications.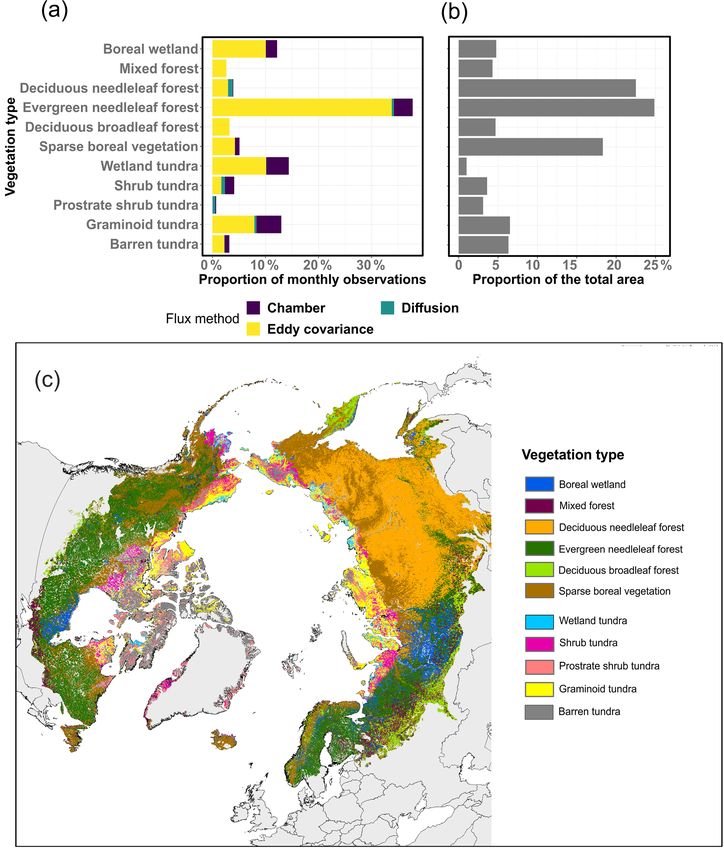
180                                                                           A.-M. Virkkala et al.: The ABCflux database

                             19 Agroscope,        Research Division Agroecology and Environment,
                                            Reckenholzstrasse 191, 8046 Zurich, Switzerland
                          20 Center for Biogeochemistry in the Anthropocene, Department of Geosciences,

                                                 University of Oslo, 0315 Oslo, Norway
            21 Department of Physical Geography and Ecosystem Science, Lund University, 223 62 Lund, Sweden
                22 Department of Forest Ecology and Management, Swedish University of Agricultural Sciences,

                                                         901 83 Umeå, Sweden
                       23 GFZ German Research Centre for Geosciences, Telegrafenberg, Potsdam, Germany
                       24 Graduate School of Life and Environmental Sciences, Osaka Prefecture University,

                                            1-1 Gakuencho, Naka-ku, Sakai, 599-8531, Japan
                            25 Finnish Meteorological Institute, Climate system research, Helsinki, Finland
                             26 Alfred Wegener Institute Helmholtz Center for Polar and Marine Research,

                                             Telegrafenberg A45, 14473 Potsdam, Germany
          27 Geography Department, Humboldt-Universität zu Berlin, Unter den Linden 6, 10099 Berlin, Germany
                                 28 Agronomy Department, University of Florida, Gainesville, FL, USA
                         29 Institute of Life Science and Natural Resources, Korea University, 145 Anam-ro,

                                             Seongbuk-gu, Seoul, 02841, Republic of Korea
                    30 Institute of Arctic Biology, University of Alaska Fairbanks, Fairbanks, AK 99775, USA
          31 Earth and Environmental Sciences Area, Lawrence Berkeley National Lab, Berkeley, CA 94720, USA
                  32 Department of Earth Sciences, Vrije Universiteit Amsterdam, Amsterdam, the Netherlands
                    33 Center for Permafrost, Department of Geosciences and Natural Resource Management,

                                 University of Copenhagen, Øster Voldagde 10, Copenhagen, Denmark
                    34 Department of Ecology, Swedish University of Agricultural Sciences, Uppsala, Sweden
                              35 Department of Geography & Environmental Studies, Carleton University,

                                          1125 Colonel By Dr., Ottawa, ON, K2B 5J5 Canada
                         36 Graduate School of Bioagricultural Sciences, Nagoya University, Nagoya, Japan
            37 Center for International Partnerships and Research on Climate Change, Forestry and Forest Products

                                           Research Institute, 1 Matsunosato, Tsukuba, Japan
         38 Environment and Climate Change Canada, Climate Research Division, Victoria, BC V8N 1V8, Canada
             39 Department of Biological Sciences and Institute of Environment, Florida International University,

                                                         Miami, FL 33199, USA
             40 Division of Atmospheric Sciences, Korea Polar Research Institute, 26 Sondgomirae-ro Yeonsu-gu,

                                                       Incheon, Republic of Korea
        41 Institute for Biological Problems of Cryolithozone, Siberian Branch of the Russian Academy of Sciences,

                                                            Yakutsk, Russia
                    42 VN Sukachev Institute of Forest, Siberian Branch of the Russian Academy of Sciences,

                                          Akademgorodok 50/28, Krasnoyarsk 660036, Russia
                   43 Department of Renewable Resources, University of Alberta, Edmonton, Alberta, Canada
                             44 School of Forest Sciences, University of Eastern Finland, Joensuu, Finland
                     45 Cold Regions Research Centre, Wilfrid Laurier University, Waterloo, Ontario, Canada
                 46 A. N. Severtsov Institute of Ecology and Evolution, Russian Academy of Sciences, 119071,

                                                    Leninsky pr.33, Moscow, Russia
                         47 Department of Biology, San Diego State University, San Diego, California, USA

                       Correspondence: Anna-Maria Virkkala (avirkkala@woodwellclimate.org)

                                   Received: 7 July 2021 – Discussion started: 28 July 2021
                    Revised: 26 November 2021 – Accepted: 29 November 2021 – Published: 21 January 2022

      Abstract. Past efforts to synthesize and quantify the magnitude and change in carbon dioxide (CO2 ) fluxes in
      terrestrial ecosystems across the rapidly warming Arctic–boreal zone (ABZ) have provided valuable informa-
      tion but were limited in their geographical and temporal coverage. Furthermore, these efforts have been based
      on data aggregated over varying time periods, often with only minimal site ancillary data, thus limiting their
      potential to be used in large-scale carbon budget assessments. To bridge these gaps, we developed a standard-
      ized monthly database of Arctic–boreal CO2 fluxes (ABCflux) that aggregates in situ measurements of terres-
      trial net ecosystem CO2 exchange and its derived partitioned component fluxes: gross primary productivity and

Earth Syst. Sci. Data, 14, 179–208, 2022                                         https://doi.org/10.5194/essd-14-179-2022
A.-M. Virkkala et al.: The ABCflux database                                                                                 181

       ecosystem respiration. The data span from 1989 to 2020 with over 70 supporting variables that describe key
       site conditions (e.g., vegetation and disturbance type), micrometeorological and environmental measurements
       (e.g., air and soil temperatures), and flux measurement techniques. Here, we describe these variables, the spatial
       and temporal distribution of observations, the main strengths and limitations of the database, and the potential
       research opportunities it enables. In total, ABCflux includes 244 sites and 6309 monthly observations; 136 sites
       and 2217 monthly observations represent tundra, and 108 sites and 4092 observations represent the boreal biome.
       The database includes fluxes estimated with chamber (19 % of the monthly observations), snow diffusion (3 %)
       and eddy covariance (78 %) techniques. The largest number of observations were collected during the climato-
       logical summer (June–August; 32 %), and fewer observations were available for autumn (September–October;
       25 %), winter (December–February; 18 %), and spring (March–May; 25 %). ABCflux can be used in a wide ar-
       ray of empirical, remote sensing and modeling studies to improve understanding of the regional and temporal
       variability in CO2 fluxes and to better estimate the terrestrial ABZ CO2 budget. ABCflux is openly and freely
       available online (Virkkala et al., 2021b, https://doi.org/10.3334/ORNLDAAC/1934).

1   Introduction                                                  be used to measure the transport of CO2 within a snowpack
                                                                  (Björkman et al., 2010b). The eddy covariance technique has
The Arctic–boreal zone (ABZ), comprising the northern tun-        been used globally for over three decades and chamber and
dra and boreal biomes, stores approximately half the global       diffusion techniques for even longer.
soil organic carbon pool (Hugelius et al., 2014; Tarnocai et         Historically, the number and distribution of ABZ flux sites
al., 2009; Mishra et al., 2021). As indicated by this large       has been rather limited compared to observations in tem-
carbon reservoir, the ABZ has acted as a carbon sink over         perate regions (Baldocchi et al., 2018). Due to these data
the past millennia due to the cold climate and slow de-           gaps, quantifying the net annual CO2 balance across the
composition rates (Siewert et al., 2015; Hugelius et al.,         ABZ has posed a significant challenge (Natali et al., 2019a;
2020; Gorham, 1991). However, these carbon stocks are in-         McGuire et al., 2016; Virkkala et al., 2021a). However, over
creasingly vulnerable to climate change, which is occurring       the past decade, the availability of ABZ flux data has in-
rapidly across the ABZ (Box et al., 2019). As a result, car-      creased substantially. Many, but not all, of the ABZ eddy
bon is being lost from this reservoir to the atmosphere as        covariance sites are a part of broader networks, such as the
carbon dioxide (CO2 ) through increased ecosystem respira-        global FLUXNET and regional AmeriFlux, Integrated Car-
tion (Reco) (Schuur et al., 2015; Parker et al., 2015; Voigt      bon Observation System (ICOS) and the European Fluxes
et al., 2017). The impact of increased CO2 emissions on           Database Cluster (EuroFlux), where data are standardized
global warming depends on the extent to which respiratory         and openly available (Paris et al., 2012; Novick et al., 2018;
losses are offset by gross primary productivity (GPP), the        Pastorello et al., 2020). These networks primarily include
vegetation uptake of atmospheric CO2 via photosynthesis           flux and meteorological data but do not often include other
(McGuire et al., 2016; Cahoon et al., 2016).                      environmental descriptions such as soil carbon stocks, dom-
   Carbon dioxide flux measurements provide a means to            inant plant species, or the disturbance history of a given site
monitor the net CO2 balance (i.e., net ecosystem exchange;        (but see, for example, Biological, Ancillary, Disturbance, and
NEE, a balance between GPP and Reco) across time and              Metadata data in Ameriflux), which are important for under-
space (Baldocchi, 2008; Pavelka et al., 2018). There are three    standing the controls on CO2 fluxes. Moreover, even though
main techniques used to measure fluxes at the ecosystem           some ABZ annual chamber measurements are included in the
level that represent fluxes from plants and soils to the at-      global soil respiration database (SRDB) (Jian et al., 2021),
mosphere: eddy covariance, automated and manual cham-             and in the continuous soil respiration database (COSORE)
bers, and snow diffusion methods (hereafter diffusion; for a      (Bond-Lamberty et al., 2020), standardized datasets provid-
comparison of the techniques, see Table 1 in McGuire et al.,      ing ABZ CO2 flux measurements from eddy covariance,
2012). The eddy covariance technique estimates NEE at the         chambers, and diffusion, along with comprehensive meta-
ecosystem scale (ca. 0.01 to 1 km2 footprint) at high temporal    data, have been nonexistent. Such an effort would create
resolution (i.e., 1/2 h) using nondestructive and automated       potential for a more thorough understanding of ABZ CO2
measurements (Pastorello et al., 2020). Automated and man-        fluxes. Therefore, compiling these flux measurements and
ual chamber techniques measure NEE at fine spatial scales         their supporting ancillary data into one database is clearly
(< 1 m2 ) and in small-statured ecosystems, common in the         needed to support future modeling, remote sensing, and em-
tundra, where the chambers can fit over the whole plant com-      pirical data mining efforts.
munity (Järveoja et al., 2018; López-Blanco et al., 2017). The       Arctic–boreal CO2 fluxes have been previously synthe-
diffusion technique, also operating at fine spatial scales, can   sized in a handful of regional studies (Belshe et al., 2013;

https://doi.org/10.5194/essd-14-179-2022                                            Earth Syst. Sci. Data, 14, 179–208, 2022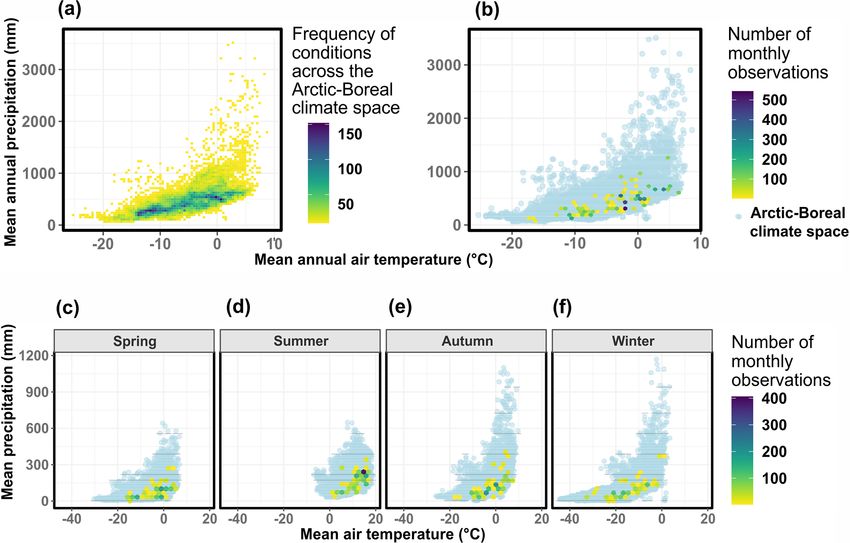
182                                                                                         A.-M. Virkkala et al.: The ABCflux database

Table 1. A summary of past CO2 flux synthesis efforts. If site numbers were not provided in the paper, this was calculated as the number of
unique sets of coordinates. Note: n/a – not applicable.

  Study               Number      Synthesized fluxes              Study domain               Study period             Flux aggregation
                       of sites   and measurement
                                  techniques
  Luyssaert et al.         n/a    GPP, Reco, and NEE mea-         Global forests (includ-    n/a                      Annual
  (2007)                          sured with eddy covariance      ing boreal)
  McGuire et al.            66    GPP, Reco, and NEE mea-         Arctic tundra              Measurements from        Annual, growing
  (2012)                          sured with chambers, eddy                                  1966–2009; focus on      and winter season
                                  covariance, diffusion tech-                                1990–2009
                                  nique and soda lime
  Belshe et al.             34    GPP, Reco, and NEE mea-         Arctic tundra              Measurements     from    Annual, growing
  (2013)                          sured with chambers, eddy                                  1966–2010                and winter season
                                  covariance, diffusion tech-
                                  nique and soda lime
  Baldocchi et al.           9    GPP, Reco, and NEE mea-         Global    (including       n/a (sites with 5–       Annual
  (2018)                          sured with eddy covariance      boreal and tundra          18 years of measure-
                                                                  biomes)                    ments)
  Virkkala et al.         117     GPP, Reco, and NEE mea-         Arctic tundra              Studies published dur-   Growing season
  (2018)                          sured with chambers                                        ing 2000–2016
  Natali et al.           104     Soil respiration and NEE        Northern    permafrost     Measurements from        Monthly or sea-
  (2019a)                         measured with chambers,         region                     1989–2017, focus on      sonal during winter
                                  eddy covariance, diffusion                                 2000–2017
                                  technique, and soda lime
  Virkkala et al.         148     GPP, Reco, and NEE mea-         Arctic tundra and bo-      1990–2015                Annual and grow-
  (2021a)                         sured with chambers and         real biomes                                         ing season
                                  eddy covariance
  ABCflux                 244     GPP, Reco, and NEE (with        Arctic tundra and bo-      1989–2020                Monthly (whole
  version 1                       some soil respiration and       real biomes                                         year)
  (this study)                    forest floor fluxes) measured
                                  with chambers, eddy covari-
                                  ance, and diffusion tech-
                                  nique

McGuire et al., 2012; Luyssaert et al., 2007; Baldocchi et               has several advantages over the seasonal fluxes. These ad-
al., 2018; Virkkala et al., 2018, 2021a; Natali et al., 2019a)           vantages include (i) better comparability of measurements,
(Fig. 1 and Table 1). One of the main challenges in these                (ii) ability to bypass problems related to defining seasons
previous efforts, in addition to the limited geographical cov-           across large regions, and (iii) ease of linking these fluxes to
erage of ABZ sites and lack of environmental descriptions,               remote sensing and models.
has been the variability of the synthesized seasonal measure-               Our goal is to build upon past synthesis efforts and com-
ment periods. Most of these efforts have allowed the seasonal            pile a new database of Arctic–boreal CO2 fluxes (ABCflux
definitions and measurement periods to vary across the sites,            version 1) that combines eddy covariance, chamber, and dif-
creating uncertainty in the inter-site comparison of flux mea-           fusion data at monthly timescales with supporting environ-
surements. An alternative approach to define seasonality is to           mental information to help facilitate large-scale assessments
focus on standard time periods such as months (Natali et al.,            of the ABZ carbon cycle. This paper provides a general de-
2019a). Although focusing on monthly fluxes may result in a              scription of the ABCflux database by characterizing the data
small decrease in synthesizable data, because publications,              sources and database structure (Sect. 2), as well as describing
particularly older ones, often provide seasonal rather than              the characteristics of the database (Sect. 3). Additionally, we
monthly flux estimates (see, e.g., Euskirchen et al., 2012;              describe the main strengths, limitations, and opportunities of
Nykänen et al., 2003; Björkman et al., 2010a; Oechel et                  this database (Sect. 4) and its potential utility for future stud-
al., 2000; Merbold et al., 2009), compiling monthly fluxes               ies aiming to understand terrestrial ABZ CO2 fluxes.

Earth Syst. Sci. Data, 14, 179–208, 2022                                                      https://doi.org/10.5194/essd-14-179-2022
A.-M. Virkkala et al.: The ABCflux database 183
Figure 1. The flux site distribution in previous syntheses that fo-
cused on compiling fluxes from high latitudes (McGuire et al.,
2012; Belshe et al., 2013; Natali et al., 2019a; Virkkala et al., 2021a;
and this study, ABCflux). The Arctic–boreal zone is highlighted
in dark grey; countries are shown in the background. Based on
the unique latitude–longitude coordinate combinations in the tun-
dra, there were 136 tundra sites in ABCflux, 104 tundra sites in
Virkkala et al. (2021a), 68 tundra sites in Natali et al. (2019a), 34
tundra sites in Belshe et al. (2013), and 66 tundra sites in McGuire
et al. (2012). Observations that were included in previous studies
but not in ABCflux represent fluxes aggregated over seasonal, not
monthly periods.
2 Data and methods
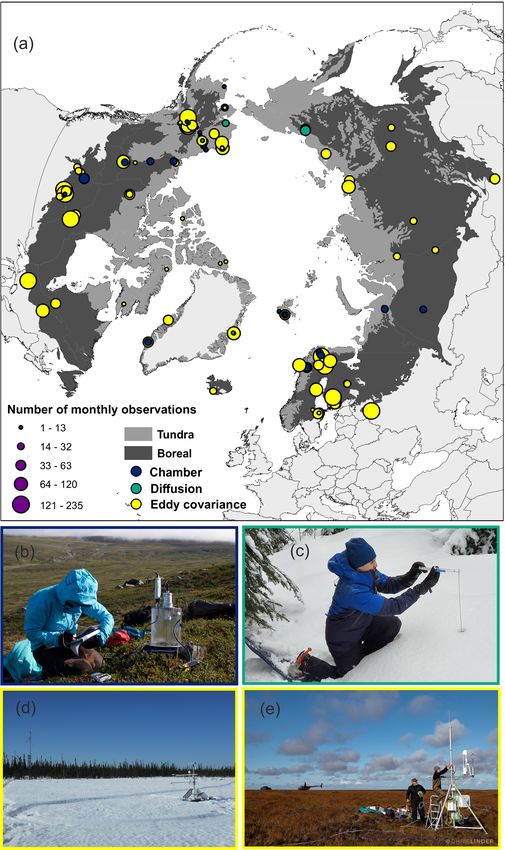
ABCflux focuses on the area covered by the northern tundra Figure 2. Map showing the distribution and measurement tech-
and boreal biomes (> 45◦ N), as characterized in Dinerstein nique at each site (a), and examples of a manual chamber (b),
et al. (2017), Fig. 2, and compiles in situ measured terrestrial diffusion measurements (c), and two eddy covariance towers in
ecosystem-level CO2 fluxes aggregated to monthly time peri- a wetland–forest and tundra ecosystem (d, e). Photographs were
taken in Kilpisjärvi, Finland (July 2016), Montmorency forest,
ods (unit: g C m−2 per month). We chose this aggregation in-
Canada (April 2021), Scotty Creek, Canada (April, 2014), and
terval as monthly temporal frequency is a common, straight-
Yukon–Kuskokwim Delta, Alaska (September 2019). Image cred-
forward, and standard interval used in many synthesis, mod- its for panels (b)–(e): Markus Jylhä, Alex Mavrovic, Gabriel Hould
eling studies, remote sensing products, and process model Gosselin, Chris Linder, and Manuel Helbig.
output (Didan, 2015; Natali et al., 2019a; Hayes et al., 2014).
Furthermore, scientific papers often report monthly fluxes,
facilitating accurate extraction to ABCflux. We compiled
only aggregated fluxes to allow easy usage of the database fluence the estimated fluxes. If a potential data user requires
and to keep the database concise and cohesive. We designed fluxes at higher temporal frequency or is interested to study
this database so that these monthly fluxes, compiled from sci- the uncertainties related to flux processing, we suggest they
entific papers or data repositories or contributed by site prin- utilize data from other flux repositories (see Sect. 2.1.2.) or
cipal investigators (PIs), can be explored from as many sites contact PIs.
as possible and across different months, regions and ecosys- Although the three flux measurement techniques included
tems. The database is not designed for studies exploring flux in ABCflux primarily measure NEE, chamber and eddy
variability within a month, or how different methodological covariance techniques can also be used to estimate GPP
decisions (e.g., flux filtering or partitioning approaches) in- (the photosynthetic flux) and Reco (comprising emissions
https://doi.org/10.5194/essd-14-179-2022 Earth Syst. Sci. Data, 14, 179–208, 2022184 A.-M. Virkkala et al.: The ABCflux database
from autotrophic and heterotrophic respiration) (Keenan and using Plot Digitizer (http://plotdigitizer.sourceforge.net/, last
Williams, 2018), which are also included in the database. At access: 16 October 2019) and converted to our flux units
eddy covariance sites, GPP and Reco are indirectly derived (g C m−2 per month) if needed. Data from experimental treat-
from NEE using partitioning methods that primarily use light ments were excluded; however, we included flux data from
and temperature data (Lasslop et al., 2010; Reichstein et al., unmanipulated control plots. Monthly non-growing season
2005). At chamber sites, Reco can be measured directly with fluxes from Natali et al. (2019a) were extracted from the re-
dark chambers, from which GPP can be calculated by sub- cently published data compilation (Natali et al., 2019b). Win-
tracting Reco from NEE (Shaver et al., 2007). In general, ter chamber or diffusion measurements in forests from Natali
these partitioned GPP and Reco fluxes have higher uncer- et al. (2019b) were included in the “ground_nee” field, which
tainties than the NEE measurements since they are modeled represents forest understory (not whole-ecosystem) NEE.
based on additional data and various assumptions (Aubinet et
al., 2012). However, GPP and Reco fluxes were included in 2.1.2 Flux repositories
ABCflux because these component fluxes may help to better
understand and quantify the underlying processes of land– We downloaded eddy covariance and supporting environ-
atmosphere CO2 exchange. mental data products from AmeriFlux (Novick et al., 2018),
In addition to CO2 fluxes, we gathered information de- Fluxnet2015 (Pastorello et al., 2020), EuroFlux database
scribing the general site conditions (e.g., site name, coordi- cluster (ICOS, Carbon Extreme, Carbo Africa, GHG Eu-
nates, vegetation type, disturbance history, a categorical soil rope, Carbo Italy, INGOS) (Paris et al., 2012; Valentini,
moisture variable, and soil organic carbon stocks), microm- 2003), and Station for Measuring Ecosystem–Atmosphere
eteorological and environmental measurements (e.g., air and Relations (Hari et al., 2013). Data that were filtered for US-
soil temperatures, precipitation, soil moisture, snow depth), TAR (i.e., low friction velocity conditions) and gap-filled
and flux measurement technique (e.g., measurement fre- were downloaded from repositories in 2018–2020. USTAR
quency, instrumentation, gap-filling and partitioning method, varied among sites due to differing site-level assumptions.
number of spatial replicates for chamber measurements, flux We downloaded only gap-filled data that met the USTAR cri-
data quality), wherever possible. teria for either the tower PI or given through the database
processing pipeline. However, Fluxnet2015 provides several
different methods for determining data quality based on dif-
2.1 Data sources ferent USTAR criteria. In this case, we used the Fluxnet2015
common USTAR threshold (CUT, i.e. all years at the site
2.1.1 Literature search
filtered with the same USTAR threshold; Pastorello et al.,
We identified potential CO2 flux studies and sites from prior 2020). For observations extracted from EuroFlux, USTAR
synthesis efforts (Belshe et al., 2013; McGuire et al., 2012, thresholds for each site were derived as described in Papale et
2018, 2021b; Natali et al., 2019a), including a search of ci- al. (2006) and Reichstein et al. (2005), using nighttime data.
tations within and of the studies included in these prior syn- We extracted fluxes readily aggregated to monthly intervals
theses. We also conducted a literature search in Web of Sci- by the data processing pipeline from Fluxnet2015 and Eu-
ence with the following search words: “carbon flux” or “car- roFlux. These aggregations were not given in AmeriFlux and
bon dioxide flux” or “NEE” or “net ecosystem exchange” SMEAR. We downloaded daily gap-filled data from these
and “arctic” or “tundra” or “boreal”. This was done to en- repositories and summed the data to monthly time steps. We
sure that our database included the most recent publications. did not aggregate any repository GPP, Reco, or NEE datasets
We included studies that reported at least NEE, presented at that were not gap-filled. If fluxes were available for the same
monthly or finer temporal resolution, and had supporting en- site and period both in Natali et al. (2019b) and flux repos-
vironmental ancillary data describing the sites. We did not itory extractions, the flux repository observations were kept
include fluxes reported at longer time steps (e.g., seasonal in the database. Some repositories supplied eddy covariance
aggregations), which, based on our rough estimate, resulted data version numbers, which were added to the flux database.
in a 10 %–20 % loss of data from sites and periods that would
have been new to ABCflux. These excluded data primarily 2.1.3 Permafrost Carbon Network data solicitation
included some older, non-active eddy covariance sites and
A community call was solicited in 2018 through a CO2 flux
seasonal chamber measurements (e.g., Nobrega and Grogan,
synthesis workshop (Parmentier et al., 2019; Arctic Data
2008; Heliasz et al., 2011; Fox et al., 2008). However, many
Center, 2021), whereby the network of ABZ flux researchers
of these data were located in the vicinity of existing sites
was contacted and invited to contribute their most current un-
covered by ABCflux (e.g., Daring Lake, Abisko); thus ex-
published eddy covariance and chamber data. This resulted
cluding these measurements does not dramatically influence
in an additional 39 sites and 1372 monthly observations (see
the geographical coverage of the sites. We extracted our vari-
column extraction_source).
ables of interest (Sect. 2.3.) from these selected papers dur-
ing 2018–2020. Data from line and bar plots were extracted
Earth Syst. Sci. Data, 14, 179–208, 2022 https://doi.org/10.5194/essd-14-179-2022A.-M. Virkkala et al.: The ABCflux database 185
2.2 Partitioning approaches at eddy covariance flux quality flag field for the aggregated data differs from the ones
sites calculated for half-hourly data derived directly from eddy co-
variance tower processing programs (such as Eddypro). We
ABCflux compiles eddy covariance observations that were removed monthly data with a quality flag of 0. Data with
primarily partitioned using nighttime Reco, which is based quality flags > 0 were left within the database for the user to
on the assumption that during night, NEE measured at low decide on additional screening criteria. Note that the monthly
light levels is equivalent to Reco (Reichstein et al., 2005). data produced by the repository processing pipeline do not
This nighttime partitioning approach has been the most fre- include separate gap-filled percentages or errors of model
quently used approach to fill gaps in flux time series (Wut- fit for NEE similar to those associated with the half-hourly
zler et al., 2018) due to its simplicity, strong evidence of data. However, we included these fields to the database as
temperature sensitivity of respiration, and direct use of Reco PIs contributing data or scientific papers sometimes had this
(i.e. nighttime NEE) flux data to estimate temperature re- information; however these fields were not used in data qual-
sponse curves (Reichstein et al., 2005). As the nighttime ity screening. Both the monthly quality flag and gap-filled
approach was one of the first widely used partitioning ap- percentage fields describe the number and quality of the gap-
proaches, fluxes partitioned with the approach were the only filled data that needed to be filled due to, for example, instru-
ones available in the flux repositories at some of the older ment malfunction, power shortage, extreme weather events,
sites. Daytime partitioning and other approaches started to and periods with insufficient turbulence conditions.
develop more rapidly in the 2010s (Lasslop et al., 2010; Tra- At chamber and diffusion sites, we disregarded observa-
montana et al., 2020). Each of the partitioning approaches tions including a low number of temporal replicates within
has uncertainties related to the ecological assumptions, input a month (< 3 individual measurements in summer months)
data, model parameters, and statistical approaches used to fill and only one measurement month to ensure the tempo-
the gaps. ral representativeness of the measurements. For the spring
PIs that submitted data to us directly gap-filled and parti- (March–May), autumn (September–November), and winter
tioned fluxes using the approach that they determined works (December–February) months, one temporal replicate was
best at their site. Based on similar logic, fluxes extracted from accepted due to scarcity of measurements outside the sum-
papers were not always partitioned using the nighttime ap- mer season (June–August); measurement frequency is in-
proach. In these cases, we trusted the expertise of PIs and cluded in the database. We excluded monthly summertime
authors and included fluxes partitioned using other methods. measurements with < 3 temporal replicates because within
Although this created some heterogeneity in the flux process- summer months, meteorological conditions and the pheno-
ing algorithms in the database, this approach was chosen so logical status of the ecosystem can vary significantly (Lafleur
that we could be more inclusive with the represented sites. et al., 2012; Euskirchen et al., 2012; Schneider et al., 2012;
Thus, in summary, our goal was to compile fluxes that (1) Heiskanen et al., 2021), and a single measurement is unlikely
can be easily compared with each other (i.e., have been gap- to capture this variability. Our decision to exclude measure-
filled and partitioned in a systematic way), (2) are as accurate ments that have only one measurement month was based on
as possible given the site conditions and measurement setup our goal to assess the temporal variability of fluxes. We justi-
(i.e., other approaches were accepted if this was suggested by fied the acceptance of a lower number of temporal replicates
the PI), and (3) summarize information about the processing for the other seasons based on the assumption that flux vari-
algorithms used. ability is lower during the winter months, and at least during
most of the spring and autumn months, due to the insulat-
2.3 Data quality screening ing effects of snow (Aurela et al., 2002; Bäckstrand et al.,
2010). We estimate that excluding measurements with < 3
We screened for poor-quality data, potential unit and temporal replicates during the summer months resulted in a
sign convention issues, and inaccurate coordinates. Repos- 10 % loss of data. In total, 98 % of the chamber observations
itory eddy covariance data were processed and qual- were from published studies; we assume that the peer review
ity checked using quality flags associated with monthly process assessed the quality of published data.
data supplied by the repository processing pipeline. We further screened for spatial coordinate accuracy by vi-
Fluxnet2015 and EuroFlux database include a data qual- sualizing the sites on a map. If a given site was located in
ity flag for the monthly aggregated data indicating percent- water or had imprecise coordinates, the site researchers were
age of measured (quality flag QC = 0 in FLUXNET2015) contacted for more precise coordinates. We screened for po-
and good-quality gap-filled data (quality flag QC = 1 tential duplicate sites and observations that were extracted
in FLUXNET2015; average from monthly data; 0 = from different data sources. Duplicate NEEs extracted from
extensive gap-filling, 1 = low gap-filling); for more de- papers that were also extracted from flux repositories were
tails see the Fluxnet2015 web page (https://fluxnet.org/data/ compared to estimate uncertainties associated with paper
fluxnet2015-dataset/variables-quick-start-guide/last access: extractions using Plot Digitizer as a means for extracting
7 October 2020) and Pastorello et al. (2020). Note that this monthly fluxes. A linear regression between paper (Plot Dig-
https://doi.org/10.5194/essd-14-179-2022 Earth Syst. Sci. Data, 14, 179–208, 2022186 A.-M. Virkkala et al.: The ABCflux database
itizer) and repository extraction showed that data extracted polar Arctic Vegetation Map (CAVM) for the tundra biome
using Plot Digitizer were highly correlated with data from resampled to the same resolution as the ESA CCI product
online databases, providing confidence in estimates extracted (Raynolds et al., 2019). ESA CCI layers were reclassified
using Plot Digitizer (R 2 = 0.91, slope = 1.002, n = 192). by grouping land cover types to the same vegetation type
Out of these duplicate observations, we only kept the data ex- classes represented by ABCflux: boreal wetland and peatland
tracted from the repository in the database. Finally, we asked (from now on, boreal wetland; classes 160, 170, 180 in ESA
site PIs to verify that the resulting information was correct. CCI product), deciduous broadleaf forest (60–62), evergreen
needleleaf forest (70–72), deciduous needleleaf forest (80–
2.4 Database structure and columns
82), mixed forest (90), and sparse and mosaic boreal vegeta-
tion (40, 100, 100, 120, 121, 122, 130, 140, 150, 151, 152,
The resulting ABCflux database includes 94 variables: 16 are 153, 200, 201, 202). Croplands (10, 11, 12, 20, 30) and ur-
flux measurements and associated metadata (e.g., NEE, mea- ban areas (190) were removed. We used the five main phys-
surement date and duration), 21 describe flux measurement iognomic classes from CAVM in the tundra. Glaciers and
methods (e.g., measurement frequency, gap-filling method), permanent water bodies included in either of these products
49 describe site conditions (e.g., soil moisture, air tempera- were removed. Note that in ABCflux and for the site-level
ture, vegetation type), and 8 describe the extraction source visualizations in this paper, vegetation type for each of the
(e.g., primary author or site PI, citation, data maturity). A to- flux sites was derived from site-level information, not these
tal of 61 variables are considered static and thus do not vary geospatial layers. These same glacier, water, and cropland
with repeated measurements at a site (e.g., site name, coor- masks were applied to the country boundaries (Natural Earth
dinates, vegetation type), while 33 variables are considered Data, 2021) to calculate the terrestrial area of each country.
dynamic and vary monthly (e.g., soil temperature). Table 2 We further used TerraClimate annual and seasonal air tem-
includes a description of each of the 94 variables, as well as perature and precipitation layers averaged over 1989–2020
the proportion of monthly observations present in each col- to visualize the distribution of monthly observations across
umn. ABCflux is shared as a comma separated values (csv) the Arctic–boreal climate space (Abatzoglou et al., 2018).
file with 6309 rows; however, not all the rows have data in
each column (indicated by NA for character columns and
3 Database summary
−9999 for numeric columns).
We refer to all fields included in ABCflux as “observa- 3.1 General characteristics of the database
tions” although we acknowledge that, for example, GPP and
Reco are indirectly derived variables at eddy covariance sites ABCflux includes 244 sites and 6309 monthly observations,
and that some flux and ancillary data can also be partly gap- out of which 136 sites and 2217 monthly observations are
filled. Further, our database does not include the actual raw located in the tundra (54 % of sites and 52 % of observations
observations; rather it provides monthly aggregates. Positive from North America, 46 % and 48 % from Eurasia), while
values for NEE indicate net CO2 loss to the atmosphere (i.e., 108 sites and 4092 monthly observations are located in the
CO2 source), and negative numbers indicate net CO2 uptake boreal biome (59 % of sites and 58 % of observations from
by the ecosystem (i.e., CO2 sink). For consistency, GPP is North America, 41 % and 42 % from Eurasia) (Table 3). The
presented as negative (uptake) values and Reco as positive. largest source of flux data is the flux repositories (48 % of the
monthly observations), while flux data extracted from papers
2.5 Database visualization
or contributed by site PIs amount to 30 % and 22 % of the
monthly observations, respectively. The database primarily
The visualizations in this paper were made with the full includes sites in unmanaged ecosystems, but it does contain
ABCflux database using each site month as a unique data a small number (6) of sites in managed forests.
point (from now on, these are referred to as monthly The majority of observations in ABCflux have been mea-
observations) and the sites listed in the “study_id_short” sured with the eddy covariance technique (119 sites and
field. We visualized these across the vegetation types 4957 monthly observations), whereas chambers and diffu-
(“veg_type_short”), countries (“country”), biomes sion methods were used at 125 sites and 1352 observa-
(“biome”), and measurement method (“flux_method”). tions (Table 3). About 46 % of the eddy covariance mea-
To understand the distribution and representativeness of surements are based on gas analyzers using closed-path tech-
monthly observations and sites across the ABCflux as well nology (including enclosed analyzers), 40 % are based on
as the entire ABZ, we used geospatial data to calculate the open-path technology, 5 % include both and 8 % are un-
aerial coverages of each vegetation type and country. Veg- known. A total of 52 % of chamber measurements were
etation type was derived from the European Space Agency automated chambers (monitoring the fluxes continuously
Climate Change Initiative’s (ESA CCI) land cover product throughout the growing season). Only 3 % of the measure-
aggregated and resampled to 0.0083◦ for the boreal biome ments were completed using diffusion methods during the
(Lamarche et al., 2013) and the raster version of the Circum- winter. Chamber and diffusion studies were primarily from
Earth Syst. Sci. Data, 14, 179–208, 2022 https://doi.org/10.5194/essd-14-179-2022A.-M. Virkkala et al.: The ABCflux database 187
Table 2. Database variables and the proportion of monthly observations in each variable. There are in total 6309 monthly observations in the
database.
Variable Variable description Details Proportion
and units of monthly
observations
having data
id ID given to each indi- 100 %
vidual monthly entry at
each site
study_id ID given to study/site (PI/first author of 100 %
entry (see Details) publication)_(site name)_(tower/chamber)_(#); e.g.,
Schuur_EML_Tower_1. Note that there might be several cham-
ber (or tower) Study_IDs for one site.
study_id_short ID given to study/site (PI/first author of 100 %
entry (see Details), in- publication)_(site name)_(tower/chamber)_(#); e.g.,
dividual chamber plots Schuur_EML_Tower_1.
within a site not differ-
entiated
site_name Site name as specified Usually the location name 100 %
in data source
site_reference A more specific name For towers, this is often the acronym for the site, and for cham- 95 %
used in data source bers, this is the name of the particular chamber plot
country Country of the site 100 %
latitude Decimal degrees, as 100 %
precise as possible
longitude Decimal degrees, as Negative longitudes are west from Greenwich 100 %
precise as possible
start_date Date on which mea- mm/dd/yyyy 100 %
surement starts
end_date Date on which mea- mm/dd/yyyy 100 %
surement ends
meas_year Year in which data were 100 %
recorded
season Season in which data summer, autumn, winter, spring (based on climatological sea- 100 %
were recorded sons)
interval_month Measurement month 100 %
start_day Start day of the mea- 100 %
surement
end_day End day of the mea- 100 %
surement
duration Number of days dur- Should be the same as End_Day because this database compiles 100 %
ing the measurement monthly fluxes
month
biome Biome of the site Boreal, tundra 100 %
https://doi.org/10.5194/essd-14-179-2022 Earth Syst. Sci. Data, 14, 179–208, 2022188 A.-M. Virkkala et al.: The ABCflux database
Table 2. Continued.
Variable Variable description Details Proportion
and units of monthly
observations
having data
veg_type A detailed vegetation B1 = cryptogram, herb barren; B2 = cryptogram bar- 100 %
type for the site ren complex; B3 = noncarbonate mountain complex;
B4 = carbonatemountain complex; G1 = rush/grass, forb,
cryptogram tundra; G2 = graminoid, prostrate dwarf-shrub,
forb tundra; G3 = nontussock sedge, dwarf-shrub, moss tundra;
G4 = tussock-sedge, dwarf-shrub, herb tundra; P1 = prostrate
dwarf-shrub, herb tundra; P2 = prostrate/hemiprostrate dwarf-
shrub tundra; S1 = erect dwarf-shrub tundra; S2 = low-shrub
tundra; W1 = sedge/grass, moss wetland; W2 = sedge, moss,
dwarf-shrub wetland; W3 = sedge, moss, low-shrub wetland;
DB = deciduous broadleaf forest; EN = evergreen needleleaf
forest; DN = deciduous needleleaf forest; MF = mixed forest;
SB = sparse boreal vegetation; BW = boreal wetland or peat-
land, following Watts et al. (2019). For more details about the
tundra vegetation types, see Walker et al. (2005). These classes
were classified based on information in Site_Reference and
Veg_detail columns, or were contributed by the site PI.
veg_type_short A more general vegeta- B = barren tundra; G = graminoid tundra; P = prostrate dwarf- 100 %
tion type for the site shrub tundra; S = shrub tundra; W = tundra wetland; DB =
deciduous broadleaf forest; EN = evergreen needleleaf forest;
DN = deciduous needleleaf forest; MF = mixed forest; SB =
sparse boreal vegetation; BW = boreal wetland or peatland. For
more details about the tundra vegetation types, see Walker et al.
(2005). These classes were classified based on information in
Site_Reference and Veg_detail columns, or were contributed by
the site PI.
veg_detail Detailed vegetation 96 %
description from data
source/contributor
permafrost Reported presence or Yes, no 73 %
absence of permafrost
disturbance Last disturbance Fire, harvest, thermokarst, drainage, grazing, larval outbreak, 30 %
drought
disturb_year Year of last disturbance Numeric variable, 0 = annual (e.g., annual grazing) 23 %
disturb_severity Relative severity of dis- High, low 11 %
turbance
soil_moisture_class General descriptor of Wet = At least sometimes inundated or water table close to sur- 56 %
site moisture face. Dry = well-drained.
site_activity Describes whether the Yes, no. Eddy covariance information was extracted from 60 %
site is currently ac- https://cosima.nceas.ucsb.edu/carbon-flux-sites/ (last access:
tive (i.e., measurements 12 February 2020) by assuming that sites that were active in
conducted each year) 2017 are still continuing to be active. We used our expertise to
define active chamber sites that have measurements at least dur-
ing each growing season.
nee Net ecosystem ex- Convention: −ve is uptake, +ve is loss. 91 %
change (g C−CO2 m−2
for the entire measure-
ment interval)
Earth Syst. Sci. Data, 14, 179–208, 2022 https://doi.org/10.5194/essd-14-179-2022A.-M. Virkkala et al.: The ABCflux database 189
Table 2. Continued.
Variable Variable description Details Proportion
and units of monthly
observations
having data
gpp Gross primary produc- Report as −ve flux 68 %
tivity (g C−CO2 m−2
for the entire measure-
ment interval)
reco Ecosystem respiration Report as +ve flux 73 %
(g C−CO2 m−2 for the
entire measurement in-
terval)
ground_nee Forest floor net ecosys- Convention: −ve is uptake, +ve is loss. Chamber measurements 4%
tem exchange, mea- from (primarily rather treeless) wetlands are included in the
sured with chambers NEE_gC_m2 column.
(g C−CO2 m−2 for the
entire measurement
interval)
ground_gpp Forest floor ecosystem Report as −ve flux. Chamber measurements from (primarily 1%
respiration, mea- rather treeless) wetlands are included in the GPP_gC_m2 col-
sured with chambers umn.
(g C−CO2 m−2 for the
entire measurement
interval)
ground_reco Forest floor gross pri- Report as +ve flux. Chamber measurements from (primarily 2%
mary productivity, mea- rather treeless) wetlands are included in the Reco_gC_m2 col-
sured with chambers umn.
(g C−CO2 m−2 for the
entire measurement in-
terval)
rsoil Soil respiration, mea- Report as +ve flux 4%
sured with chambers
(g C−CO2 m−2 for the
entire measurement in-
terval)
flux_method How flux values were EC = eddy covariance, Ch = chamber, Diff = diffusion meth- 100 %
measured ods. No observations from experimental manipulation plots
flux_method_detail Details related to EC_closed, EC_open, EC_enclosed, EC_open and 93 %
how flux values were closed, EC_enclosed, Chambers_mostly_manual, Cham-
measured: closed- bers_mostly_automatic, Chambers_CUV, Snow_diffusion,
and open-path eddy Chambers_snow, NA
covariance, mostly
manual chamber mea-
surements, mostly
automated chamber
measurements, a com-
bination of chamber
and cuvette mea-
surements, diffusion
measurements through
the snowpack, chamber
measurements on top
of snow
https://doi.org/10.5194/essd-14-179-2022 Earth Syst. Sci. Data, 14, 179–208, 2022190 A.-M. Virkkala et al.: The ABCflux database
Table 2. Continued.
Variable Variable description Details Proportion
and units of monthly
observations
having data
measurement_frequency Frequency of flux mea- > 100 characterizes high-frequency eddy covariance (and au- 100 %
surements tomated chamber) measurements. Manual chamber and dif-
fusion techniques often have values between 1 and 30; 1 =
measurements done during one day of the month, 30 =
measurements done daily throughout the month. This is the
primary variable that characterizes the frequency and gaps in
monthly fluxes estimated with chambers and diffusion tech-
niques.
diurnal_coverage Times of day covered Day, day and night 90 %
by flux measurements
partition_method Method used to parti- Reichstein (night time = Reco partitioning), Lasslop (bulk/day- 16 %
tion NEE into GPP and time partitioning), Reco_measured, ANN, or GPP = Reco-NEE
Reco (for chamber sites)
spatial_reps_chamber Number of spatial repli- Usually, but not always, several chamber plots are measured to 71 %
cates for the chamber assure the representativeness of measurements
plot
gap_fill Gap-filling method e.g., average, linear interpolation, lookup table, MDS (marginal 70 %
distribution sampling), light/temperature response, neural net-
work, a combination of these, or a longer description related to
chamber measurements
gap_perc % of NEE data that was Reported mainly for eddy covariance data 17 %
gap-filled in the mea-
surement interval (rel-
ative to standard mea-
surement time step)
tower_qa_qc_nee_flag Overall monthly qual- 0 = extensive gap-filling, 1 = low gap-filling 44 %
ity flag for eddy co-
variance aggregated ob-
servations; fraction be-
tween 0–1, indicating
percentage of measured
and good-quality gap-
filled data
tower_qa_qc_nee_source The source for the over- 0 = Fluxnet2015, 1 = Euroflux 37 %
all quality information
for the eddy covariance
observations
method_error_nee RMSE or other boot- 23 %
strapped error of
model fit for NEE
(g C−CO2 m−2 for the
entire measurement
interval)
method_error_technique Technique used to e.g., gap-filling and partitioning errors or uncertainty in data– 1%
quantify method errors model fit: bootstrap, MCMC, RMSE fit, etc.
for flux measurements
high_freq_availability Availability of high- 17 %
frequency data
Earth Syst. Sci. Data, 14, 179–208, 2022 https://doi.org/10.5194/essd-14-179-2022A.-M. Virkkala et al.: The ABCflux database 191
Table 2. Continued.
Variable Variable description Details Proportion
and units of monthly
observations
having data
aggregation_method Method used to aggre- 58 %
gate data to measure-
ment interval
instrumentation Description of instru- 68 %
mentation used
tower_Version Version number of the 21 %
eddy covariance dataset
from the extraction
source
tower_data_restriction 12 %
tower_corrections Details related to pro- 32 %
cessing corrections em-
ployed, including time,
duration, and thresh-
olds for u∗ and heat
corrections
spatial_variation_technique Technique used to e.g., standard error of replicate measurements for cham- 10 %
quantify spatial bers, spatial error based on footprint partitioning for
variation for flux towers
measurements
light_response_method_chamber Details related to how 5%
the varying light re-
sponse conditions were
considered in chamber
measurements
par_cutoff PAR level used to de- 17 %
fine nighttime
data and apply parti-
tioning method
(µmol PAR m−2 s−1 )
precip_int Total precipitation dur- 37 %
ing measurement inter-
val (mm)
tair_int Mean air temperature 72 %
during measurement in-
terval (◦ C)
tsoil Mean soil temperature 74 %
during measurement in-
terval (◦ C)
soil_moisture Mean soil moisture dur- 35 %
ing the measurement
interval (% by volume)
thaw_depth Mean thaw depth dur- Report with positive values 6%
ing the measurement
interval (cm)
https://doi.org/10.5194/essd-14-179-2022 Earth Syst. Sci. Data, 14, 179–208, 2022192 A.-M. Virkkala et al.: The ABCflux database
Table 2. Continued.
Variable Variable description Details Proportion
and units of monthly
observations
having data
tsoil_depth Depth of soil temper- 46 %
ature measurement be-
low surface (cm)
moisture_depth Depth of soil mois- 31 %
ture measurement be-
low surface (cm)
alt Active layer thickness Report with positive values 15 %
(cm; maximum thaw
depth), will change an-
nually
water_table_depth Mean water table depth 7%
during the measure-
ment interval (cm);
positive is below the
surface, negative is
above (inundated)
snow_depth Mean snow depth dur- 14 %
ing the measurement
interval (cm)
vapor_pressure_deficit Mean vapor pressure 30 %
deficit during the mea-
surement interval (Pa)
evapotranspiration Total 4%
evapotranspiration dur-
ing the measurement
interval (mm)
par Mean photosyntheti- 5%
cally active radiation
during measurement
interval (W m−2 )
par_ppfd Mean photosyntheti- 11 %
cally active radiation
during measurement
interval (measured in
photosynthetic photon
flux density, PPFD;
µmol m−2 s−1 )
precip_ann Mean annual precip- 80 %
itation (mm), from
site or nearby weather
station as a general
site descriptor. This
should describe the
longer-term climate for
the site rather than a
few years of study.
Earth Syst. Sci. Data, 14, 179–208, 2022 https://doi.org/10.5194/essd-14-179-2022A.-M. Virkkala et al.: The ABCflux database 193
Table 2. Continued.
Variable Variable description Details Proportion
and units of monthly
observations
having data
tair_ann Mean annual air tem- 79 %
perature (◦ C), from
site or nearby weather
station as a general
site descriptor. This
should describe the
longer-term climate for
the site rather than a
few years of study.
t_precip_source_yrs Data source and years 50 %
used to calculate
mean annual tempera-
ture/precipitation
elevation Elevation above sea 65 %
level (m)
lai Leaf area index 22 %
sol_depth Soil organic layer depth 23 %
(cm)
soil_perc_carbon Soil carbon percentage 7%
(%)
perc_C_depth Depth at which soil car- 7%
bon % was measured
(cm)
c_density Soil carbon per unit 16 %
area (kg C m−2 )
c_density_depth Depth to which soil 8%
organic carbon per unit
area was estimated
(cm)
agb Above ground biomass 11 %
(kg C m−2 )
agb_type Types of above ground Trees, shrubs, graminoids, mosses, lichens 13 %
vegetation included in
the AGB measurement
soil_type General soil type, 42 %
including source
(e.g., USDA, CSSC,
NCSCD)
soil_type_detail Detailed soil type de- 9%
scription, if available
other_data Other types of data 7%
from the data source
that may be relevant
notes_site_info Any other relevant 20 %
information related to
static site descriptions
https://doi.org/10.5194/essd-14-179-2022 Earth Syst. Sci. Data, 14, 179–208, 2022194 A.-M. Virkkala et al.: The ABCflux database
Table 2. Continued.
Variable Variable description Details Proportion
and units of monthly
observations
having data
notes_time_variant Any other relevant 59 %
information related to
time-varying data
citation Journal article, data 70 %
citation, and/or other
source (online repos-
itory, PI submitted,
etc.)
citation_data_overlap Another citation for the 13 %
site
data_contributor_or_author Data contributor(s) or If you use unpublished data or data from flux reposito- 100 %
primary author(s) asso- ries (see Extraction_source), please contact this person
ciated with dataset or
publication
email Primary author email 93 %
orcid Personal 29 %
digital identifier: https:
//orcid.org/ (last access:
24 November 2020)
data_availability Current availability of Published_Paper, Published_Online, 100 %
data: data available in a Published_Synthesis, User_Contributed
published paper, in an
open online data repos-
itory, in an already pub-
lished synthesis, or user
contributed
data_maturity Current maturity of Preliminary, Processed, Published, Reprocessed. Cur- 100 %
data rently, none of the observations belong to the Prelim-
inary or Reprocessed classes, but they were kept for fu-
ture versions of the database.
extraction_source Data source Paper, Virkkala or Natali syntheses, Euroflux, Fluxnet 100 %
2015, PI, Ameriflux, SMEAR, ORNL DAAC, Pangaea
dataentry_person The person(s) who Primarily researchers working at Woodwell 100 %
added the data to the
database
the tundra and the sparsely treed boreal wetlands, but a few season can be of similar magnitude to the ecosystem-level
studies with ground surface CO2 fluxes from forests (i.e., fluxes when trees remain dormant (Ryan et al., 1997; Hermle
capturing the ground cover vegetation and not the whole et al., 2010). Therefore, these ground or soil fluxes could po-
ecosystem) are also included in their own fields so that they tentially be used to represent ecosystem-level fluxes during
can not be mixed up with ecosystem-scale measurements some of the non-growing season months. However, we did
(“ground_nee”, ”ground_gpp”, “ground_reco”). Further, a not make an extensive literature search for these observa-
few soil CO2 flux sites measuring fluxes primarily on unveg- tions, rather we compiled observations if they came up in our
etated surfaces during the non-growing season are included NEE search. Therefore, the data in these ground surface and
in the database (“rsoil”). These were included in the database soil flux columns represent only a portion of such available
because ground surface or soil fluxes during the non-growing data across the ABZ.
Earth Syst. Sci. Data, 14, 179–208, 2022 https://doi.org/10.5194/essd-14-179-2022A.-M. Virkkala et al.: The ABCflux database 195
Table 3. General statistics of the database. Number of monthly CO2 flux measurements and sites derived from eddy covariance, chamber,
and diffusion techniques, and the proportion of data coming from different data sources. Note that some of the data extracted from flux
repositories and papers were further edited by the PIs; this information can be found in the database. For this table, observations that were
fully contributed by the PI were considered as PI-contributed.
Flux measurement tech- Number of sites Number of monthly ob- Number of monthly ob- Number of monthly
nique servations servations derived us- observations extracted
ing different eddy co- from different data
variance and chamber sources
techniques
Eddy covariance Total: 119 Total: 4957 Open-path: 1988 Flux repository: 2775
Tundra: 47 Tundra: 1406 Closed path: 2085 Published: 810
Boreal: 72 Boreal: 3551 Both: 245 PI-contributed: 1350
Enclosed: 240
No information avail-
able: 399
Chamber Total: 104 Total: 1166 Manual: 435 Flux repository: 243
Tundra: 73 Tundra: 708 Automated: 696 Published: 901
Boreal: 31 Boreal: 458 No information avail- PI-contributed: 22
able: 35
Diffusion Total: 21 Total: 186 Flux repository: 0
Tundra: 16 Tundra: 103 Published: 186
Boreal: 5 Boreal: 83 PI-contributed: 0
The geographical coverage of the flux data is highly vari-
able across the ABZ, with most of the sites and monthly ob-
servations coming from Alaska (37 % of the sites and 28 % of
the monthly observations), Canada (19 % and 29 %), Finland
(7 % and 15 %), and Russia (14 % and 13 %) (Fig. 3). The
sites cover a broad range of vegetation types but were most
frequently measured in evergreen needleleaf forests (23 % of
the sites and 37 % of the monthly observations) and wetlands
in the tundra or boreal zone (30 % and 27 %) (Fig. 4). The
northernmost and southernmost ecosystems had fewer sites
and observations than more central ecosystems (barren tun-
dra: 45 % of the sites and 3 % of the monthly observations,
prostrate shrub: 2 % and < 1 %, deciduous broadleaf for-
est: 1 % and 3 %, deciduous needleleaf forest: 5 % and 4 %,
mixed forest < 1 % and < 1 %). The sites in ABCflux cover
the most frequent climatic conditions across the Arctic–
boreal zone relatively well; however, conditions with high
precipitation and low temperatures are lacking sites (Fig. 5).
ABCflux includes sites experiencing various types of dis-
turbances, with the majority of disturbed sites encountering
Figure 3. The proportion of monthly observations in each coun-
fires (24 sites and 901 monthly observations), thermokarst (4
try/region compared to the proportion of the areal extent of the
sites and 113 monthly observations), or harvesting (6 sites country/region across the entire Arctic–boreal zone. Ideally, points
and 258 monthly observations). However, ABCflux is domi- would be close to the 1 : 1 line (i.e., large countries/regions have
nated by sites in relatively undisturbed environments or sites more observations than small countries/regions). Permanent water
lacking disturbance information (only 20 % of the sites and bodies, glaciers, croplands, and urban areas were masked from the
30 % of the monthly observations include disturbance infor- areal extent calculation.
mation).
ABCflux spans a total of 31 years (1989–2020), but
the largest number of monthly observations originate from 2000–2015 (80 % of the data) (Fig. 6). The reason for a
decrease in flux data over 2015–2020 is likely related to
https://doi.org/10.5194/essd-14-179-2022 Earth Syst. Sci. Data, 14, 179–208, 2022You can also read