Playing-Side Analytics in Team Sports: Multiple Directions, Opportunities, and Challenges - Frontiers
←
→
Page content transcription
If your browser does not render page correctly, please read the page content below
ORIGINAL RESEARCH
                                                                                                                                                   published: 05 July 2021
                                                                                                                                          doi: 10.3389/fspor.2021.671601

                                             Playing-Side Analytics in Team
                                             Sports: Multiple Directions,
                                             Opportunities, and Challenges
                                             George Foster 1 , Norm O’Reilly 2*† and Zachary Naidu 3
                                             1
                                              Graduate School of Business, Stanford University, Stanford, CA, United States, 2 International Institute for Sport Business &
                                             Leadership, Lang School of Business & Economics, University of Guelph, Guelph, ON, Canada, 3 Student, Stanford
                                             University, Stanford, CA, United States

                                             This paper describes developments in the player-side analytics in major team sports.
                                             We take a decision-making lens to the role of analytics in player decisions by general
                                             managers and coaches. We outline key accelerators and inhibitors to the wider adoption
                                             and acceptance of data analytics playing a greater role in the decisions of clubs.
                                             Keywords: analytics, sabermetrics, player, professional sport, MLB, NBA, NFL, NHL

                            Edited by:       INTRODUCTION
                     Hans Westerbeek,
           Victoria University, Australia    The rise of data analytics is impacting many areas of business and society. Education institutions
                         Reviewed by:        are increasingly recognizing this shift and are seeking to help meet the continued growth in
                        Andy Gillentine,     demand for talent in this area1 . In the sports landscape, both the playing-side (“on-the-field”)
          University of South Carolina,      and the business side (“off-the-field”), reflect an increasing adoption of data analytics. This paper
                          United States
                                             focuses on data analytic investments in the playing side of sporting clubs and the broadening areas
                           Adam Karg,
              Swinburne University of
                                             of its applications. The debate in this area has shifted from whether analytics can be fruitfully
                 Technology, Australia       implemented to the speed and depth of the appropriate investments to make. Although not
                 *Correspondence:
                                             explored in this paper, we note that a similar transformation is occurring in many areas on the
                        Norm O’Reilly        business side such as fan engagement, ticket pricing, and sponsorship evaluation.
            norman.oreilly@maine.edu            Sports for many decades has always had a strong quantitative aspect. Games are won or lost
                                             on the basis of numerical scores such as goals scored and runs scored. Rankings of individual
                   † Present address:        players likewise has long been based on quantitative metrics such as goals scored, assists, passes
                        Norm O’Reilly,
                                             caught and strikeouts made. Data analytics takes such quantitative information, and increasingly
 Dean, Graduate School of Business,
University of Maine, ME, United States
                                             also qualitative information, as inputs to then rigorously promote decisions being made on a more
                                             informed basis with a higher likelihood of desired outcomes. Increasingly data analytics is also
                    Specialty section:       being used to probe hypotheses about which actions are likely to lead to more desired actions
          This article was submitted to      as well as to examine the validity of existing “conventional wisdoms” or traditional approaches
  Sports Management and Marketing,           to making playing side decisions. As noted in several parts of this paper, a higher probability of
                a section of the journal     desired outcomes does not rise to certainty. A good decision based on a higher probability of desired
  Frontiers in Sports and Active Living      outcomes can still have an outcome that is a less preferred one.
         Received: 24 February 2021             Section Moneyball Highlights the Potential Value of Data Analytics of this paper briefly
            Accepted: 26 May 2021            highlights the origins of Sabermetrics and the derivative role of Michael Lewis’s 2003 Moneyball:
            Published: 05 July 2021

                              Citation:      1 See,e.g., the many universities ranked in U.S. News.com “Best Undergraduate Data Science Programs” for 2021.
     Foster G, O’Reilly N and Naidu Z
                                             Available online at: https://www.usnews.com/best-colleges/rankings/computer-science/data-analytics-science. The top
 (2021) Playing-Side Analytics in Team       ranked programs were: 1. University of California-Berkeley, 2. MIT, 3. Carnegie Mellon, and 4. Stanford. Graduate programs
           Sports: Multiple Directions,      at universities likewise reflect the importance that major schools now give to this area. The top ranked programs in U.S. News’
       Opportunities, and Challenges.        “Best Business MBA Analytics Programs” for 2021. Available online at: https://www.usnews.com/best-graduate-schools/
   Front. Sports Act. Living 3:671601.       top-business-schools/business-analytics-rankings - were 1. MIT, 2. Carnegie Mellon, 3. Wharton, and 4. Georgia Institute
     doi: 10.3389/fspor.2021.671601          of Technology.

Frontiers in Sports and Active Living | www.frontiersin.org                          1                                               July 2021 | Volume 3 | Article 671601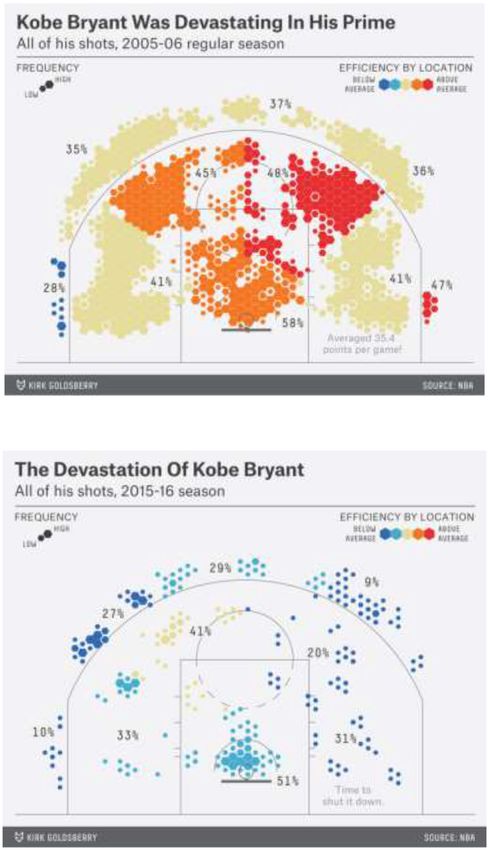
Foster et al.                                                                                                                                        Playing-Side Analytics

The Art of Winning an Unfair Game2 in building greater                                    Earnshaw Cook (author of Percentage Baseball, MIT Press,
recognition of the potential value of using rigorous data analytics                   1964) and Bill James (whose Baseball Abstracts series started in
in player-side decision making in team sports. It also highlights                     1977) are two recognized early pioneers of sport analytics. The
why the batting side of baseball was an early attractive platform                     term Sabermetrics, reportedly coined by James, comes from work
to showcase the potential value-add of data analytics to these                        at the Society for American Baseball Research, which was founded
decisions. Sections Player Squad Assembly Strategies and Data                         in 1971 to promote analysis of baseball through statistical means.
Analytics to Health and Fitness and Data Analytics discuss                            These early advocates emphasized evaluating players on their
areas where analytic advances and adoptions are increasingly                          ability to contribute to winning as opposed to a traditional
part of playing-side decision making: (i) player squad assembly                       metric such as batting average. For many years, this early work
strategies, (ii) pre-game and within-game strategy, and (iii)                         on Sabermetrics appeared to have limited impact within many
health and fitness. Section Growth Accelerators and Growth                            professional baseball clubs. The Oakland Athletics were an early
Inhibitors of Broader and Deeper Analytics Adoption in Player-                        explorer of data analytics when a 1995 change in ownership
Side Decision Making examines growth accelerators and growth                          led then General Manager Sandy Alderson to explore some
inhibitors of analytics implementation in sports. Section MLB                         sabermetric based approaches aiming to build a competitive
Case Study Highlighting the Sustained Success of the Oakland                          playing squad with a relatively low payroll. Billy Beane, a playing
Athletics presents a quadrant analysis of MLB clubs based                             side executive at the Oakland Athletics, was later to embrace this
on club total player payroll and club regular season wins                             sabermetric approach.
over the 1998–2019. This analysis highlights the success of                               Beane was the subject of Michael Lewis’s 2003 Moneyball: The
clubs with relatively low payrolls and relatively high wins,                          Art of Winning an Unfair Game which quickly became a best
notably the Oakland Athletics and later also the Tampa Bay                            seller. Beane joined the Athletics in 1990 as a Scout and later
Rays. This on-the-field success has been an important growth                          became Assistant General Manager under Sandy Alderson. He
accelerator/stimuli to placing player-side analytics higher on the                    became General Manager in late 1997. Moneyball highlighted
agenda of many professional clubs (and colleges) and their teams.                     how Beane used metrics such as on-base percentage3 and
Section Evidence on Diverse Composition of Personnel in Data                          slugging percentage4 , as opposed to traditional metrics (such as
Analytics Groups of MLB Clubs examines the structure and                              batting average and stolen bases), to identify players that were
composition of MLB club analytics groups and Section Summary                          undervalued relative to the contribution they could make to
provides a brief summary.                                                             the Athletics winning games. Over time, Beane continued to
   Many of the specific advances in playing side analytics are                        innovate, albeit not having so much of his analysis appearing
rarely are placed in the public domain by individual clubs. While                     in the public domain5 . By 2011, when the Moneyball film
some generic advances are in the public domain, many innovative                       was released, the strategy of seeking to identify undervalued
applications are occurring behind the curtains of clubs with the                      assets in sports was gaining more widespread recognition. A key
aim of maintaining any competitive advantage for those making                         underpinning to this strategy is that player evaluation needs to
those advances.                                                                       assess (i) player on-field ability to contribute to winning, (ii)
                                                                                      player ability to reliably be available to play the full contingent
                                                                                      of games in the regular season and all playoff games, and (iii) the
MONEYBALL HIGHLIGHTS THE                                                              salary cost of attracting and retaining that player to the club.
POTENTIAL VALUE OF DATA ANALYTICS                                                     Baseball as an Attractive Early Use Case of
The conventional wisdom in sports economics is a positive                             Data Analytics for the Playing Side
(but far from perfect) correlation between player payroll                             In the two decades since the publication of the Moneyball in
and on-the-field winning. For example, annual editions of                             2003, there has been widespread adoption of analytics across
Deloitte Annual Review of Football Finance showcase a strongly                        many areas of the playing side-functions of sporting clubs as well
positive correlation occurring in the English Premier League                          as across many sports. The following four factors help explain
(EPL) between club investment in players and on-the-field                             differences across sports with respect to the adoption of analytics
performance. What attracted much early attention to analytics                         3 On-Base Percentage is the percent of times that a batter gets to base relative to the
was evidence that disciplined application of analytics for player
                                                                                      number of times at the plate. It includes hits by the batter, walks, and the batter
evaluation and team squad building could increase the likelihood                      being hit by a pitch that results in going to first base.
that a low payroll club could achieve a sustained above expected                      4 Slugging Percentage is a weighted hitting metric that weights hits based on where

number of wins on the playing field. Such an outcome would                            the hitter ends up after the hit relative to the number of times at the plate. The
be counter to conventional sports economics predictions. An                           weights are one first base, two for second base, three for third base, and four for a
                                                                                      home run.
important heritage to this application of analytics came from                         5 Beane in several Stanford Graduate School of Business classes has noted that he
early developers and advocates of Sabermetrics in baseball.                           was under the impression that Michael Lewis was writing a short article when he
                                                                                      granted Michael Lewis “inside observation access” and wondered why it was taking
                                                                                      Lewis so long to collect information for a short article. He subsequently concluded
2 Moneyball
          was published in 2003 by W.W. Norton & Company, New York, NY                that the very astute Lewis had quickly surmised that there was a book in what
and London. The data analytics focus of the book was further highlighted by the       he was observing rather just a short article. Prior to Moneyball (2003), Lewis had
2011 Moneyball film starring Brad Pitt and distributed by Sony Pictures.              authored the best-selling Liar’s Poker (1989).

Frontiers in Sports and Active Living | www.frontiersin.org                       2                                                  July 2021 | Volume 3 | Article 671601
Foster et al.                                                                                                                   Playing-Side Analytics

for talent evaluation and why baseball was an attractive early             can examine. While many more data points exist for within-game
candidate to illustrate the value-add of data analytics.                   events in each of the above, the more defining points as regards
    First, whether a sport has on-the-ball action as central vs. a         the object of winning are the actual scoring events and the related
sport where off-the-ball action can be as equally important as on-         leadups to those events.
the-ball action is a key difference. Consider evaluating a hitter              The sports which facilitated early opportunities for data
in baseball or a batter in cricket, both key positions in playing          analytics as regards evaluating on-field contributions to winning
side offense in these sports. In each case, the hitter (batter) is         are sports that have (i) on-the-ball action as central, (ii) are of a
the sole person facing the ball and actions by others on the               stop-start nature, (iii) have more than a few scoring points per
team cannot assist the hitter (batter) ability to hit the ball. In         game, and (iv) have a large number of regular season games.
contrast, consider a forward on a soccer or hockey (field or ice)          Baseball is highly attractive as regards (i), (ii), and (iv). Thus, it
team. Here, other players on the team can draw defenders into              is no surprise that the focus of Moneyball and other much other
positions that enable that forward to have a higher likelihood             early discussion on analytics in sport was on offensive hitting
of scoring. Similarly other players on the team can “assist” the           analytics in baseball.
forward to score by the timing and placement of their passes to                Studies using data from MLB Media Guides highlight the
that forward. Sports where both off-the-ball action and on-the-            growth of the data analytics function in MLB clubs. Lindberg
ball action are important require a sizably more complex tracking          and Arthur (2016) “took three snapshots of MLB ‘quant’ staffs”
of interactions during the game to enable analysis. In these cases,        by studying the 2009, 2012, and 2016 Media Guides of clubs
the performance of the player is a joint product with other players        and “cached online directories.” They defined a “quant” as “a
on the field.                                                              baseball operations employee who spends a majority of his or
    A second key difference lies in sports that have a stop-start          her work hours either directing a quantitative department or
rhythm vs. sports with a continual flow rhythm. Data collection            doing statistical research, data processing or programming to
is more well-defined in a stop-start sport than in a continual flow        support the team’s analytical efforts.” They reported growth in
sport. There is a spectrum of sports on this dimension. At one             positions as follows: “In 2009 a total of 44 employees fit our
extreme is baseball, cricket, and American football (gridiron).            ‘quant’ definition, and at least a third of teams had yet to assign a
Here, there are defined stops that occur before another on-the-            single full-time employee primarily to statistical work.” By 2012,
field interaction occurs at which a scoring (or another outcome)           the number had climbed to 75, and only four teams had no
could occur. In baseball (or cricket) after each pitch is thrown (or       “quants.” Just 4 years later (in 2016), the analyst count has more
ball is bowled), there is a stop before the next pitch is thrown (or       than doubled again, to 156, and as of 2016, no team operates
ball is bowled). In gridiron, after each play the game is stopped          without some semblance of an R&D department” (Lindberg and
until the offense team makes the next play. The other extreme is           Arthur, 2016).
soccer and hockey where the ball (or puck) can progress forward                In the next three sections we discuss areas where analytic
or backwards in a continuous way without any stoppage in play.             advances and adoptions are increasingly being part of playing-
Here, tracking actions by any one player is a more complex                 side decision making across multiple team sports.
challenge than with stop-start sports where there are well-defined
natural data collection points at each stop point. While advances
in tracking movements in a game is reducing this factor, it is             PLAYER SQUAD ASSEMBLY STRATEGIES
one explanation for the slower adoption of rigorous analytics in           AND DATA ANALYTICS
continual flow sports.
    The third factor is sports with many games per season vs.              Decisions related to assembling a team playing squad aim to
sports with few games per season. The more games per season,               build a squad that will best achieve the objectives of the team
the more data points to analyze. MLB has 162 regular season                owner/stewards. These objectives typically have a win aspect (i.e.,
games, NBA and NHL has 82 regular season games, English                    “on-the-field” performance) given the constraints of a total player
League Premier has 38 regular season games, and the NFL has                payroll budget. Decisions in this area focus on the expected
16 regular season games. The larger the number of data points              future performance of players. General managers making these
the more reliable the findings of the analytic analysis and the less       decisions are increasingly accessing data analytics, although with
the impact of random or idiosyncratic events.                              sizable variation across clubs in the importance given to analytics
    Fourth, sports with many scoring events per game vs. sports            information. An key input here is information on the past and
where there are few scoring events per game is an important                current performance of players being evaluated to be on the
distinction in data analytics. Soccer and ice hockey can result in         squad for the period under analysis.
games with just a few goals per game and in the extreme zero                   Depending on the league and the sport, there are multiple
goals. Baseball games often average between 4 and 5 runs per               categories of players being evaluated: (i) youth, (ii) draft-
game per team. Professional and college basketball games often             selections, (iii) existing players under contract, and (iv) free
have more than 50 scoring moments (successful two or three                 agents. As you progress from (i) or (ii) to (iii) and (iv), there is
point shots). Given that scoring is the metric on which wins and           a richer and more reliable data base to evaluate past and current
losses are based, the higher the number of scores in a game the            player ability. Moreover, there is higher uncertainty in (i) and (ii)
higher the number of key data points that an analytics approach            when predicting how a player will perform in the future at the

Frontiers in Sports and Active Living | www.frontiersin.org            3                                         July 2021 | Volume 3 | Article 671601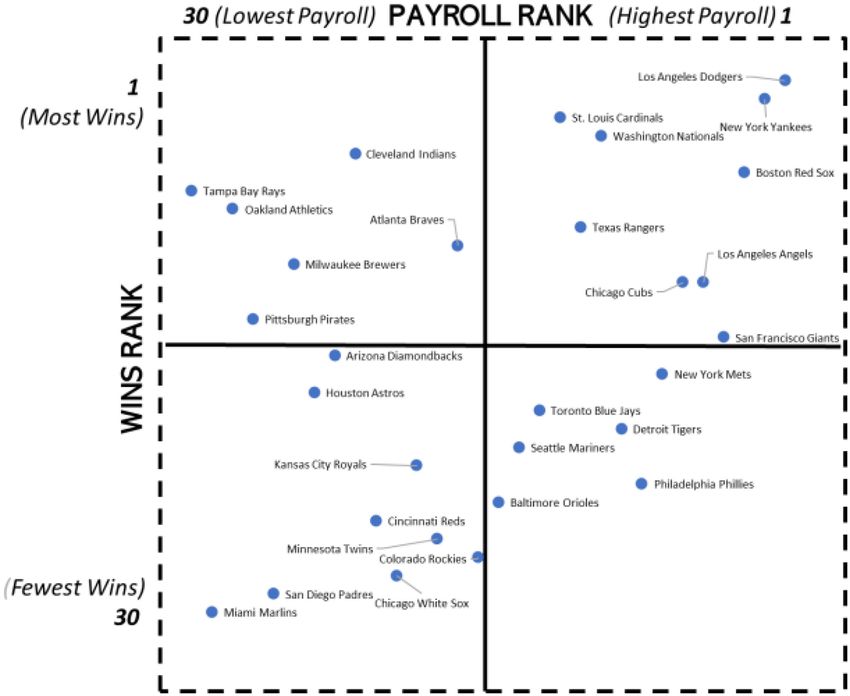
Foster et al. Playing-Side Analytics
highest level of the professional club game. As with all analytics further enabled Hudl to be an even larger force in the player side
based on past data, there remains uncertainly about whatever past data analytics landscape.
and current ability is identified for a given player in each of (i)
to (iv) will progress or sustain going forward and for how long.
Notably, many players’ on-the-field performance declines later in
their careers. Building a Squad That Captures Where the
Soccer clubs in many leagues have youth academies. An League Is Evolving
extensive 2008 study of multiple soccer youth academies by the One frequent metaphor used in business is the famous expression
European Club Association reported that “the goal for most oft-quoted to NHL hockey great Wayne Gretzky (Kirby, 2014):
clubs regarding their youth academy is to develop players for “Skate to where the puck is going, not where it has been.” This
professional soccer, in particular for their own first team.”6 metaphor as regards squad building captures the notion that
Early data analysis often focused on existing elite players when assembling a playing squad, it is important to understand
and looking backwards at their profiles including evidence of shifts in the structure of the game. NBA basketball has been
their proficiencies at various ages plus profile data about their at the forefront in this area, fueled in part by all NBA arenas
parents. One early limitation here was that there was often having many cameras above the court, a rich data base of multiple
minimal systematic data on youth predicted to become elite scoring attempts and points from many games, few players on
players but who were later exited out of the academies. Over the court to track, and innovative analysts. For many years, there
time, the academies could develop a richer data base about was a high focus on building basketball squads around dominant
youth in their academies and more effectively examine how centers who made many two point shots close to rim (so-called
contemporary information could predict subsequent success or “in the paint” shots). It is only since the 1979–80 season that
lack thereof. Manchester United’s Youth Academy is often cited a three-point shot has been scored in the NBA long after it
as a success, given that multiple players on their first team were had been introduced in the smaller American Basketball League
graduates7 Oft-cited examples include Bobby Charlton, Ryan in 1961. The NBA was reported to “consider it gimmicky for
Giggs, David Beckham, Paul Pogba and Marcus Rashford. For years. The NCAA was even slower to adopt the rule” (Wood,
entry into a youth academy, the forecasting horizon is many 2011). More recently, three point shooters are being given higher
years ahead and the objective (i.e., early identification and then priority in squad assembly (Garcia, 2020). The standout three-
development of first team members) being predicted is a very low point records of Steve Nash with the Phoenix Suns in the 2000’s
probability outcome. and Stephen Curry and Klay Thompson with the Golden State
College recruitment of North American high school students, Warriors in the 2010’s are considered important stimuli to greater
especially for basketball and football, is an area where colleges are value being given to successful three point shooters in playing
increasingly investing in data analytics to identify and prioritize squad assembling decisions.
recruits to target. Hudl exemplifies the growth in analytics service Kirk Goldsberry, a leading thought leader in basketball
companies that many teams have subscribed to8 . It was founded analytics, has showcased the changing dynamics in basketball in
in 2005 and provides information based products for multiple his recent book Sprawball (Goldsberry, 2019). He documents
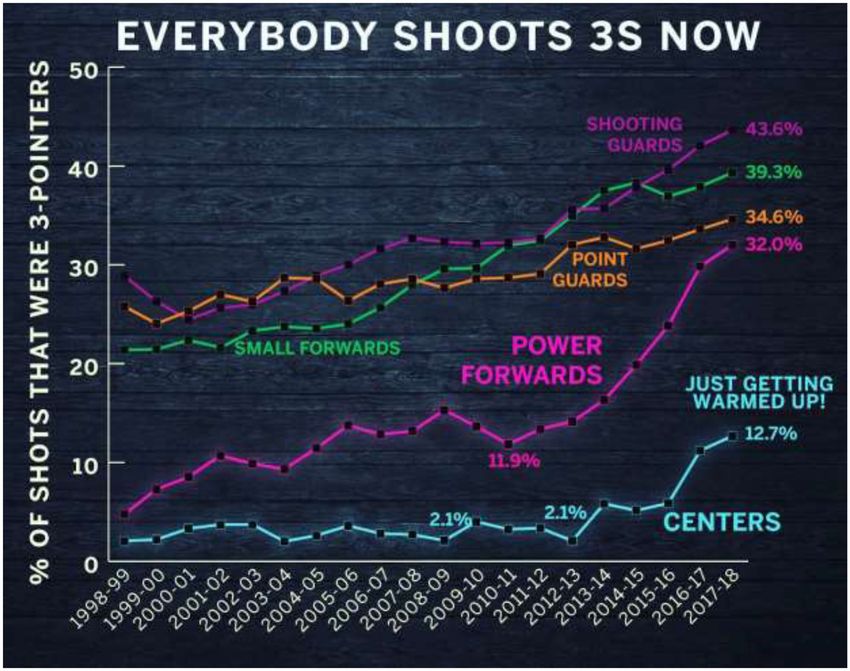
player side decision areas by professional clubs and colleges the progressive increase in the percentage of NBA shots that
for many sports including football, basketball, and soccer. Hudl were three-point shots since the 1998–99 season, reaching 35%
invests in developing data bases and in providing a ranking of in 2017–18. Figure 1 (below) depicts Goldsberry’s presentation
prospects that colleges can use to complement scouting done of the shift by different basketball positions in their relative
by coaches observing live as well as recordings of games by frequency for taking three point shots.
high school players9 . Data bases for youth often need to be Underlying what is presented in Figure 1 is an analysis of
interpretated very cautiously as there can be higher variation in every shot taken by every NBA player each year with tags as to
the abilities of athletes on opposing teams than exists as players their court position and whether they were within the 2-point Arc
advance to being professionals and their on-the-field competition vs. in the three-point zone (i.e., beyond the three-point line). The
has more comparable levels of ability. changing compensation of the top 10 highest paid NBA players
Companies such as Hudl are important growth accelerators from 2011–2012 to 2020–2021 further reflects and supports the
for sporting clubs expanding their use of data analytics. By having shift to players that have a track record of high three-point
multiple clients, it can make a larger investment in many areas success and the move to less representation by Power Forwards
of data analytics that are beyond the budgets of most sporting and Centers (i.e., players normally focused on two-point scoring).
clubs. Acquisitions of competitors (such as Krossover in 2019) has Based on an analysis using Spotrac public data, the percentage
of top ten compensated NBA players across the five positions is
found as Table 1.
Pre-game and within-game analysis now often uses extensive
6 Available online at: https://www.ecaeurope.com/media/2730/eca-report-on- analytics-based reports on the relative ability of individual
youth-academies.pdf. opposing team players to successfully take three-point shots,
7 Available online at: https://www.manutd.com/en/news/detail/man-utd-
celebrate-unrivalled-academy-milestone-with-4000th-game.
and how that differentially varies across those players by the
8 See www.hudl.com. It is a product line of Agile Sports Technologies, Inc. location outside the three–point line where each player takes their
9 Another company example in this space is Qwikcut.com. three-point shot attempts.
Frontiers in Sports and Active Living | www.frontiersin.org 4 July 2021 | Volume 3 | Article 671601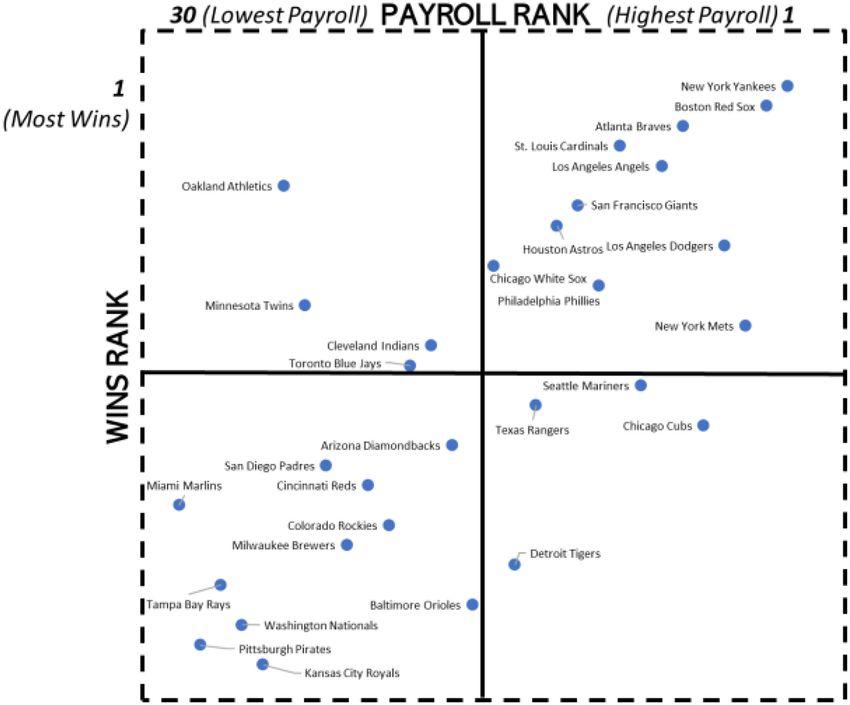
Foster et al.                                                                                                                                      Playing-Side Analytics

  FIGURE 1 | Analytics analysis of shifting structure of NBA games—an increasing shift to 3-point shots. Source: Reprinted with permission of Goldsberry (2019).

Predicting the Future Performance of                                                   TABLE 1 | The percentage of top 10 compensated nba players across the
                                                                                       five positionsm.
Athletes: Pattern Recognition Based on
Data Analytics                                                                                                      Point    Shooting      Small      Power        Center
Predicting the future performance of an athlete can have varying                                                    guard      guard      forward     forward
levels of uncertainty. Decision makers gain insight by building
                                                                                       2011–2012 to 2015–2016        16%        14%         24%         30%         16%
evidence based pattern recognition skills. Data analytics are an
                                                                                       2016–2017 to 2020–2021        38%        18%         28%         10%         6%
important pillar to building more reliable pattern recognition
skills and can be an important counter to excessive reliance                           Data Source: Spotrac (accessed June 09, 2021).
on anecdotes or the personal biases of playing-side decision
makers. A key role is to increase the likelihood that players
with superb ability to contribute to winning are incentivized and                      higher the percentage of games a player is available to perform
appropriately rewarded (within which extant league rules allow)                        at peak performance levels, the more valuable that player is to a
and those with much less ability are not overpaid and are not                          squad. The reasons why a player may not consistently be available
given long term contracts that over time can become increasingly                       to perform at this highest level include: (i) expected impact of
burdensome to the club.                                                                aging, (ii) physical injuries, (iii) failure to maintain high levels of
   An oft used expression when evaluating players for a squad                          health and fitness, (iv) attitude and mental state of mind issues,
is “the most important ability is availability.” Underlying this                       (v) sidelined due to legal or league penalties, and (vi) sitting out
comment is the notion that, with all other things being equal, the                     due to contractual disputes.

Frontiers in Sports and Active Living | www.frontiersin.org                        5                                                July 2021 | Volume 3 | Article 671601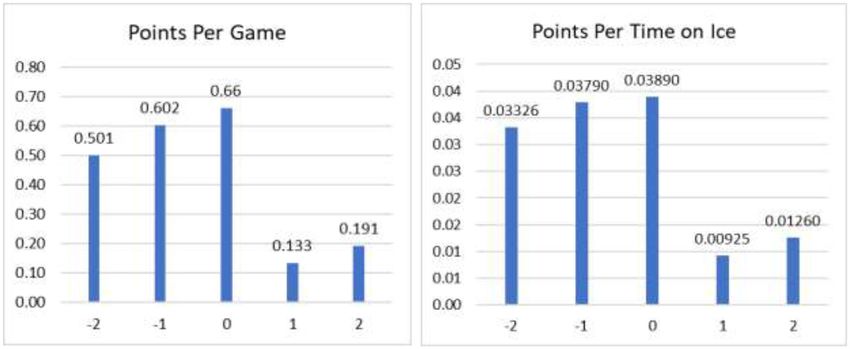
Foster et al.                                                                                                                   Playing-Side Analytics

Aging Curve Data Analytics Evidence                                         Angels to sign the 31 years old Albert Pujols to a 10 year contract
General managers typically will be negotiating multi-year                   guaranteed for $240 million. In his prior 11 seasons with the
contracts with players, especially with elite players whose                 St Louis Cardinals (age 20–31 years), Pujols averaged 40 home
contracts have sizable financial amounts at stake. An important             runs, 120 runs batted in, and played in 155 out of the maximum
role of analytics is gaining insight into the expected future playing       162 games per season. From 2012 to 2019 with the Angels, he
performance of a player based on a systematic analysis of many              averaged 26 home runs, 99 runs batted in and played in only 140
athletes and the riskiness of signing a given player to a long-             games per season. In May 2021, the Angels waived Pujols before
term contract. The shooting efficiency charts in Figure 2 below             his contract ended. He had batted 0.198 in the first 24 games of
highlight from Goldsberry’s (2019) analysis of the contrasting              the 2021 season.
skill levels of Kobe Bryant in 2005–2006 (at age 27) and in 2015–               One red flag for signing a long term contract with a pitcher
2016 (at age 37). The specific percentage points are reported               older than 28 or a batter over 30 is the data analytics evidence
in Table 2.                                                                 (Ng, 2017) of how the performance of athletes typically declines
   Bryant’s shooting efficiency declines in every shooting location         as such athletes age. The second red flag is the systematic evidence
on the court (left to right on the shooting efficiency chart,               of increased non-availability to play (even at a less than peak
Table 2). Note that M means minimal shots taken. The locations              level) as players age beyond the average peak years for their
are #1 in the Paint, #2 to #5 Within the Arc: 2-Point Shots (#2             position (Ng, 2017). For example, another study (Lindholm,
Short Corner, #3 Wing, #4 Elbow, and #5 Low Post or Block) and              2014) reported a progressive decline in the number of MLB
#6 to #10 Beyond the Arc: 3-Point Shots (#6 Corner, #7 Wing, #8             pitchers who can start 20+ games a season as they age beyond
Point, #9 Wing, and #10 Corner). The Arc refers to the 3 point              28 years old. These so-called “aging curves” for pitchers (batters)
line. M means minimum data (shots) available.                               are based on samples of many pitchers (batters) over many
   Basketball-Reference.com reports that in the three sessions              seasons. Whilst they may not be predictive of a specific pitcher
from 2003–2004 to 2005–2006 Bryant averaged 29 points per                   (or batter), the sizable analytic evidence places the onus on the
game and played an average of 70 out of the 82 regular season               person deciding to sign the aging (beyond the average peak
games. However, in the three seasons a decade later, from 2013–             performance year) athlete to either (i) have credible evidence
2014 to 2015–2016, he averaged 18 points per game and played an             that the general aging curves are less applicable to the aging
average of 36 regular season games. Bryant’s lower productivity             athlete being considered, or (ii) reduce the downside by writing
per game and lower availability per season as he aged illustrate            a contract that is less exposed if the general pattern does
the gravity effects of aging that is well-documented across most            subsequently apply to the athlete (such as a shorter contract or
athletes. Athletes who defy this gravity effect of aging well-beyond        a contract with a lower guaranteed amount with bonuses for
expected norms (such as Tom Brady in gridiron and Lebron                    performance above expected).
James in basketball), while rightfully celebrated, are outliers and
exceptions to what age-based analytics documents.
   Consider the San Francisco Giants decision in December 2006              Contract Year Analytics Evidence
to sign the then 29 year old pitcher Barry Zito to a 7 years, $126          Many professional athletes will have multiple contracts during
million guaranteed contract. After Barry Bonds stopped playing              their playing careers. Near the end of an existing contract,
with the Giants at season end 2007, Zito became the highest paid            General Managers (or Heads of Player Development) face the
Giants player from 2008 to 2010. In his seven years at the Oakland          challenge of predicting the future performance of the athlete
Athletics prior to signing with the Giants, Zito (aged 22–28 years          in a possible next contract. There is evidence from rigorous
at the time) won 102 and lost 63 regular season games, for an               data informed studies across multiple sports that an athlete’s
impressive win percentage of 61.8%. Analytics can provide input             performance in the final year of the first contract exceeds that
into the risks of a Zito type contract. For example, one published          which will occur in the first year of the second contract. The same
study (Ng, 2017) modeled MLB player performance as a function               phenomenon has also been documented for some sports between
of age, experience and talent. The data analyzed included 5,754             the final year of the second contract and the first year of the third
seasons for 562 batters and 4,767 seasons for 489 pitchers and.             contract (albeit the sample size for athletes with a third contract
Ng’s (2017) findings were: “Peak physical age for hitters and               is sizably lower). This has come to be known as the “contract year
pitchers are 26.6 years and 24.5 years, respectively, when holding          phenomenon” (White and Sheldon, 2013).
experience constant. With increased experience, batters peak                    An illustrative study by Hurley (2019) examined the scoring
near age 29, while pitchers peak near age 28.” Unfortunately for            ability (defined by goals and assists) of forwards who made
the San Francisco Giants, Zito’s performance followed (if not               their debut in the National Hockey league between 2008 and
below) that predicted from systematic data analysis of many other           2019. This study examined scoring performance in the years
pitchers over many seasons. In his seven years at the Giants, Zito          surrounding their contracting from their rookie contract (often
(age 29–35 years) won 63 and lost 80 games for a win percentage             a 3 years contract) for those players who were offered a first
of 44.1%. He had averaged 222.75 innings pitched per year from              non-rookie contract. Two measures of performance reported by
2001 to 2006 at Oakland whilst at the Giants he averaged only               Hurley (2019) were:
162.53 innings pitched per year. A comparable example from                    ∗Points Per game (PPG): (Total goals plus assists) divided by
the MLB batting side is the 2011 decision by the Los Angeles                  games played.

Frontiers in Sports and Active Living | www.frontiersin.org             6                                        July 2021 | Volume 3 | Article 671601
Foster et al.                                                                                                                                 Playing-Side Analytics

  FIGURE 2 | Tracking athlete performance decline: shooting efficiency analysis of Kobe Bryant 2005–2006 vs. 2015–2016. Source: reprinted with permission of
  Goldsberry (2019).

Frontiers in Sports and Active Living | www.frontiersin.org                      7                                             July 2021 | Volume 3 | Article 671601
Foster et al.                                                                                                                                Playing-Side Analytics

TABLE 2 | Kobe bryant shooting accuracy: 2005–2006 vs. 2015–2016.

      In-the-paint                                Shots within arc (2-Points)                                       Shots beyond arc (3-Points)

                      #1             #2            #3          #4               #5                #6         #7          #8        #9                  #10

2005–2006            58%           41%            45%         48%               41%               28         35          37        36                  47
2015–2016            51%           33%            41%         20%               31%               10         27          29         9                   M

Goldsberry (2019).

  FIGURE 3 | NHL player performance in rookie contract years and first-non-rookie years: 2008–2019. Source: Hurley (2019).

   ∗Points Per TOI (PPTOI): (Total goals plus assists) divided by                     as the club, shares the risks of subsequent drop-offs in the
   Time on the ice (TOI) in minutes.                                                  player’s performance.
Figure 3 plots these two metrics for those players with
performance data for a five-year period that encompasses the last                     PRE-GAME AND WITHIN-GAME
3 years of the rookie contract (called Year−2, Year−1, and Year                       STRATEGY AND DATA ANALYTICS
0) where Year 0 is the last year of the rookie contract and the
first 2 years of the first non-rookie contract (called Years +1, and                  Sporting clubs have long made quantitative assessments of
Year +2).                                                                             the various levels of ability of their players and those on
    The dramatic pattern observed in Figure 3 is that the                             opposing teams. The advent of extensive data tracking for
rookie in the last year of the first contract has very strong                         vast numbers of games has greatly facilitated more rigorous
performance in scoring, but then performance in the second                            evidenced-based assessment of the abilities of individual players.
contract subsequently drops.                                                          It has also facilitated highlighting areas of player strengths that
    This contract year phenomenon has also been documented                            need reinforcing or weaknesses that either can be addressed or
in baseball and basketball (White and Sheldon, 2013; O’Neill,                         adjustments made in game strategy.
2014). One explanation is that players in the final year of                               In many sports, key decisions are being made on a continual
their contract “pull out all the stops” in the year before their                      basis as a game progresses. Pre-game and within-game analytics
next possible contract and then revert more to their “normal”                         is an area where much work has been conducted. Three examples
playing style (White and Sheldon, 2013; O’Neill, 2014). Such                          here will be used to illustrate this application. These are (i)
analytics-based information can assist a club general manager                         Fourth Down Decision-Making in College Football or the
in several ways. One is in the period to write a subsequent                           NFL, (ii) Field-Shifting Defensive Analytics in Baseball, and
contract. The default period for the first non-rookie contracts                       (iii) Basketball Defensive Strategy Analysis of Opposing Team.
would be shorter (say 2 years) rather than longer and include                         In each case, the role of pre-game or within-game analytics
incentive-based compensation. Another use is to include in                            is to analyze data sets from many prior games to identify
contracts incentive-based clauses so that the player, as well                         decisions that have a higher likelihood than other decisions

Frontiers in Sports and Active Living | www.frontiersin.org                      8                                            July 2021 | Volume 3 | Article 671601
Foster et al. Playing-Side Analytics
of achieving preferred outcomes. The appropriate benchmark outfielders, such as a four outfielder defense as opposed to the
is whether decisions are made that increase the likelihood long tradition of three outfielders. A four outfielder defense may
of preferred outcomes vis-à-vis decisions made without such have a better probability of an out or a restricted number of bases
data analytics. hit for a batter who hits more long balls and makes fewer ground
hits through the in-field. For instance, the Houston Astros in
Fourth Down Decision-Making in College 2018 shifted their fielders 43.5% of the plate appearances by the
Football or the National Football League opposing team11 . The growing use of this data is argued to be
One stream of football analytics examines how teams in varying a major factor in baseball becoming more defensive driven and
contexts may have a higher likelihood of more points if they leading to lower scoring in many games12 A similar data analytic
attempt the 4th down play over taking the field goal attempt. approach is being used by many cricket teams to guide field
Higher likelihood does not guarantee that a touchdown will be placement when different batters are at the wicket.
made and coaches can vary in their willingness to assume the risk
that a touchdown will not be made. The New England Patriots of Basketball Defensive Strategy Analysis of
the NFL are often used as an exemplar of the payoffs from being Opposing Team
more aggressive in going for a touchdown than taking the higher Shooting charts (such as those for Kobe Bryant shown in
likelihood field goal attempt10 . Figure 2) for each of the players on a forthcoming opponent’s
Charts called “4th Down Decision Analysis” built on two squad are now a standard tool in basketball pre-game defensive
variables (distance to 4th down and field position) have long strategy. The shooting charts of different NBA players illustrate
been inputs into decision making. Recent analytics research has how players have vastly different abilities that are important
examined multiple factors that affect the likelihood of getting the to consider in developing defensive strategies. Table 3 used
first down or the touchdown. For example, one college study of data from Goldsberry (2019) to showcase the different shooting
all games played by the 65 teams in the Power 5 Conferences from success rates of three NBA players.
2015 to 2018 reported that “distance to go, pass or run, the line of Coaches and players on the opposing teams gain much by
scrimmage, and the week of the season are significant factors in anticipating the playing patterns of different players they will
predicting a successful 4th down” (Blinkoff et al., 2020). be defending against. Shooting charts like that in Figure 2 can
It is important to examine the context in which data is also be used by coaches and trainers with their own players to
collected before generalizing from specific studies. Consider highlight areas of strength of their squad that need reinforcing or
generalizing to the NFL from fourth down decision making weaknesses that should be strengthened.
evidence based on college data. Such evidence may be less Changes in the playing focus of individual players can increase
generalizable to the NFL for several reasons. One reason is their value to a squad. Consider Kevin Love in the NBA. He
potential differences in fourth down rules between college and the has sizably changed his playing strategy to better align with
NFL. For example, if you miss a field goal in college the ball for the the heightened awareness of the value of quality three-point
opponent goes back to the line of scrimmage while in the NFL if shooting. As noted in Table 4, his percentage of total scoring
you miss a field goal the ball for the opponent gets spotted where from successful three-point shots over the first eight seasons of
the kicker missed the kick. A second reason is that the success rate his NBA career increased sizably.
of kickers and punters in the NFL is typically higher than that in For his first NBA season, Love played as a center and then
college games which is an input into analytics decision making in from 2009 to 2010 as a power forward. As Figure 1 illustrates,
this area. Love’s shift in his own game playing is part of a general shift by
all players in the NBA to increase their percentage of three-point
Field-Shifting Defensive Analytics in shots. This shift has been accompanied by increased training
Baseball efforts by coaches, trainers and players on this now pivotal part
For many years, managers in baseball have recognized that hitters of basketball games.
on an opposing team differ in where they hit the ball most
frequently and how that may vary with different pitchers. The HEALTH AND FITNESS AND DATA
growing sophistication of MLB game tracking has increased the
quality of information about the projection of balls and the
ANALYTICS
characteristics of the pitcher’s delivery (such as ball speed and Health and fitness analytics has been a growth area in all parts of
batting box position of hitter) for each hit. Analytic charts are society. Multiple startups and existing companies have developed
being developed based on tracking of the hitting profiles of numerous products and tracking devices that monitor the health
the opposing team when facing either the pitchers they will be and fitness of individuals. The sporting industry has been an
lined up the next game or those of other pitchers viewed as important arena where these devices have been developed. Areas
comparable. Using these charts, managers can place fielders in included heart monitoring, body muscle strength, sleep patterns,
positions more likely to catch fly balls or keep base hits to a
minimum. They can also experiment with different numbers of 11 M. Petriello, “9 things you need to know about the shift.” MLB.com (May
16th, 2018).
10 Available online at: https://www.espn.com/nfl/story/_/id/28073660/fourth- 12 Available online at: https://www.cbssports.com/mlb/news/why-its-time-for-
decisions-changed-good-10-years-ago-how-patriots-innovated. major-league-baseball-to-ban-the-shift/.
Frontiers in Sports and Active Living | www.frontiersin.org 9 July 2021 | Volume 3 | Article 671601Foster et al. Playing-Side Analytics
TABLE 3 | Shooting charts of curry, james and love for the 2015–2016 NBA season.
In-the-paint Shots within arc (2-Points) Shots beyond arc (3-Points)
#1 #2 #3 #4 #5 #6 #7 #8 #9 #10
Stephen Curry 64% M M M M 43% 43% 48% 48% 52%
Lebron James 68% 41% 37% 37% 40% 24% 27% 28% 38% 28%
Kevin Love 53% M M M M 45% 36% 30% 38% 35%
Goldsberry (2019): Curry (p. 65), James (p. 164), and Love (p. 168).
TABLE 4 | Kevin Love proportion of three-point shotting, 2008–2009 to 2015-2016.
2008–2009 2009–2010 2010–2011 2011–2012 2012–2013 2013–2014 2014–2015 2015–2016
2.8% 16.4% 20.6% 26.6% 30.9% 35.6% 41.1% 44.9%
Goldsberry (2019), p. 167.
and injury prevention and rehabilitation. Some examples that John Surgery. Starting in 2007 the MLB installed PitchF/x in
illustrate the pervasive impact of analytics in several of these areas each ballpark. This is a pitch tracking system “that measures
are presented in the following sub-sections. the velocity, movement, release point, spin, and pitch location
for every pitch thrown, allowing statisticians to perform detailed
Training and On-Field Tracking of Athletes analysis” (Hurley, 2020, p. 13). Tommy John Surgery “replaces
in Soccer a ligament in the medial elbow with a tendon from somewhere
An illustrative study that highlights athlete tracking with else in the patient’s body. A torn ligament typically comes from
wearables is the work of Ravindranathan et al. (2019). This repetitive use of the elbow, such as making the violent motions
study used information provided by the Zephyr Bioharness involved in throwing a baseball” (Hurley, 2020, p. 16). This study
device for 21 players of a soccer team during both practices and examined all pitchers who threw at least 100 innings in a season
games for the entire season. The variables tracked included time for the 2007 to 2019 seasons. The joint findings were that (i)
(seconds), heart rate (beats per minute), breath rate (breaths pitchers who threw harder had a higher likelihood of injury
per minute), speed (mile per hour), peak acceleration (G force), needing Tommy John Surgery, and (ii) pitchers who threw harder
and GPS–Latitude, Longitude Co-ordinates (degrees minutes had higher compensation (Hurley, 2020). One implication here
seconds). Large amounts of data was regularly collected from is that reducing the innings pitched per game by high-velocity
each player. With this data, the researchers could analyze patterns pitchers can result in their careers being extended. Future analytic
across athletes in their performance. Elite soccer clubs are now research here offers the promise of identifying factors at the
regularly receiving downloads of such information after each individual pitcher level that enable early warning signals of the
practice. This data highlights how athletes vary in their reaction differential likelihood of individual pitchers on a squad for a torn
to training routines. It has also red-flagged the potential for ligament injury.
the over-training of athletes, beyond which their performance
Sleep Patterns of Athletes and In-Game
levels decline. One side benefit that several coaches have observed
is the early warning signals of underperformance by players Performance
in training that have benefits in their decisions about player Sleep research is a rapidly growing research industry in general,
selection for forthcoming games and time in those games before as well as for the sports industry specifically. Specific journals
they are substituted. Another benefit is that it is harder for such as Sleep Medicine Reviews13 publish many studies in this
players with an inclination to “shirk” hard training routines to area. There is a growing body of evidence that the one-size-fits-all
remain undetected. approach (such as recommended minimum sleep time) ignores
important differences across athletes (and people in general)
in the impact on their performance and injury likelihood of
Injury Propensity Determinants for MLB both the length and type of their sleep patterns. Sleep mobile
Pitchers and Early Warning Signals apps are increasingly being viewed to gain insight into this area
Sports medicine has been a central part of the sports industry of research.
for many decades. Innovative use of analytics is advancing the While sleep research is a major area of medical research for the
ability of clubs to tailor training programs and playing time in general population, athletes can differ in systematic ways which
games to have athletes perform at their peak levels and reduce the
likelihood of serious injuries. An example is Hurley’s (2020) study 13 An example of a meta study based on a review of 42 separate papers is
of the connection between MLB pitcher velocity and Tommy Denis et al. (2018).
Frontiers in Sports and Active Living | www.frontiersin.org 10 July 2021 | Volume 3 | Article 671601Foster et al. Playing-Side Analytics
makes it important to consider such differences when counseling being installed by the NFL in each stadium in the league. These
athletes on sleep behavior. Athletes come from a more narrower sensors “capture real time location data, speed and acceleration
area of the general population age profile, are typically more for every player, for every play on every inch of the field.
healthy and are more active in rigorous training routines. In some Sensors throughout the stadium track tags placed on players’
cases, athletes can have travel schedules that are different, such shoulder pads, charting individual movements within inches.”15
as sleeping in different beds for road games and spending more The second league role is investment in new technologies and
time on airplanes. Athletes in the NBA and NHL can face extra the evaluation of ongoing streams of new analytics products. A
sleep challenges with so-called “back to back games” (games in third role is league sponsored hackathons where third parties
different cities on successive days) that athletes in sports that compete on best solutions to address league-wide problems
play on a one game a week schedule (such as NFL football) in data analytics. Another role is a league having an internal
rarely face. Walsh et al. (2020) provide an extensive review of consulting unit that highlights the best data analytics practices in
research and “expert consensus recommendations” on “sleep and the same way that some leagues have business side best-practices
the athlete.”14 An example of athlete specific factors to consider is consulting groups (such as the NBA’s Team Marketing & Business
a higher likelihood of concussion for some positions and for some Operations (TMBO) unit) for their clubs.
athletes a higher level of anxiety before major games or when they A second accelerator is Success Stories and Documented
have had a period of extended under-performance. Innovations. Success with a data analytic innovation can be
an important prompt to its broader adoption in many areas.
Section MLB Case Study Highlighting the Sustained Success of
GROWTH ACCELERATORS AND GROWTH
the Oakland Athletics of this paper documents the sustained
INHIBITORS OF BROADER AND DEEPER on-field success of the Oakland Athletics. This success was an
ANALYTICS ADOPTION IN PLAYER-SIDE important prompt to other clubs adopting what they believed
DECISION MAKING were some of the innovations underlying the Athletics on-
the-field success. Injury and recuperation innovations that
The only known systematic ranking of the analytics groups of reduce the severity of player injuries or the time taken to
sporting clubs is the ESPN The Magazine’s 2015 analysis of all recover have high value across all clubs and are likely to be
122 clubs in the MLB, NBA, NFL, and NHL. This article rated quickly adopted by clubs and their players. Medical practitioners
and then ranked the then 122 teams on the strength of each using these medical innovations have an economic incentive to
franchise’s analytics staff, its buy-in from execs and coaches, its publicize their specialties. Similarly, companies developing new
investment in biometric data, and how much its approach is tracking technologies that facilitate new ways of analyzing player
predicated on analytics. Based on their analysis, clubs were also movements on the playing field also have an economic incentive
placed into one of five categories: “All-In,” “Believers,” “One- to broadly publicize their innovations.
Foot-In,” “Skeptics,” or “Non-Believers.” A summary of this data Third, the Mobility of Key Analytic Personnel can accelerate
is shown as Figure 4, which presents a summary of the clubs in data analytics adoption. Indeed, human capital mobility is a
each category by league, as well as the Top 10 and the Bottom powerful way in which analytics adoption is fast-tracked by
10. The ESPN study highlighted the vast differences across clubs clubs wishing to expand their investment in analytics. Multiple
in their perceived level of and commitment to analytics being an examples of high profile analytics talent moving across MLB
important part of player side decision making. clubs illustrates this mobility. For example, Andrew Friedman
We now highlight some important growth accelerators and went from the Tampa Bay Rays to Los Angeles Dodgers in 2014.
growth inhibitors for a broader and deeper adoption of analytics A second example is Farhan Zaidi who moved in 2014 from the
across sporting clubs. Oakland Athletics to Los Angeles Dodgers and then, in 2018,
moved again to the San Francisco Giants. Multiple sports clubs
Growth Accelerators are hiring analytics personnel from outside the sporting industry
This section describes growth accelerators for the broader and which has the extra upside of a “fresh set of ideas” being applied
deeper adoption of analytics in player-side decision making. to many of the application area in sports.
Multiple of these drivers apply not just to the sports arena but also New Technologies and New Data Bases is another accelerator.
to the expanding role of data analytics in many areas of commerce Major investments are being made by many companies and
and society. governments as well as the investment community (such
The first growth accelerator is The Powerful Role of Leagues as venture capitalists) in either new technologies (such as
which can involve multiple areas. One league role is mandating AI-Artificial Intelligence and Visual Recognition) or new
state of the art data analytics tracking of all games in a standard applications of those technologies. The sports arena is just one
format that is quickly made available to all clubs for analysis. of multiple areas where these investments are accelerating the
By covering the setup, costs and operation of such technology adoption of data analytics. An example in the player-side of
and data sharing, a league creates a more level playing field (and sports is the broader adoption of tracking wearables like the
data access) across all clubs to key information for analysis. An Zephyr Bioharness. These wearables enable clubs to build a large
example is the NFL’s Next Gen Stats which is based on sensors data base covering many player variables from every practice,
14 Walsh et al. (2020). 15 Available online at: https://nextgenstats.nfl.com/glossary.
Frontiers in Sports and Active Living | www.frontiersin.org 11 July 2021 | Volume 3 | Article 671601Foster et al. Playing-Side Analytics FIGURE 4 | Analytics rankings of North American clubs in the MLB, NBA, NFL, and NHL by ESPN The Magazine in 2015. training session or competition. Prior to the development and A fifth accelerator, High Profile Conferences and Analytics consistent use of such wearables by all players, the available date Champions/Thought Leaders, is a key engine in the broader on player training was less structured, covered fewer variables, growth of analytics. Knowledge transmission is one role of such and was less reliable (in part due to inter-observer variability). conferences with their associated networking. Conferences in Frontiers in Sports and Active Living | www.frontiersin.org 12 July 2021 | Volume 3 | Article 671601
Foster et al.                                                                                                                              Playing-Side Analytics

areas such as Artificial Intelligence and Biometrics showcase                          initiatives in data collection, analysis and in talent development
many speakers and companies. An important example in                                   can play an important role in reducing the upfront and ongoing
sports is the MIT Sloan Sports Analytics Conference16 which                            cost of building state of the art analytics groups.
was started in 2006 and has built a tremendous industry                                    Hindsight Evaluation of Decisions is a challenge. The
reputation. A caveat here is that during these conferences and                         appropriate benchmark for evaluating whether analytics can be
elsewhere, companies and clubs are often reluctant to extensively                      an important addition to player-side decision making is whether
expose their analysis and findings in an attempt to retain                             the resulting decisions made have a higher likelihood of a
a competitive advantage or to build revenues from products                             desired outcome than does a decision made without analytics.
sold commercially.                                                                     Like all decisions made under uncertainty, a good decision
   Academic and Corporate Research and Student Analytics                               using this criteria does not guarantee a desired outcome. In a
Related Clubs are a valuable accelerator of future adoption of                         similar vein, a good outcome can occur from a flawed decision
analytics in general and sports in specific. Research on sports                        process. Outcome-based evaluation has a long tradition by sports
analytics is occurring at many universities as well as in sporting                     commentators and on talk-back radio programs. Hindsight
organizations and companies. Relatively new journals such as                           evaluations of General Manager draft decisions often focus on
the Journal of Sports Analytics and ASA: Statistics in Sports                          players they pass on and subsequently become stars. For example,
Section illustrate the growing research activity in this space.                        Tom Brady—one of the most successful players in NFL history—
Many universities now have sport analytics clubs that attract                          was chosen by the New England Patriots in the sixth round,
many students from diverse areas such as computer science,                             as the 199th pick of the 2000 NFL draft. This draft position
mathematics, statistics as well as economics, business, and                            means he was passed over by all 32 clubs multiple times. As of
sport management. Students in these clubs can be an attractive                         2021, at age 43, he had been the quarterback on seven Super
recruiting ground for clubs investing in sports analytics as well as                   Bowl winning teams. Hindsight talent draft overlooks should
a source of innovative ideas.                                                          be a crucible for looking into what information cues may be
   Consumer led demand for analytic information and insights is                        useful to give more weight in future decision making but not
another growth accelerator where key external stakeholders find                        for an automatic judgement that it implies a poor prior draft
such information helps them make better decisions or have a                            decision. Importantly, luck plays an important role in achieving
richer viewing experience. For example, sports bettors are often                       good outcomes as well as making good decisions.
avid consumers of data as they seek to improve their likelihood                            Being exposed to trenchant hindsight-based criticism and
of winning. Sports broadcasters have been aggressive adopters                          mocking of coach or general managers and their decisions is an
of new technologies as they aim to increase viewer experience.                         inherent part of their working in the sporting industry. Concern
For example, broadcasts of baseball games now showcase data                            over media criticism can lead to some highly risk-averse coaches
on the speed of pitchers, the speed of runners, and the flight                         taking decisions that line up with “conventional wisdom” and
paths of balls hit. There can be a virtuous circle here where                          not basing their decision with guidance from analytics because
data analytic innovations that provide key insights for internal                       of fear it may have a bad outcome. Figure 4 highlights that even
decision making by clubs are also built into broadcasts of sports.                     in 2015 a sizable number of teams were classified in the ESPN
In some cases, the technical staff of broadcasters further extend                      Analytics rankings as either Skeptical (27/122 = 22%) or Non-
the innovation in ways that clubs themselves then build into their                     Believers (10/122 = 8%) despite much evidence that it was an
own decision making.                                                                   important part of player-side decision making.
                                                                                           A third inhibitor is the Frequent Turnover in Coaches and
Growth Inhibitors                                                                      General Managers at clubs. Since coaches and general managers
This section describes different growth inhibitors to the broader                      can vary in their preferences for different types of analytics tools,
and deeper adoption of analytics in player-side decision making.                       this impacts the adoption of analytics. For example, the mean
   A major challenge facing sport analytics, is the Cost                               (median) tenures of coaches in the NFL is 4.60 (3.80) seasons
of Building a Well-Resourced and Well-Functioning Analytics                            while in the NBA is 3.05 (2.18) seasons, and for general managers
Groups. Scarcity of talented seasoned personnel was a frequent                         the mean (median) tenures in the NFL are 5.27 (5.17) seasons and
blockage when some clubs made early commitments to scaling                             in the NBA are 4.82 (4.92) seasons (Foster et al., 2020). Turnover
up their analytics function. While there has been an increase in                       in key personnel can lead to recently adopted programs being
the supply of such talent in recent years, such talent is highly                       abandoned without adequate runway to evaluate its effectiveness.
attractive to a broader set of companies in other industries at                        The development of strong analytics programs is aided by
compensation levels many sporting clubs are reluctant to meet.                         reasonable stability in the key stakeholders of those programs.
Billy Beane, in visits to Stanford University classes, frequently                          A fourth inhibitor, Negative Characterizations of Analytic
expresses concern that companies such as Apple, Facebook,                              Approaches to Decision Making, is the reality that new
and Google were more likely to attract the promising talent in                         innovations can appear to be intimidating to key actors who
the analytics group at the Oakland Athletics than were other                           were schooled in a different era. One set of reactions is open
MLB clubs. Efforts by sporting leagues to invest in league wide                        hostility to the new innovation, which occurs in many sectors
                                                                                       where new modes of thinking can be challenging to those whose
16 Available    online at: https://www.sloansportsconference.com/about/mission-        core expertise is being challenged. For example, Charles Barkley
and-histor.                                                                            is one frequently quoted ex-player and media commentator

Frontiers in Sports and Active Living | www.frontiersin.org                       13                                        July 2021 | Volume 3 | Article 671601
You can also read