Post-COVID-19 Scenarios of Global Airline Traffic until 2040 That Reflect Airport Capacity Constraints and Mitigation Strategies
←
→
Page content transcription
If your browser does not render page correctly, please read the page content below
aerospace
Article
Post-COVID-19 Scenarios of Global Airline Traffic until 2040
That Reflect Airport Capacity Constraints and
Mitigation Strategies
Marc Christopher Gelhausen *, Peter Berster and Dieter Wilken

                                          Institute for Air Transport and Airport Research, German Aerospace Center (DLR), 52134 Cologne, Germany;
                                          peter.berster@dlr.de (P.B.); dieter.wilken@dlr.de (D.W.)
                                          * Correspondence: marc.gelhausen@dlr.de; Tel.: +49-220-3601-2463

                                          Abstract: Although there has been an unprecedented decline in traffic volume due to the COVID-19
                                          crisis, robust growth in global demand for air transport services in the past means that air traffic is
                                          expected to recover in the long term. While capacity constraints are currently not a major topic at
                                          airports due to the extremely low levels of traffic, there is growing evidence to suggest that important
                                          nodes of the worldwide airport network will struggle to deal with capacity constraints after the
                                          recovery. The objectives of this research were therefore as follows: to elaborate long-term global
                                          passenger and flight volume scenarios in a post-COVID-19 world; to conduct an empirical and
                                          model-based analysis of the impact of limited airport capacity on the future development of air
                                          traffic in these scenarios; and to derive general strategies for mitigating capacity constraints at certain
                                          international airports. Thus, the main aim of this paper is to present a model-based scenario analysis

                                   of the long-term impact of the COVID-19 crisis on the capacity situation for airports. Our results
                                          indicate that once the pandemic is over, the capacity crunch will remain on the airports’ agenda for
Citation: Gelhausen, M.C.;
                                          some time.
Berster, P.; Wilken, D. Post-COVID-19
Scenarios of Global Airline Traffic
until 2040 That Reflect Airport
                                          Keywords: airport capacity constraints; air transport forecast; aircraft size; COVID-19; forecast
Capacity Constraints and Mitigation       model; mitigation measures; runway capacity
Strategies. Aerospace 2021, 8, 300.
https://doi.org/10.3390/
aerospace8100300
                                          1. Introduction
Academic Editor: Michael Schultz               Global air traffic is heavily concentrated on a relatively small number of important
                                          airports, the majority of which are either facing capacity problems or will face such prob-
Received: 16 June 2021
                                          lems in the near future. Although the COVID-19 crisis has released the pressure on airport
Accepted: 11 October 2021
                                          capacity, global air traffic is expected to continue to grow in the long term, albeit at a pace
Published: 14 October 2021
                                          that differs greatly between Asia and the Middle East on the one hand, and Europe and
                                          North America on the other. Whereas in Asia demand only began to grow during the last
Publisher’s Note: MDPI stays neutral
                                          few decades and is now rapidly increasing, demand in North America is more mature
with regard to jurisdictional claims in
                                          as there is already a high propensity to fly and the growth in demand is relatively low
published maps and institutional affil-
                                          compared to other markets. Demand in Europe, however, will continue to grow, albeit at a
iations.
                                          reduced rate.
                                               These differing expectations with respect to air traffic growth imply that future capac-
                                          ity problems will be less severe at major airports in North America than at Asian airports
                                          such as Delhi, Jakarta, Mumbai, and others. Due to further long-term growth in demand
Copyright: © 2021 by the authors.
                                          and political difficulties with populations living in the vicinity of airports who oppose the
Licensee MDPI, Basel, Switzerland.
                                          development of new airport capacity, the problem of overcoming airport constraints is
This article is an open access article
                                          likely to be aggravated in the future, primarily in Europe. The research question addressed
distributed under the terms and
                                          in this paper is as follows: which constellation of measures can be recommended to best
conditions of the Creative Commons
Attribution (CC BY) license (https://
                                          mitigate the negative effects of capacity problems in a post-COVID-19 era, depending on
creativecommons.org/licenses/by/
                                          the capacity class of airports, future flight volume, and average aircraft size? Currently,
4.0/).
                                          limited airport capacity is not a serious issue due to the rapid decline in air traffic volume

Aerospace 2021, 8, 300. https://doi.org/10.3390/aerospace8100300                                         https://www.mdpi.com/journal/aerospace
Aerospace 2021, 8, 300                                                                                            2 of 18

                         caused by the COVID-19 pandemic in 2020. However, at some point in the future air
                         traffic will recover and capacity problems are likely to reemerge. For this analysis we
                         employ two scenarios, named high scenario (HS) and low scenario (LS), for the year 2040,
                         to demonstrate the potential effects of different developments in demand on the capacity
                         needs of airports. These scenarios are characterised by two different paths to recovery.
                               We begin with a review of the relevant literature in Section 2. Section 3 presents the
                         model employed for the analyses in this paper. In Section 4 we discuss the two scenarios for
                         the year 2040, the effects of new runways and of employing bigger aircraft at constrained
                         airports, and the preferred constellation of these options with regard to the size of airports
                         and the aircraft they handle. We then draw a series of conclusions in Section 5.

                         2. Literature Review
                               Well-known long-term forecasts for global air traffic are typically conducted by aircraft
                         manufacturers such as Airbus [1], Boeing [2], and supranational organisations such as
                         the ICAO [3]. However, these forecasts have had to be updated because of the sharp
                         decline in air traffic volume caused by the COVID-19 pandemic. There are different
                         views on how air traffic might recover over the next few years or even the next decade.
                         Gudmundsson et al. [4] forecast that a recovery in world passenger volume would most
                         likely last until 2022 (66.5% probability) or 2023 (27.5% probability) and assign only a low
                         probability to the recovery lasting until 2026. In a more recent study, Brian Pearce from
                         IATA [5] forecasts that the traffic levels of 2019 will be reached once again between 2022
                         and 2023. Global industrial production and trade were already 2% above 2019 levels by
                         February 2021. Pearce points out that different markets will recover at different speeds, and
                         regions with large domestic markets such as Asia Pacific will recover earlier. In an updated
                         version of their Commercial Market Outlook (CMO), Boeing [2] forecast that it would take
                         about four to five years for air traffic to reach 2019 levels; however, they concede there is a
                         great deal of uncertainty about this. The CEO of Fraport, Stefan Schulte [6], expects only a
                         modest influence on the long-term development of air traffic. Finally, Airbus [7] expects
                         the commercial aircraft market to have recovered between 2023 and 2025, i.e., it would
                         take four to six years to reach pre-crisis levels. Eurocontrol [8] presented three scenarios for
                         European air traffic: in the first scenario, an effective vaccine is available in 2021 and 2019
                         levels of air traffic are reached in 2024. In the second scenario, the vaccine is available in
                         2022 and the recovery will have been completed sometime in 2025. In the third scenario,
                         there is no effective vaccine available and recovery is delayed until around 2029. From our
                         perspective, the latter seems to be an overly pessimistic view given the latest developments.
                         Nevertheless, because of the high degree of uncertainty on future development of the
                         COVID-19 pandemic, these forecasts should be treated with a bit of caution.
                               Airlines and airports have been affected in different ways by the COVID-19 pandemic.
                         Those that were well financed/funded and relied more on domestic markets with standard
                         economy class fares recovered more quickly than those serving more international mar-
                         kets [9]. Typical measures taken by airlines to respond to the crisis were changing flight
                         operations, rationalising the fleet, reducing staff numbers, and reconfiguring networks and
                         capacity [10]. Airlines chose smaller and more cost-efficient aircraft to handle the reduced
                         demand and remain economically viable [11]. Notably, the lower level of demand during
                         the COVID-19 pandemic enhanced the on-time performance of airlines [12]. Another
                         airline strategy is to focus more on air cargo, which has been affected much less by the
                         crisis and is acquiring increasing importance because of online deliveries [13]. From the
                         perspective of airports, slot reallocation at hubs, e.g., ensuring there are more available for
                         domestic traffic, could help speed up the recovery and be a valuable strategy for supporting
                         smaller airports, which otherwise will need larger amounts of governmental subsidiaries
                         to survive the pandemic [14].
                               Various studies have been conducted on the effects of airport capacity constraints
                         and measures for their mitigation (all pre-COVID-19) and these can offer some guidance
                         in the long term. In 2008, about 10–20 airports operated under capacity constrained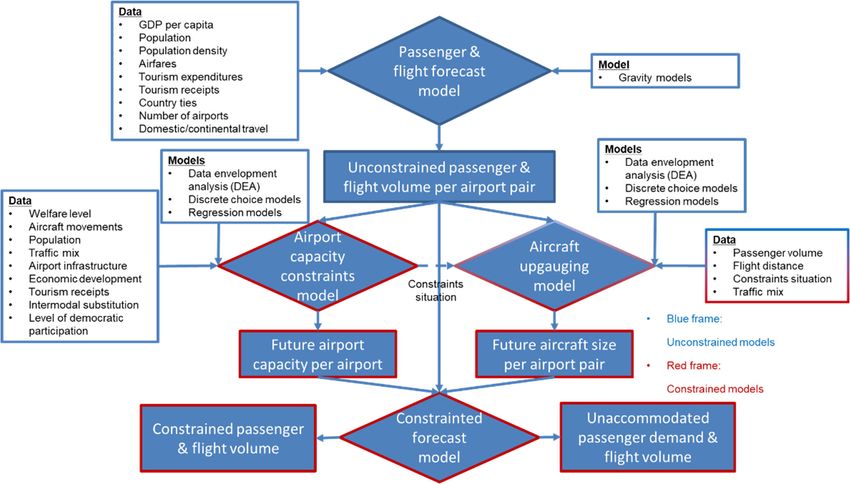
Aerospace 2021, 8, 300                                                                                            3 of 18

                         conditions, including New York LaGuardia, London Heathrow, Frankfurt and Paris Charles
                         de Gaulle. Therefore, approximately 6–15% of global air traffic was handled under capacity
                         constrained conditions [15]. Eurocontrol [16] considered capacity constraints and forecast
                         an average annual growth between 0.5% and 2.7% for IFR flights between 2017 and 2040.
                         In the most likely scenario, one of regulation and growth, they forecast an average annual
                         growth rate of 1.9% for IFR flights. Eurocontrol concluded that there is a capacity gap of
                         1.5 million flights in their most-likely scenario and a capacity gap of 3.7 million flights in
                         their global growth scenario, which is characterised by strong economic development. Due
                         to the capacity shortage, between 8% and 16% of air passenger demand, which equates to
                         between 160 million and 360 million people, cannot be served.
                               Gelhausen et al. [17] expect that almost 50 million and more than 250 million passen-
                         gers worldwide will not be accommodated in 2030 and 2040, respectively. This is despite
                         mitigation measures such as increasing airport capacity and utilisation as well as increasing
                         larger aircrafts over time to carry more passengers per flight. Gudmundsson et al. [18]
                         and Redondi and Gudmundsson [19] conducted extensive analyses and developed an
                         econometric model to assess the impact of airport capacity constraints on the flight network
                         and development of secondary hubs. In their first study [18], they identified significant
                         spillover effects, i.e., demand shifts, from London Heathrow to London Gatwick and
                         London City, as well as to airports such as Manchester and Birmingham. In their second
                         study [19], they identified significant spillover effects in European and intercontinental
                         travel from London Heathrow to Munich, Paris Charles de Gaulle, Madrid, and Doha,
                         and from Frankfurt to Munich, Amsterdam, Abu Dhabi and Ataturk. Gelhausen [20]
                         conducted a study that applied discrete choice analysis to analyse the impact of airport
                         capacity constraints on airport choice among travellers in the Stuttgart region of Germany.
                         Here, similar spillover effects were identified.
                               Increasing aircraft size is one of the measures for mitigating airport capacity con-
                         straints. As such, a number of studies have been carried out on aircraft size development
                         and its relation to various factors such as competition between airlines and airport capacity
                         constraints. Based on an analysis of Official Airline Guide (OAG) data, Burghouwt et al. [21]
                         demonstrated for the cases of London Heathrow and Gatwick that between 2004 and 2014,
                         capacity increases were mainly accomplished by increasing frequency in long-haul markets
                         and by raising aircraft size in short-haul markets. By contrast, Evans and Schäfer [22,23]
                         showed in a simulation model for the US market which comprises five airlines and 22
                         airports, nine of which are hubs and seven multi-airport systems, covering about 80%
                         of the scheduled available seat miles of the US market, that there is no significant shift
                         towards larger aircrafts. However, there is an increase in average arrival delay, which may
                         quadruple. Furthermore, they demonstrated that airlines tend to avoid airports with high
                         delays if there are viable alternatives. Givoni and Rietveld [24,25] found that airlines tend
                         to favour increasing flight frequency instead of aircraft size in a competitive environment.
                         This is especially true for most high-density short-haul markets, as there is a real choice
                         in aircraft size, albeit with some exceptions in Asia. In low-density short-haul markets,
                         larger aircrafts are not viable whereas in long-haul markets larger aircrafts are typically
                         the first choice. If, however, there is less airline competition, airlines tend to employ larger
                         aircraft to accommodate the airport capacity situation. These findings are supported by
                         Pitfield et al. [26], who analysed the traffic on North Atlantic routes between 1990 and
                         2006 to estimate an econometric model of aircraft size. A further study of US airports was
                         conducted by Pai [27] who identified various factors that determine aircraft size. Fukui [28]
                         analysed whether there is significant slot-hoarding behaviour at the airports of Chicago
                         O’Hare, Washington National, New York JFK, and LaGuardia. Through the development
                         of an econometric model, he concluded that the US slot system needs to be modified to
                         reduce such behaviour. The correlation between airport capacity constraint and aircraft
                         size was also confirmed in a model-based study by Takebayashi [29]. He demonstrated
                         that an expansion in runway capacity leads to a temporary downshifting of aircraft size
                         and increase in aircraft frequency. Berster et al. [30] showed that increasing aircraft size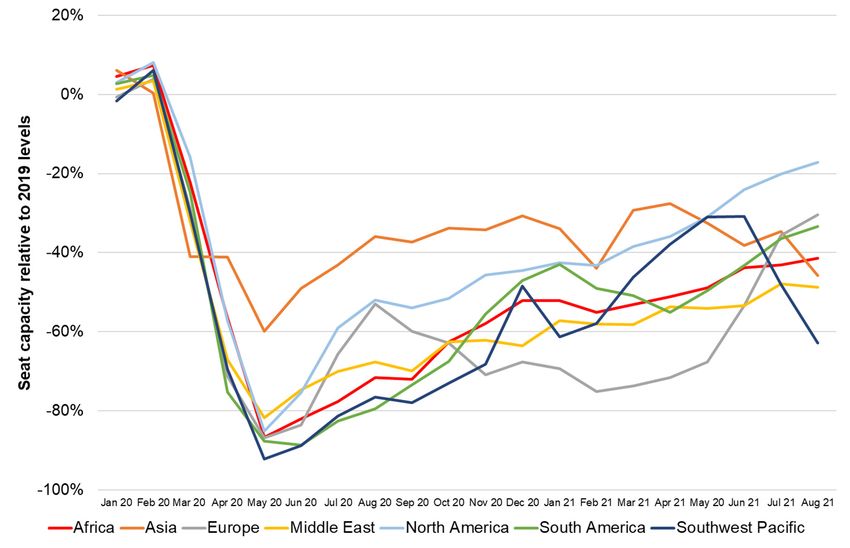
Aerospace 2021, 8, 300                                                                                            4 of 18

                         not only affects congested airports, but uncongested as well because of a lack of available
                         slots at destination airports. Button [31] discusses several myths about hubs and points
                         out a number of advantages from the perspective of the consumer. He asserts that using
                         off-peak times more intensively is possible only to a small degree, as flights are organised
                         in banks to coordinate the inbound and outbound journeys of airlines. Dennis [32] makes a
                         similar argument regarding shifting flights to less congested airports: deeming this simply
                         antithetical to the demands of passengers and hub airlines.
                               Another potential mitigation measure is to shift air passenger demand to other modes
                         of transport, especially high-speed rail. Jiang and Zhang [33] analysed the welfare effects
                         of a hub-and-spoke airline and high-speed rail providers. Amongst other things, they
                         identified a positive welfare effect of such cooperation if the airport is capacity constrained
                         and mode substitutability is high. By contrast, Castillo-Manzano et al. [34] revealed that
                         the substitution potential of high-speed rail services has been overestimated in the past
                         and that high-speed rail and airlines offer more independent services than might initially
                         appear to be the case. Thus, to a large extent, high-speed rail services generate their
                         own demand.
                               While various mitigation strategies are discussed in this paper in Section 4, we focus
                         on an empirical analysis of two mitigation measures:
                         •    increasing airport capacity and its utilisation, which also includes shifting flights to
                              off-peak hours to some degree, and
                         •    increasing seat capacity per flight and load factor, resulting in an average number of
                              passengers per flight (referred to as aircraft size).
                               Furthermore, we briefly present the potential offered by high-speed rail as an alterna-
                         tive to flying as well as the use of telecommunication technologies as a means to reduce
                         business travel.

                         3. Overview of the Model
                               This section provides a brief description of the general approach, as a detailed descrip-
                         tion of the model falls beyond the scope of this paper. The model is, however, documented
                         in detail in Gelhausen et al. [17]. The unique feature of the model is the forecast of airport
                         capacity constraints and its integration into the passenger and flight forecast. There is
                         currently no other model that considers worldwide airport capacity constraints.
                               Figure 1 illustrates the approach of the model. As a first step, the unconstrained
                         passenger and flight forecast is established, i.e., without the effects of limited airport
                         capacity and aircraft upgauging, triggered by airport capacity constraints. Boxes with
                         blue edges refer to unconstrained models while boxes with red edges refer to constrained
                         models; that is to say, they include the effects of limited airport capacity and related
                         aircraft upgauging. Boxes with blue and red edges refer to both categories. Passenger and
                         flight volume per airport pair are modelled by a gravity model with various explanatory
                         variables, of which the most important are future GDP per capita, population, and airfare
                         development. As a result of this step we obtain a so-called unconstrained passenger and
                         flight volume forecast for each airport pair, which represents the input for the airport
                         capacity constraints and aircraft upgauging models. The airport capacity constraints model
                         calculates current airport capacity for each airport using data envelopment analysis (DEA)
                         and regression models. Here, we focus on the technical runway capacity, as opposed to
                         the so-called declared capacity (e.g., IATA Worldwide Airport Slot Guidelines [35]), which
                         can be well below the technical runway capacity. A discrete choice model calculates the
                         probability for airport capacity expansion if airport capacity is not sufficient to handle the
                         forecast demand. This enables us to calculate an expected delay for a new runway, if indeed
                         this is possible at all. Important explanatory variables for these two models are the welfare
                         level and the number of people living around the airport, the number of aircraft movements
                         taking place in an airport, traffic mix, and the current airport infrastructure. The aircraft
                         upgauging model belongs to both the unconstrained and constrained models (box with blue
                         and red edges), as upgauging depends not only on the level of airport capacity constraints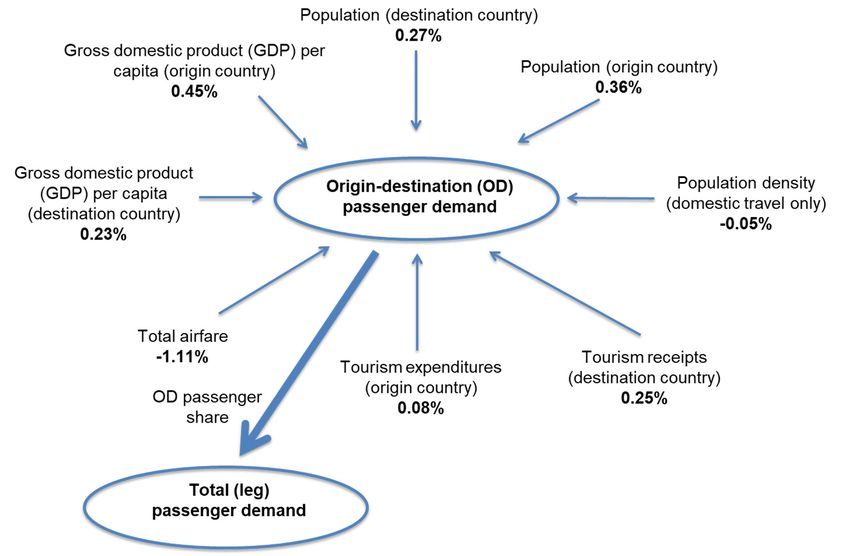
this is possible at all. Important explanatory variables for these two models are the welfare
Aerospace 2021, 8, 300
level and the number of people living around the airport, the number of aircraft move- 5 of 18
ments taking place in an airport, traffic mix, and the current airport infrastructure. The
aircraft upgauging model belongs to both the unconstrained and constrained models (box
with blue and red edges), as upgauging depends not only on the level of airport capacity
but also onbut
constraints various other
also on factors,
various such
other as passenger
factors, such as demand,
passengerflight
demand, distance,
flightand so on.
distance,
Likeso
and the
on.airport capacity
Like the airportconstraints model, it employs
capacity constraints model, itdata envelopment
employs analysis (DEA)
data envelopment anal-
and (DEA)
ysis regression.
and Factors suchFactors
regression. as passenger
such asvolume, flightvolume,
passenger distance,flight
the constraints
distance, situation
the con-
at airports,
straints and traffic
situation mix play
at airports, antraffic
and important
mix role.
play The forecast result
an important role. isThe
theforecast
averageresult
number is
of passengers per flight (aircraft size) for each airport pair. Combining the
the average number of passengers per flight (aircraft size) for each airport pair. Combin- future airport
capacity
ing and aircraft
the future airportsize per airport
capacity pair with
and aircraft theper
size unconstrained
airport pair passenger forecast yields
with the unconstrained
the constrained
passenger forecast
forecast yields model. The forecast
the constrained results
forecast model.are The
the forecast
constrained passenger
results and
are the con-
flight volume
strained as well
passenger andas flight
the unaccommodated
volume as well as passenger demand and flight
the unaccommodated volume
passenger caused
demand
by limited
and airport caused
flight volume capacity. by limited airport capacity.
Figure
Figure 1.
1. Overview
Overviewof
ofthe
theforecast
forecast model
model (own
(own illustration).
illustration).
Figure 22 illustrates
Figure illustrates the
the impact
impact of of the
the major
major input
input factors
factors on on OD
OD passenger
passenger demand,
demand,
which underpins
which underpins the the forecasts.
forecasts. For
For example,
example, ifif airfares
airfares rise
rise by
by 1%,
1%, ODOD passenger
passenger volume
volume
declinesby
declines by1.11%.
1.11%.Conversely,
Conversely,if if gross
gross domestic
domestic product
product (GDP)
(GDP) perper capita
capita increases
increases in thein
the origin country by 1%, then OD passenger demand rises
origin country by 1%, then OD passenger demand rises by 0.45%. Total passenger demandby 0.45%. Total passenger
demanddepends
growth growth depends
on the OD on passenger
the OD passenger
share. Ifshare.
the ODIf the OD passenger
passenger share isshare
less isthan
less32%,
than
32%,total
then thenpassenger
total passenger
volume volume
growthgrowth
is higheris higher
than ODthan OD demand
demand growth; growth;
however, however,
if OD
if OD passenger
passenger share isshare
higheris higher
than 32%,thantotal
32%,passenger
total passenger
volumevolumegrowthgrowth is marginally
is marginally lower
lowerOD
than than OD demand
demand growth.growth.
GDP is GDP broken is broken
down into downfour into fourGDP
parts: parts:perGDP perfor
capita capita
the
for the origin and destination country, and population for origin
origin and destination country, and population for origin and destination country. How- and destination country.
However,
ever, total elasticity
total GDP GDP elasticity
is 1.31isand
1.31thus
andOD thus OD passenger
passenger demand demand is elastic
is elastic to GDPtovaria-
GDP
variations. This more or less conforms to typical results, such as those
tions. This more or less conforms to typical results, such as those of [36,37]. However, it is of [36,37]. However,
it is important
important to noteto note thatuse
that we weadditional
use additional variables
variables such such as distance,
as distance, tourismtourism receipts,
receipts, and
and expenditures to account for different market segments and an
expenditures to account for different market segments and an airfare variable. The latter, airfare variable. The
latter, is
which which is generally
generally not included
not included in models inbecause
models of because
a lack of of suitable
a lack ofdatasuitable data on
on airfares in
the past, typically leads to a lower modelled income elasticity because both GDP andGDP
airfares in the past, typically leads to a lower modelled income elasticity because both air-
and airfares
fares influence influence the purchasing
the purchasing power of power of air passengers.
air passengers.
The model currently contains no shift of passenger traffic to neighbouring airports
if an airport reaches its capacity limit. This is clearly a limitation of the model, but it is
difficult to determine a realistic share of traffic shift to neighbouring airports. In the past,
increasing aircraft size has been a favoured choice in the event of capacity constraints.
Figure 3 presents the example of the London area which contains the airports London
Heathrow, Gatwick, Luton, and Stansted. Here, London Heathrow is a prime example
of a capacity constrained airport while Gatwick, the second major airport in the London
area, is heavily utilised. In fact, Gatwick is the single runway airport (it is only allowed to
operate one runway) with the highest utilisation in the world, with around 280,000 aircraft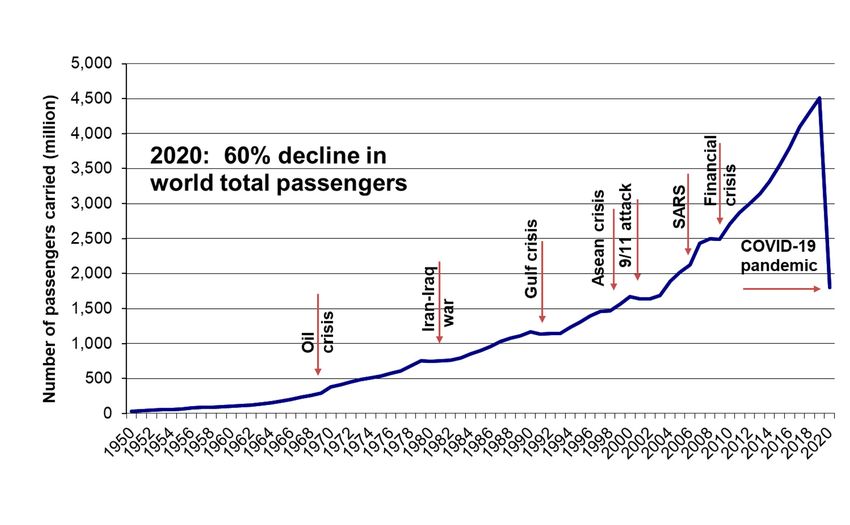
Aerospace 2021, 8, 300                                                                                                                      6 of 18

                                    movements in 2018. Figure 3 depicts the development of passenger volume and aircraft
                                    movements at these airports, as well as for the London area and UK between 2006 and 2019
                                    relative to 2006. If we consider the UK or the London area as a whole, aircraft movements
                                    have remained virtually constant (UK) or increased slightly (London area + 10%), while
                                    passenger volume has increased by 33% between 2006 and 2019 in the UK and London area.
                                    Among the secondary airports with substantial capacity reserves, only Luton has managed
                                    to increase flight volume substantially by about 50%, while there was a slight decline in
                                    Stansted between 2006 and 2019. Flight volume remained constant at Heathrow and even
                                    increased at Gatwick by about 30%, despite the already high utilisation in 2006. Of course,
Aerospace 2021, 8, x FOR PEER REVIEW                                                                                  6 of 20
                                    past patterns might not necessarily translate into future patterns so more research  on this
                                    topic is needed.

 Aerospace 2021, 8, x FOR PEER REVIEW                                                                                         7 of 20
                                     Figure 2. Major elasticities of the unconstrained passenger demand volume model [own illustration].
                                   Figure 2. Major elasticities of the unconstrained passenger demand volume model [own illustra-
                                   tion].

                                         The model currently contains no shift of passenger traffic to neighbouring airports if
                                   an airport reaches its capacity limit. This is clearly a limitation of the model, but it is diffi-
                                   cult to determine a realistic share of traffic shift to neighbouring airports. In the past, in-
                                   creasing aircraft size has been a favoured choice in the event of capacity constraints. Fig-
                                   ure 3 presents the example of the London area which contains the airports London
                                   Heathrow, Gatwick, Luton, and Stansted. Here, London Heathrow is a prime example of
                                   a capacity constrained airport while Gatwick, the second major airport in the London area,
                                   is heavily utilised. In fact, Gatwick is the single runway airport (it is only allowed to op-
                                   erate one runway) with the highest utilisation in the world, with around 280,000 aircraft
                                   movements in 2018. Figure 3 depicts the development of passenger volume and aircraft
                                   movements at these airports, as well as for the London area and UK between 2006 and
                                   2019 relative to 2006. If we consider the UK or the London area as a whole, aircraft move-
                                   ments have remained virtually constant (UK) or increased slightly (London area + 10%),
                                   while passenger volume has increased by 33% between 2006 and 2019 in the UK and Lon-
                                   don area. Among the secondary airports with substantial capacity reserves, only Luton
                                   has managed to increase flight volume substantially by about 50%, while there was a
                                   slight decline in Stansted between 2006 and 2019. Flight volume remained constant at
                                   Heathrow
                                     Figure 3. and    evendevelopment
                                                 Relative  increased atofGatwick
                                                                            passenger by volume
                                                                                          about 30%,and despite   the alreadyathigh
                                                                                                         aircraft movements            utilisa-
                                                                                                                                   airports  in the
                                 Figure
                                   tion 3.
                                        in Relative
                                            2006.   development
                                                   Of  course,  of passenger
                                                               past  patterns volume
                                                                                might  and aircraft
                                                                                         not        movements
                                                                                              necessarily      at airports
                                                                                                            translate  intoin the
                                                                                                                              future  patterns
                                     London area between 2006 and 2019 (2006 = 100) [38], [own illustration].
                                 London
                                   so morearearesearch
                                               between 2006 and 2019
                                                        on this topic(2006 = 100) [38], [own illustration].
                                                                       is needed.
                                        While there is currently no shift of traffic from constrained to unconstrained airports
                                  in the model, new nonstop routes are included if they become viable in terms of aircraft
                                  size, flight frequency, and load factors. However, we only consider this in terms of OD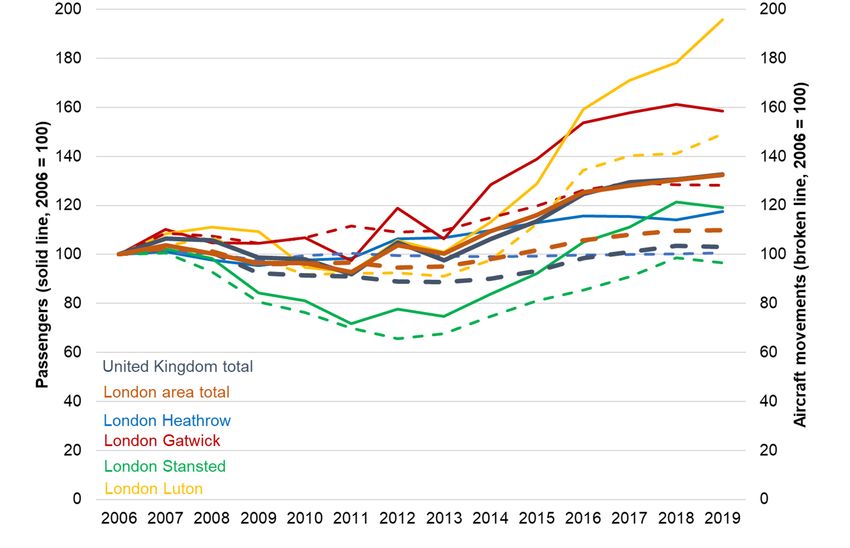
Aerospace 2021, 8, 300                                                                                                                      7 of 18

                                                       While there is currently no shift of traffic from constrained to unconstrained airports
                                                 in the model, new nonstop routes are included if they become viable in terms of aircraft
                                                 size, flight frequency, and load factors. However, we only consider this in terms of OD
                                                 passenger demand, for instance, if a new route opens, assuming this demand can be viably
                                                 served by a nonstop flight. We do not consider airline strategies actively promoting nonstop
                                                 connections, which means our estimate might be a little low. However, while there has
                                                 been a trend towards more nonstop flights for some time, air traffic still remains highly
                                                 concentrated on a small number of airports, and this has not changed over time. Indeed, in
                                                 some developing regions like the Middle East, Southwest Pacific, or Asia, concentration
                                                 is still increasing—even in North America which is a highly developed region. Less than
                                                 5% of airports handle 50% of the traffic and approximately 25% of airports handle 90% of
                                                 the traffic [17]. In Europe, low-cost carriers like Ryanair originally took off from secondary
                                                 airports like Frankfurt Hahn (HHN) and Weeze (NRN) but now gravitate towards larger
                                                 airports and even hub airports such as Frankfurt/Main. Furthermore, the traffic decline
                                                 caused by the COVID-19 pandemic released attractive slots at major and hub airports,
                                                 increasing the pressure on the viability of secondary and regional airports. Consequently, a
                                                 more decentralised air traffic network might be farther away than ever.
                                                       In summary, shifting traffic to neighbour airports to mitigate congestion and providing
                                                 nonstop rather than stopover flights are two topics which are closely interrelated. However,
                                                 given past and current trends, we are less optimistic about their potential to mitigate
                                                 capacity constraints on a global level, although they might be helpful at particular airports.
                                                 Nevertheless, more research is needed to shed more light on these topics.
                                                       Figure 4 displays the relationship between passenger demand volume, airport capacity,
                                                 and aircraft size on a very general level: to serve a particular passenger demand, we need
                                                 a minimum airport capacity and average aircraft size. Both aircraft size and airport
                                                 capacity limit the maximum number of passengers that can be handled. Here, aircraft
                                                 size and airport capacity can substitute each other to some degree: if airport size is not
                                                 sufficient to serve a given passenger demand given a particular aircraft size, increasing
                                                 it can compensate for the lack of airport capacity, at least within limits, although for
pace 2021, 8, x FOR PEER REVIEW                                                                                        8 of 20
                                                 simplification we neglect the influence of aircraft mix on airport capacity. The same applies
                                                 for airport capacity. A lack in aircraft size can be substituted by increases in airport capacity
                                                 so that more flights, but with fewer passengers per aircraft on average, can be handled.
                              that more flights, but with fewer passengers per aircraft on average, can be handled. How-
                                                 However, airport capacity is typically the bottleneck, as an enlargement of airport capacity,
                              ever, airport capacity is typically the bottleneck, as an enlargement of airport capacity, in
                                                 in particular
                              particular the runway              the runway
                                                       system, takes            system,
                                                                       a long time  or is takes a long time
                                                                                          even impossible   or to
                                                                                                          due   is opposition
                                                                                                                   even impossible due to opposition
                                                 from the nearby
                              from the nearby population,             population,
                                                              especially             especiallycountries.
                                                                          in highly developed    in highlyPopular
                                                                                                           developed     countries. Popular examples
                                                                                                                    examples
                              of this are LondonofHeathrow
                                                    this are London      Heathrow [39] [40].
                                                               [39] and Frankfurt/Main     and Frankfurt/Main [40].

                                                                   Capacity needs

                                                                     Substitution
                                                                       potential

                                                Figure
                            Figure 4. Relationship     4. Relationship
                                                   between             between
                                                           passenger demand,   passenger
                                                                             airport      demand,
                                                                                     capacity,       airport
                                                                                               and aircraft   capacity,
                                                                                                            size        and aircraft size [own illustration].
                                                                                                                 [own illustra-
                            tion].

                                 The bottom line is that if we account for these interrelations between passenger de-
                            mand, airport capacity, and aircraft size, we will see adjustments to all three elements in
                            a constrained forecast compared to an unconstrained forecast: there will be some degree
                            of unaccommodated passenger demand, stronger growth of average aircraft size, and less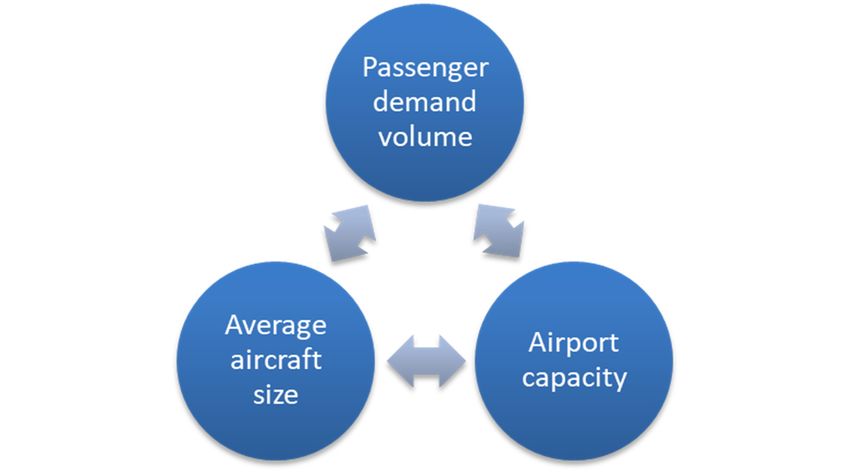
Aerospace 2021, 8, 300                                                                                                         8 of 18

                                          The bottom line is that if we account for these interrelations between passenger
                                     demand, airport capacity, and aircraft size, we will see adjustments to all three elements in
                                     a constrained forecast compared to an unconstrained forecast: there will be some degree
                                     of unaccommodated passenger demand, stronger growth of average aircraft size, and
                                     less airport capacity available in the future. An unconstrained forecast always assumes
                                     the best case regarding the development of airport capacity, which means that potential
                                     bottlenecks are neglected. However, this is not realistic, as evidenced in the example of
                                     London Heathrow.
                                          The model generally targets the long-term development of air transport, i.e., a period
                                     of about 10 years and more. Therefore, we do not account for short- and medium-term
                                     fluctuations. Figure 5 illustrates the long-term development of global air transport in the
Aerospace 2021, 8, x FOR PEER REVIEW light of a periodic major crisis, which seem to happen around every 10 years. Following
                                                                                                                         9 of 20
                                     previous crises, global air transport development returned to the original growth path
                                     within a few months or years; the exception being the COVID-19 crisis, which is not
                                     yet over.

                                   Figure 5. Development of global air traffic since 1950 [41], [own illustration].

                                         The short-term
                               Figure 5. Development     breakdown
                                                      of global         of global
                                                                air traffic        air transport
                                                                            since 1950            caused by the COVID-19 pandemic
                                                                                       [41], [own illustration].
                                   has been unprecedented in its extent compared to previous crises (see Figure 5). The
                                   magnitude    and length
                                     The short-term          of the of
                                                     breakdown      downturn
                                                                       global airmay   lead tocaused
                                                                                   transport   adaptions   in passenger
                                                                                                       by the COVID-19behaviour
                                                                                                                           pandemicthat
                                   outlast  the COVID-19      pandemic.    In particular,   the increased   use of  telecommunication
                               has been unprecedented in its extent compared to previous crises (see Figure 5). The mag-
                                   technologies
                               nitude            may
                                        and length  of lead  to a reduced
                                                        the downturn     maydemand
                                                                                lead toforadaptions
                                                                                           business trips.  There arebehaviour
                                                                                                     in passenger      no exact numbers
                                                                                                                                 that
                                   on  actual business  trips  worldwide,   although    there are surveys  covering
                               outlast the COVID-19 pandemic. In particular, the increased use of telecommunication   particular markets
                                   such as Germany
                               technologies   may lead and     the UK. demand
                                                         to a reduced   Mason [42]      estimates
                                                                                  for business     thatThere
                                                                                                trips.  the market    for business
                                                                                                              are no exact  numbers trips
                                   constitutes  approximately      30%  of  the  total passenger    market.   He  forecast
                               on actual business trips worldwide, although there are surveys covering particular mar-      the business
                                   trip market worldwide to be between 55% (low scenario) and 86% (high scenario) of the
                               kets such as Germany and the UK. Mason [42] estimates that the market for business trips
                                   pre-COVID-19 forecast in 2039. The central forecast is 77%.
                               constitutes approximately 30% of the total passenger market. He forecast the business trip
                                         Figure 6 displays the development of total seat capacity by region relative to 2019 levels.
                               market worldwide to be between 55% (low scenario) and 86% (high scenario) of the pre-
                                   This shows that North America is close to −20%. Africa, Europe and South America are
                               COVID-19 forecast in 2039. The central forecast is 77%.
                                   also recovering and have reached levels approximately 30–40% lower than corresponding
                                     Figure 6 displays the development of total seat capacity by region relative to 2019
                                   2019 values. The Middle East and Asia lag behind, while the Southwest Pacific has fallen
                               levels. This shows that North America is close to −20%. Africa, Europe and South America
                                   to around −60%, probably due to the reoccurrence of COVID-19. In this paper, we do not
                               are also recovering and have reached levels approximately 30-40% lower than corre-
                                   present a forecast of the short- to medium-term development of global air traffic in the
                               sponding 2019 values. The Middle East and Asia lag behind, while the Southwest Pacific
                                   light of COVID-19 but take a long-term view of the year 2040 without explicitly forecasting
                               has fallen to around −60%, probably due to the reoccurrence of COVID-19. In this paper,
                                   the road taken to get there.
                               we do not present a forecast of the short- to medium-term development of global air traffic
                               in the light of COVID-19 but take a long-term view of the year 2040 without explicitly
                               forecasting the road taken to get there.
Aerospace2021,
Aerospace 2021,8,8,x 300
FOR PEER REVIEW 9 of2018
10 of
Developmentofoftotal
Figure6.6.Development
Figure totalseat
seatcapacity
capacitybybyregion
regionbetween
betweenJan
Jan2020and
andAug
Aug2121relative
relativetoto2019
2019
levels [38], [own illustration].
levels [38], [own illustration].
4. Forecast Scenario Results and Strategic Implications
4. Forecast Scenario Results and Strategic Implications
Airport-specific recommendations regarding the enlargement of capacity can be de-
ducedAirport-specific
only from anrecommendations
analysis of the future regarding
capacitythe needs
enlargement
of that of capacity
airport. can be de-
However, the
duced
factor driving the employment of larger aircraft falls within the strategic planning ofthe
only from an analysis of the future capacity needs of that airport. However, air-
factor
lines driving
and thisthe employment
measure affects theof larger
capacity aircraft
needsfalls within the
of airports, strategic
which have planning
limited means of air-to
lines and this
interfere with measure affects the
and influence thiscapacity
process.needs of airports,
The capacity whichof
planning have limited
airports means to
concentrates
interfere with and influence this process. The capacity planning
more on the investment option of enlarging infrastructure capacity. Given that both system of airports concentrates
more on the investment
partners—airlines option of enlarging
and airports—affect infrastructure
the future capacity capacity. Given that
needs of airports, bothcan
a case sys-be
tem partners—airlines and airports—affect the future capacity
made for a combined airport-specific, as well as a general capacity planning strategy. needs of airports, a case
can beBefore
made considering
for a combined airport-specific,
general recommendations, as well weas afirst
general
discusscapacity planning
the different strat-of
effects
egy.
the two optional types of mitigation, aircraft size and the runway measure, on capacity
gain.Before
The considering
capacity gained generalby recommendations,
adding new runways we first discussinthe
decreases line different
with the effects
number of
the two optional types of mitigation, aircraft size and the runway
of existing runways, because operations on different runways interfere with each other. measure, on capacity
gain.
ThisThe capacity gained
is especially true in bytheadding
case ofnew runways
dependent decreases
runway in linewhile
systems, with the number
we can assume of
existing runways, because operations on different runways
that moving from a single runway to two or maybe three independent runways, such as interfere with each other. This
isthose
especially true Capital
at Beijing in the case
Cityof(PEK),
dependent runwaydoubles
respectively systems, or while
tripleswe can assume
capacity. If wethatnow
moving
consider from
the aprobability
single runway to two aornew
of realising maybe threewhich
runway, independent
might berunways,
below 100% suchbecause
as thoseof
atopposition
Beijing Capitalfrom City (PEK), population,
the nearby respectivelythe doubles
expectedor triples
capacitycapacity.
gains If arewe nowlower.
even considerAs a
the probability
result, adding of realising
runways cana be
new runway, which
a powerful measure might be below 100%
for mitigating because
congestion, of oppo-at
especially
sition
smallerfrom the nearby
airports. population,
However, once athe expected
particular capacity gainsthreshold
airport-specific are even has lower.
beenAsreached,
a result,it
becomes
adding less effective
runways can be because
a powerfulof low measure
expected for marginal capacity
mitigating gains.
congestion, especially at
smaller It airports.
is important to noteonce
However, that there is a constant
a particular linear relationship
airport-specific thresholdbetweenhas been aircraft
reached, size
itand passenger
becomes capacity:because
less effective if we double
of lowthe numbermarginal
expected of passengers
capacity pergains.
flight, for example by
increasing seat capacity
It is important to noteper flight
that there and/or higher load
is a constant linearfactors, we have
relationship twice the
between passenger
aircraft size
capacity per flight. Thus, the throughput of a runway increases
and passenger capacity: if we double the number of passengers per flight, for example by in terms of passengers
carried per
increasing seathour without
capacity perthe need
flight to increase
and/or runway
higher load capacity.
factors, we have Nevertheless, changing
twice the passenger
the fleet mix at an airport affects separation minima, a factor
capacity per flight. Thus, the throughput of a runway increases in terms of passengers we do not consider. Optimal
sequencing
carried per hour of aircraft
without is an
theoption
need to to increase
reduce separation minima Nevertheless,
runway capacity. and is practiced at many
changing
congested
the fleet mixairports. Furthermore,
at an airport increasingminima,
affects separation aircraft size in our
a factor wemodel
do not is consider.
not simplyOptimal
a case of
adding a few very large aircraft to replace a number of very small
sequencing of aircraft is an option to reduce separation minima and is practiced at many jets, as aircraft size grows
across the whole fleet, not just at the top end. Finally, there is
congested airports. Furthermore, increasing aircraft size in our model is not simply a case typically a short-term and
long-term maximum viable aircraft size, which cannot be exceeded
of adding a few very large aircraft to replace a number of very small jets, as aircraft size in a given time frame;Aerospace 2021, 8, 300 10 of 18
for example, due to fleet retirement plans. This also dampens the increase of separation
minima, as the aircraft at the lower end catch up. For instance, some light aircraft are
replaced by medium aircraft and some medium aircraft are replaced by large aircraft, but
at some point large aircraft cannot grow any more. This is of course a simplified view
and it is important to keep track of this to avoid overestimating the gains from increasing
aircraft size.
For this paper, we defined two scenarios:
• In the low scenario (LS), we assume that by 2040, future air transport development is
delayed by about five years, i.e., that pre-crisis levels of the year 2019 will be reached
once again in 2024. Thus, the COVID-19 pandemic has had a permanent effect on air
traffic development.
• In the high scenario (HS), we assume that the COVID-19 pandemic will be fully
overcome by 2040, i.e., air transport is once again on its original growth path, which
was forecast in or before 2019. In this case, the COVID-19 effect will be levelled out in
the long term.
These two scenarios were chosen based on current views reflected in the literature
(see Section 2), thus the low and high scenarios cover a realistic spectrum of possible
recovery developments that seem to have a higher probability of being realised, while
excluding overly pessimistic views on future air traffic development scenarios that seem to
be rather unlikely.
Table 1 presents the global forecast results for 2040 for the two scenarios. Despite the
COVID-19 pandemic and the delay of five years in air transport development, passenger
and revenue passenger kilometres (RPK) volume is forecast to increase by 84% in the
low scenario until 2040 compared to 2018. The average growth rate in the low scenario
between 2018 and 2040 is 2.8% (compound annual growth rate, CAGR). In the high scenario,
passenger and RPK volume increase by 114% until 2040, resulting in a CAGR of 3.5%.
The same growth rates for passenger and RPK volume are a result of the air transport
network not changing substantially. The number of flights increases to 49.4 million in
the low scenario (CAGR of 1.1%) and 52.7 million in the high scenario (CAGR of 1.4%),
which is an increase of between 27% and 36%. The number of passengers per flight rises to
164 (CAGR of 1.7%) and 179 (CAGR of 2.1%), respectively, indicating increasing aircraft
size contributes slightly more to handling the additional passenger volume than better
utilisation of existing runways and adding new runways. This is a result of the rather high
utilisation of large airports and the difficult realisation of new runways or even airports.
One exception is the new Beijing Daxing (PKX) airport in China, which opened in 2019
and has resulted in big capacity gain for the Beijing region. In the high scenario, there
are 24 airports that cannot be enlarged sufficiently until 2040, while this number reduces
to 12 in the low scenario because of the lower level of demand. These are all large hub
airports such as Mumbai (BOM), New Delhi (DEL) and even Beijing Daxing (PKX) as well
as Capital City (PEK) in Asia, Atlanta (ATL), Newark (EWR) and LaGuardia (LGA) in
the US, and London Heathrow (LHR) in Europe. Unaccommodated passenger volume
in 2040 is estimated to reach 119 million passengers in the low scenario and 256 million
in the high scenario. This is the point where the COVID-19 crisis has the biggest impact.
High levels of unaccommodated passenger demand are more of a long-term problem, and
a setback of about five years in air traffic development has a significant effect. However,
unaccommodated demand is distributed extremely unevenly among airports, such that it
plays an important role for particular airports in 2040 and earlier.
We can compare our forecast results with those of Boeing [2] and IATA [43]. Currently,
Airbus does not offer an updated post-COVID-19 forecast. Before the pandemic, Boeing
forecast that the RPK volume would rise by 4.6% per year on average between 2019
and 2039, while they lowered their forecast to a growth rate of 4.0% after the pandemic.
The Boeing forecasts are significantly higher in terms of growth rates than DLR, but the
difference between pre- and post-COVID-19 is almost identical, i.e., between 0.6 and
0.7 percentage points per year. The IATA forecast has three different scenarios, withAerospace 2021, 8, 300 11 of 18
the “Down” scenario being similar to our low scenario and the “Up” and “Baseline”
scenarios comparable to our high scenario. The IATA forecast spans a slightly broader
spectrum of possible future developments compared to the DLR approach, but the results
are very similar.
Table 1. Global forecast results for 2040 for the low and high scenario (compound annual growth
rates in brackets).
DLR 2040 Low Scenario 2040 High Scenario
Passenger volume (billion) 8.1 (2.8% p.a.) 9.4 (3.5% p.a.)
RPK (billion) 14,578.2 (2.8% p.a.) 16,876.1 (3.5% p.a.)
Unaccommodated
119.1 255.5
passenger volume (million)
Total unconstrained
8.2 9.7
passenger volume (billion)
Flight volume (million) 49.4 (1.1% p.a.) 52.7 (1.4% p.a.)
Passengers per flight
164 (1.7% p.a.) 179 (2.1% p.a.)
("aircraft size")
Number of airports that
12 24
remain constrained
Boeing CMO Boeing CMO
Boeing
2021-2040 2019-2038
RPK (billion) 19,283.1 (4.0% p.a.) 19,941.3 (4.6% p.a.)
IATA IATA Down 2040 IATA Up 2040 IATA Baseline 2040
Passenger volume (billion) 7.8 (2.6% p.a.) 11.7 (4.5% p.a.) 10.7 (4.1% p.a.)
Regarding the impact of COVID-19 on business travel, we refer to the aforemen-
tioned study of Mason [42]. According to his forecast, there will be between 14% and 45%
(central: 23%) fewer business trips until 2039 compared to pre-COVID-19 forecasts. Com-
bined with a share of business trips of approximately 30% of all air passengers, this means
between 4% and 14% (central: 7%) fewer air travellers until 2039, resulting in a reduction
of passenger CAGR by about 0.2 and 0.7 percentage points (central: 0.3 percentage points).
In the worst case, this can transform our high scenario into a low scenario. However, in
the case of the central and high forecasts, the effects are rather limited. Nevertheless, these
results should be treated with some caution: there might be a degree of double-counting in
our low scenario because we have already assumed a recovery delay in the passenger air
transport market by five years. However, it is not possible to break these numbers down by
region or even airport pair because of a lack of global survey data. Therefore, this is only a
rough estimate that cannot be integrated into the model because of a lack of geographical
resolution. Consequently, we cannot compute the corresponding numbers for Table 1, but
can give an estimate for the passenger volume CAGR.
Figure 7 displays the distribution of airports with respect to the number of annual
aircraft movements and passengers per flight. Each point represents aircraft movements
and average aircraft size data for a specific airport for the years 2018, 2040 low scenario,
and 2040 high scenario. The distribution of airports indicates that the vast majority of
airports are in the low range in terms of flight volume, which denotes relatively small
volumes of around 200,000 movements per year over the entire range of average aircraft
sizes to around 400 passengers per flight. A small number of airports will, in future years,
reach volumes of up to one million movements with aircraft sizes ranging between 120
and 250 passengers per flight.volumes of around 200,000 movements per year over the entire range of average aircraft
sizes to around 400 passengers per flight. A small number of airports will, in future years,
Aerospace 2021, 8, 300 12 of 18
reach volumes of up to one million movements with aircraft sizes ranging between 120
and 250 passengers per flight.
Figure 7. Global classification of airports according to mitigation strategies and their share of global
Figure 7. Global classification of airports according to mitigation strategies and their share of global
aircraftmovements
aircraft movements forfor the
theyears
years2018, 2040
2018, lowlow
2040 scenario (LS),(LS),
scenario and 2040
and high
2040 scenario (LS) (in(LS)
high scenario brackets:
(in
airports’airports’
brackets: share of global
share passenger
of global volume),
passenger2018 data are
volume), taken
2018 datafrom
areSabre Market
taken from Intelligence
Sabre Market[36]
(own illustration
Intelligence and
[36, own forecast). and forecast].
illustration
Thediagram
The diagramisisdivided
dividedinto intofour
fourquadrants,
quadrants,separated
separatedby bya ahorizontal
horizontalline
lineatata avalue
value
of 200,000 aircraft movements and a vertical line at 114 passengers
of 200,000 aircraft movements and a vertical line at 114 passengers per flight. The volume per flight. The volume
dividingline
dividing linewaswasselected
selectedasasthe thepractical
practicalannual
annualservice
servicevolume
volumeofofa asingle
singlerunway.
runway.
Although the capacity of a runway may be higher, perhaps
Although the capacity of a runway may be higher, perhaps around 240,000 movements, around 240,000 movements,
thelimit
the limitof of 200,000
200,000 corresponds
corresponds to atoservice
a service volume
volume thatbe
that can can be handled
handled with awith
highalevel
high
of service. The vertical line represents the average aircraft size of 114 passengers in 2018.in
level of service. The vertical line represents the average aircraft size of 114 passengers
2018. Airports
Airports in theseinquadrants
these quadrants are characterised
are characterised by certain
by certain flight volume
flight volume and aircraft
and aircraft size
ranges. Those with small flight volumes and aircraft are included in quadrant I.quadrant
size ranges. Those with small flight volumes and aircraft are included in Airports I.
Airports with small traffic volumes but with higher numbers of passengers per flight are in
with small traffic volumes but with higher numbers of passengers per flight are in
quadrant II, while airports with greater flight volumes as well as aircraft size are located in
quadrant II, while airports with greater flight volumes as well as aircraft size are located
quadrant III. Finally, airports with high volumes and rather small aircraft are in quadrant
in quadrant III. Finally, airports with high volumes and rather small aircraft are in
IV. General mitigation strategies vary in accordance with the volume and aircraft size
quadrant IV. General mitigation strategies vary in accordance with the volume and
of airports.
aircraft size of airports.
Although airports in quadrant I handled approximately 22% of global passenger
Although airports in quadrant I handled approximately 22% of global passenger
demand and 32% of the flight volume in 2018, their relative importance will decline in
demand and 32% of the flight volume in 2018, their relative importance will decline in line
line with the growth of traffic in the future, even if traffic development is delayed by a
with the growth of traffic in the future, even if traffic development is delayed by a few
few years because of the COVID-19 pandemic. Depending on the future development
years because of the COVID-19 pandemic. Depending on the future development of air
of air traffic, airports that remain in this category will handle only about 4% in the high
traffic, airports that remain in this category will handle only about 4% in the high scenario
scenario and 7% in the low scenario of passenger demand and 10% and 15%, respectively,
and 7%traffic.
of the in the Constrained
low scenarioairports
of passenger demand
in quadrant and
I will 10%
take and
full 15%, respectively,
advantage of the
of both mitigation
traffic. Constrained airports in quadrant I will take full advantage
types—increasing aircraft size as well as runway capacity—provided they have the choice of both mitigation
types—increasing
of realising these aircraft
options.size as well as runway capacity—provided they have the choice
of realising these
Airports in options.
quadrant II will grow in importance: their traffic share will rise from 27%
in 2018 to 34%quadrant
Airports in II will grow
in both scenarios for in importance:
2040, their
while their traffic share
passenger will rise
volume sharefromwill27%
rise
infrom
201831%
to 34% in both scenarios for 2040, while their passenger volume
in 2018 to 35% in the high scenario and 36% in the low scenario. These airports share will rise
from
will 31% in 2018
primarily to 35%
benefit in the
from high scenario
enlarging runwayand 36% inIfthe
capacity. low
flight scenario. on
operations These
eachairports
runway
can be managed independently, a new runway will double the capacity of single runway
airports, which represent a common capacity class in quadrant II. Increasing aircraft size is
therefore a secondary option, especially for those airports with average aircraft sizes in the
range of 120–200 passengers per flight.Aerospace 2021, 8, 300 13 of 18
Airports with higher traffic volumes and larger average aircraft size are more likely
to be those with capacity problems. Airports in quadrant III constitute this category and
require mitigation strategies more than airports in other quadrants. In 2018, airports in this
category handled 29% of the traffic, which until 2040 will rise to 50% in the low scenario and
55% in the high scenario. The passenger volume share will also increase accordingly from
37% in 2018 to 56% in the low scenario and 60% in the high scenario. This group of airports
will thus become the most important. In 2018, most of the airports handled aircraft ranging
between 120 and 230 passengers per flight in size; hence a gradual increase in aircraft
size might be the most beneficial strategy for coping with capacity shortages. However,
there is one caveat: the forecast made by the model regarding aircraft size is based upon
past developments and the constraints situation at airports, not the future availability or
actual sales of bigger aircraft. Aircraft size in the model increases as long as it is viable and
necessary in the light of limited airport capacity. Therefore, the model might overestimate
the positive capacity effects of increasing aircraft size because of limited aircraft availability
in the future. This means the constraints situation can be even worse and ultimately air
traffic growth delayed. For airports with traffic volumes of below around 400 thousand
movements per year, investment in a new runway may also be an option, especially if their
average aircraft size already exceeds around 230 passengers per flight. For airports with
extremely high volumes of traffic, new runways provide relatively small additional value.
A better solution may be to open a new airport in the same agglomeration, as is the case in
Beijing. In such cases, full capacity gain may be realised by the additional runway system.
The airports in quadrant IV handle high traffic volumes with smaller sized aircraft
containing fewer than 114 passengers per flight. There are relatively few airports of this
type and, as can be seen in Figure 7, their traffic share was extremely small in 2018 and
will diminish in the future in both scenarios. Their first mitigation strategy should be to
handle a greater number of large aircraft, thereby increasing the passenger throughput
per runway without raising the flight volume. However, because airports of this type will
be negligible in future, such mitigation strategies will not contribute to solving the global
capacity problem.
As we have demonstrated, airports with high traffic volumes, as well as aircraft with
a large number of passengers on board (in quadrant III), are the most important group
(as measured by their share of the global traffic) and also the most problematic as they
have the highest share of airports with a heavily utilised infrastructure and at least partly
severe capacity constraints. Solutions for mitigating the capacity problem vary from airport
to airport. As a general strategy, we propose a further increase in aircraft size and new
runway capacity for airports with a small number of runways along with new capacity
in the form of a new airport for existing airports with a complex runway system. We
note, however, that these proposed strategies may be impossible to realise due to local and
political constraints.
The second most important group consists of airports with traffic volumes below
200,000 annual aircraft movements and aircraft exceeding 114 passengers per flight in
size (in quadrant II). The general mitigation strategy would comprise an investment
in additional runway capacity and, for airports with relatively small aircraft of up to
200 passengers per flight, an increased number of flights with greater passenger capacity.
However, once again, new runways may be not a feasible solution in many instances
for airport-specific reasons, which means airports will have to rely on non-investment
solutions such as a growth in average aircraft size.
Before we turn to more airport-specific analyses, we shed light on the distance distri-
bution of the flights in the two scenarios. In both cases, approximately 44% of passengers
fly less than 1000 km on a single flight, while around 17% of passengers fly less than 500 km.
However, we need to remember that passengers might take stopover flights, especially for
longer journeys. If we look at particular regions, for example Asia, these values increase
to around 51% for flights up to 1000 km and 18% for flights up to 500 km. Other large
continental markets like Europe and North America are within this range.You can also read