Practical application of non-destructive test methods at a single-shell tunnel lining
←
→
Page content transcription
If your browser does not render page correctly, please read the page content below
NDT.net - The e-Journal of Nondestructive Testing (December 2008)
           For more papers of this publication click: www.ndt.net/search/docs.php3?MainSource=25

 Practical application of non-destructive test methods at a
                  single-shell tunnel lining
                                         FRANK LEHMANN

                         Materialprüfungsanstalt Universität Stuttgart
                        Pfaffenwaldring 4, D-70569 Stuttgart, Germany
                              frank.lehmann@mpa.uni-stuttgart.de

Abstract
Non-destructive test methods are often used in tunnel construction to check the required lining
thicknesses. Hereby, mostly ground penetrating radar, impact-echo and ultrasonic echo are
applied. However, the current knowledge and experience is largely limited to testing the
concrete thickness of double-shell tunnels. Problems with the application of non-destructive
test methods can arise, when definitive interfaces are not present, cracks or honeycombing
influence the results or the lining is soaked with water.
    As a sophisticated case, a 2550m section of a power tunnel concrete liner in Nepal was
inspected with non-destructive test methods. The specific feature of the power tunnel were its
challenging boundary conditions: constructed as single-shell tunnel, layer identification was
complex; a synthetic foil for sealing, which usually acts as impedance contrast between grout
and sprayed concrete, did not exist; the lining was not cast with watertight concrete and was
therefore accordingly wet.
The current limits of non-destructive testing applied at tunnel linings were explored and
evaluated in the project. In the paper, the non-destructive investigation and its case specific
problems are described. An emphasis is put on the Impact-Echo method, as it was mainly
used. A detailed account is given on the following aspects: selection of the most appropriate
test methods and testing procedures, considering the above mentioned preconditions; analysis
and interpretation of the acquired data; evaluation of the applicability and limits of the used
test methods.

1. Project Overview
In May of 2007, the Materialprüfungsanstalt Universität Stuttgart (MPA) was called to a
hydroelectric power project in Nepal. The project’s headrace tunnel concrete liner had
experienced several problems during construction and showed profound damage patterns on
its surface. Being uncertain about the structural integrity of the tunnel, the project managers
decided to undertake an investigation to find out the severity of the damage.
    The excavation of the 5230m long headrace tunnel was accomplished by drill and blast
method at 6.4 m diameter. It was designed as single-shell construction. Hereby, ‘single-shell’
describes a tunnel where the outer shell (sprayed concrete) acts in bond with the inner shell
(sprayed or poured concrete). Unlike, a double-shell tunnel holds a geomembrane and a
synthetic foil between the two shells. This is the by far mostly used construction method,
simply because of the demand for a ‘dry’ tunnel.

                                                  1
7th fib PhD Symposium in Stuttgart, Germany                                      September 11 – 13, 2008

                                Figure 1: Headrace tunnel cross-section
During the construction, basically two different concreting methods came into operation. On
the first 2000m, the advancing-slope method1 was used. Due to visible defects, the method
was changed to concreting with full stop ends. In a first step undertaken by the MPA
Stuttgart, the different types of visual flaws and structural defects were recorded. Listed below
is a choice of the sighted defects:
     Cracks in longitudinal and radial direction, as well as shear cracks and cracks diagonally
     over several metres. Crack widths of up to 3mm were measured.
     Calcium carbonate efflorescence and rock water emission both at cracks and locally
     direct through the lining. Calcium carbonate deposits in form of stalactites and leak
     marks on the liner surface.
     Minor thicknesses, revealed through structural failure during the grouting process. A
     broken off piece of the concrete lining held a thickness of 10cm, falling short of the
     design by 30cm.
     Insufficient concrete cover as little as 5mm in some reinforced sections.

2. Non-destructive testing techniques
2.1 Impact-Echo (IE)
The idea of the Impact - Echo method is to send an acoustic signal into the test specimen and
record the reflection from internal flaws, material layers or other interfaces. By analysing the
reflected signal, conclusions about the depth of the reflecting surface can be drawn (Figure 2).
    The acoustic signal is commonly produced by the mechanical impact of a steel sphere,
mounted on a spring-steel rod, the impactor. When the so produced elastic stress wave travels
through the specimen and encounters an interface, part of the wave energy is reflected.
Multiple reflections between the interfaces excite local modes of vibration, corresponding to
the depth’s resonant frequency. On the surface, the displacement is recorded by a sensor and
transmitted to a computer. Transforming the obtained voltage versus time signal into the
frequency domain leads to a plot of amplitude versus frequency.

1 Sometimes referred to as ‘continuous concreting’ or ‘telescopic concreting’.
                                                       2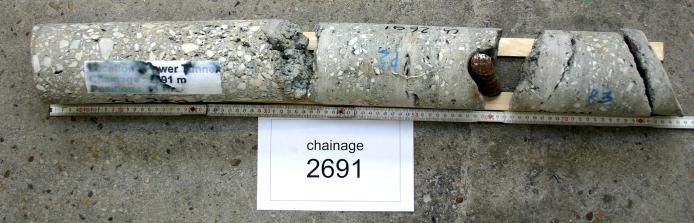
7th fib PhD Symposium in Stuttgart, Germany                            September 11 – 13, 2008

                            Figure 2: Impact Echo method scheme
The most prominent peaks correspond to the resonant frequencies of the space between the
surface and the interface. The depth dr can then be calculated as
                                             vP
                                     dr                                                       (1)
                                             2 fr
dr     [m]            depth to the interface
vP     [m/s]          speed of the compression wave
fr     [Hz]           recorded resonant frequency
β      [-]            shape factor, β=0.96 for a solid plate

The characteristics of the generated stress waves in terms of wavelength or frequency
determine the signal’s ability to find interfaces in, and propagate through the structure.
Generally it can be said, that the shorter the wavelength of the signal, the higher the
resolution, but the lower the penetration depth. A measurement accuracy of ±4% relating to
measurement depth can be achieved. However, this is strongly dependent on the concrete
quality.
    A prerequisite is that a material boundary with certain extends and an adequate difference
in acoustic impedance exists. For concrete, experiments have shown, that the minimum lateral
size of flaws that can be detected is about one wavelength of the induced signal and at least
1/4 of its depth. Furthermore, resonant frequencies can only develop, if the distance between
the two interfaces is greater than half the frequency’s wavelength. The minimum crack
opening perpendicular to the surface for use of the Impact-Echo method is 0.08mm 1. It is not
possible to determine the type and thickness of a void.
    The demand for a high difference in acoustic impedance at material boundaries is satisfied
most of the time. For basic tasks, like finding air or water filled voids, locating reinforcement
or determining a structure’s depth, the reflection coefficient is very high. It gets more
complicated, when concrete-concrete, concrete-grouting or concrete-rock interfaces with good
bond have to be found.
2.2 Ground Penetrating Radar (GPR)
Radar as commonly used in non-destructive testing is an electromagnetic wave in the
frequency domain from 0.5 to 1.7 GHz. Non-destructive testing with GPR exploits the
construction materials different electrical and magnetic properties. Radar reflections from
inside the structure are evoked at sudden changes of the dielectric constant. This can for

                                               3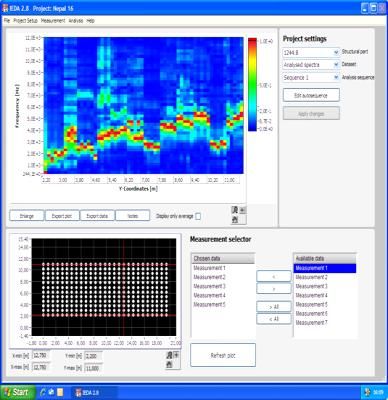
7th fib PhD Symposium in Stuttgart, Germany                            September 11 – 13, 2008

instance be a rebar cast into a structure or the bottom of a concrete slab. The distance from the
sender to the reflecting surface is calculated as
                                           c0 t
                                      d                                                       (2)
                                          2     r

d      [m]            depth to the interface
c0     [m/s]          speed of light, c0 = 299,792,458 m/s
εr     [-]            dielectric constant

The high dielectrical contrast between concrete and steel (a factor of 106) induces very bright
reflections at such boundaries. Hence, the method is predestined for locating metal
embedments in concrete, like reinforcement bars, prestressing tendons or cables.
    Distinct return signals from metal targets also constitute a major limitation of GPR. It is
not possible to detect anything behind metal, even as thin as aluminium foil. In general, the
penetration depth is governed by the electrical conductivity of the material. A low
conductivity corresponds to a high penetration depth and vice versa. Low contrast boundaries
such as concrete-PVC or concrete-soil (both factor 2) can hardly be seen, concrete-concrete or
concrete-rock interfaces are not visible 2.

3. Measurement procedure and equipment
Impact-Echo is an established method for the determination of tunnel lining thicknesses. In
general, GPR can also be used, if the reinforcement spacing is wide enough. The selection of
the testing method depends on the local premises and can often only be decided on site.
Therefore, in this project, both methods were given a try.
    In compliance with the guideline for the use of non-destructive testing applied at tunnel
linings RI-ZfP-TU 3 and to be able to allocate the measurement points to the tunnel chainage
easily, the grid size was chosen as 75 x 80cm. With the tunnel crown being the most critical
part in the concreting process, it was decided to mainly test that area. The seven recorded
measurement lines parallel to the crown exceed the specifications given in the RI-ZfP-TU by
one line on each side. This was found to be necessary because of the discovered defect
density.

       Figure 3: MPA Stuttgart IE device, IEDA 2.30 software and GSSI GPR system
Overall, a tunnel length of 2550m had to be tested, resulting in 24000 measurement points.
Assuming a time of one minute per point for marking and measuring, the total time needed
was calculated to be 400 hours. This was proven to be quite accurate. The system used for
recording and analysing the signal was IEDA 2.30, self-developed by the MPA Universität
Stuttgart (Figure 3). The Ground Penetrating Radar was acquired from Geophysical Survey
Systems, Inc. (GSSI). Employed was a SIR-3000 control unit with a Model 5100B, 1.6GHz
antenna.
                                             4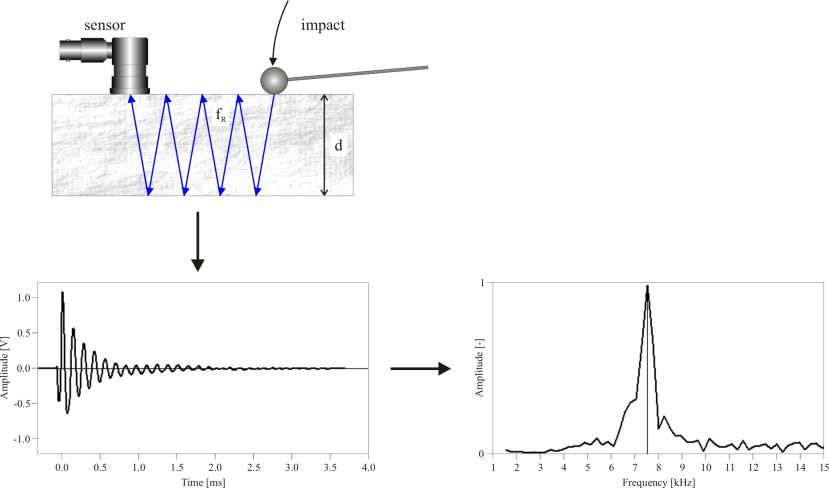
7th fib PhD Symposium in Stuttgart, Germany                             September 11 – 13, 2008

4. Measurement results - analysis and interpretation
4.1 Impact-Echo
4.1.1 Case specific IE limitations
Additional to the general limits stated in 2.1, the case specific problems listed below had to be
dealt with.
    Reflections from vertical cracks, voids, grout- and drainholes can have produced delusive
measurements. Not knowing the source of the sound reflections, they might be wrongly
interpreted as ones from deep layers. The obvious risk is the overestimation of the lining
thickness. The mentioned obstructions were therefore recorded on measurement sheets.
Combing the IE results and the measurement sheets in one graph then made it possible to
directly see potential influences.
    The undulated rock surface as a result of the drill-and-blast method, honeycombing and
the jagged changeovers concrete/grout and grout/sprayed concrete often produced ambiguous
time and FFT signals. Without distinct reflections from layer surfaces, picking the frequency
of the critical depth out of the general signal noise can be very inaccurate. In the analysis, the
emphasis was thus put on the selection of the maximum reflection depth, ensuring the
existence of some material up to the desired lining thickness.
    The undulated layer surfaces, as seen in Figure 4 (left), made it virtually impossible to
directly compare neighbouring measurement points and thus to verify the results on site. It
also prevented a calibration for sound velocity near points with known depth. To solve this
problem, a total of 12 concrete cores over the entire testing length of 2550m were drilled. The
sound velocity was found to be in a range from 3370 m/s to 4190 m/s. This resulted in a depth
accuracy of ±4% from velocity uncertainties only.

         Figure 4: Theoretical and actual lining thickness, different sensor couplings
During the trial measurements it became clear, that coupling the sensor to the concrete surface
would pose certain difficulties. Due to the efflorescence, the surface was very rough in vast
areas, often the concrete was completely covered. The sensor’s 20mm diameter bearing area
contributed to the coupling problem. A small change in location or excitation could have
altered the results (Figure 4, right). Therefore, at least 5 measurements were taken at each
point to be able to identify outliers.

4.1.2 Analysis based on the deepest reflection
Strong fluctuations in the time and FFT signals prevented a fully automated analysis
procedure. It was therefore decided to manually select the deepest reflection from the
structure, as that would imply the presence of at least some material up to the desired lining
thickness of 40cm.

                                                5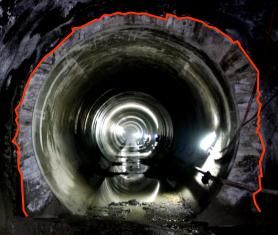
7th fib PhD Symposium in Stuttgart, Germany                            September 11 – 13, 2008

    In general, the FFT signals recorded during the testing can be subdivided into three
categories. This can help to understand the reasons for the defects and also serve as quality
criterion for the tunnel lining.

    case 1: one clear peak        case 2: several clear peaks       case 3: ambiguous peaks

                                   Figure 5: FFT categories
Case 1:
This case was generally associated with a sound structure. It often came along with only a low
amplitude signal (0.2 to 0.8V), although not exclusively.

Case 2:
The originating of several clear peaks can basically have three different reasons:
    A layered system with distinct surfaces. Those could for instance be the known interfaces
    concrete/grouting, grouting/shotcrete or shotcrete/rock.
    A small void, which partly reflects the incoming and diverts the ongoing wave. In a
    standard IE test, this could be verified by comparison with the surrounding points.
    Verification was not possible here.
    Multiple reflections from vertical cracks, grout- or drainholes can also be a reason for
    several clear peaks. This can be cross-checked with the on-site documentation, provided
    that the obstructions were visible on the surface.

Case 3:
A sign for honeycombing inside the structure or a diffusive reflection horizon is a multiple
peak FFT. Not only does honeycombing scatter the p-wave as shown, but also decrease the
frequency of deeper reflections. Diffusive reflections at rough interfaces can deflect the wave
to a point, where the recorded return signal amplitude vanishes behind the noise level. Hence,
a definitive statement about the lining thickness is not possible.
The results had to be interpreted in conformity with the limitations mentioned in 2.1 and
4.1.1. Integrating all these aggravating circumstances in a comprehensive approach to the
result interpretation shows, that the uncertainties are considerably high. In addition, the used
measurement grid implies two more important facts:
     Although the resolution of a single measurement is 225mm, it cannot be guaranteed that
     every flaw that size was located. Voids up to the grid resolution of 80 x 75cm could have
     been missed.
     Each measurement represents one random point in the proximity and can thus differ
     significantly from another point nearby.
Nevertheless, the IE method is useful for determining the structural health of the tunnel.
Given the aspects above, the results have to be seen in a context of flaw density, rather than
absolute position. This leads to a conclusion about a general tendency in each tunnel section.
Considering the possibilities for repair, this is a suitable solution for the specified problems.
    Through the discrete measurement technique, single results become more significant, the
more adjacent points show minor thicknesses. I.e. a single measurement indicating a minor

                                               6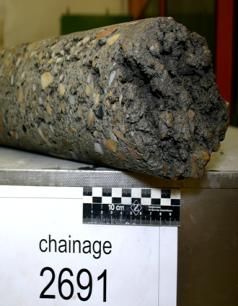
7th fib PhD Symposium in Stuttgart, Germany                             September 11 – 13, 2008

thickness could be an outlier, whereas an area marked as critical area makes a minor thickness
highly probable.
4.2 Ground Penetrating Radar
Several testing runs were performed with the GPR. The in-situ groundwater had soaked the
tunnel lining and thus heavily decreased the penetration depth. In parts, the usable depth range
was well below the aim of 40cm and thus did not have the required reliability to test the
whole tunnel lining. Additionally, concrete-grouting boundaries with little difference in
electrical impedance can hardly be detected. The idea to see the steel fibre reinforced sprayed
concrete also did not prove to be serviceable most sections (Figure 6).
    Much avail on the other hand did the GPR have to identify acoustically detected
delaminations as remains of the concreting pipe (Figure 6-3), as well as for scans in the
reinforced section (Figure 6-2).

                                     Figure 6: GPR outputs
Figure 6-2 is a GPR scan in radial direction. It is clearly visible, that the concrete cover of the
inlaid reinforcement decreases towards the crown. A following open cut confirmed a concrete
cover of only 5mm.

5. Verification of the measurements
With the Impact Echo method being officially accredited to inspect tunnel linings for minor
thicknesses, a very good correlation between measurements and reality was expected. In some
cases this was not explicitly given. Two examples shall be given here.
    Noticeable leakage on the tunnel lining at chainage 2691 called for a concrete core. From
the leakage alone, a badly compacted concrete was expected, which was proven right (Figure
8). However, a close IE examination of the borehole location prior to the drilling did not
reveal any major voids. An interface was expected at around 49cm according to the obtained
FFT (Figure 7).

                                                7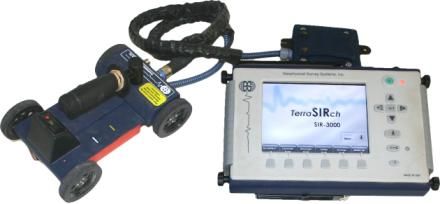
7th fib PhD Symposium in Stuttgart, Germany September 11 – 13, 2008
Figure 7: Core location at chainage 2691, corresponding measurement sheet and FFT from the
centre point
Figure 8: Concrete core from chainage 2691
The drawn concrete core disclosed a void at about 34cm between concrete and sprayed
concrete. An IE measurement assigned the present concrete a wave speed of 3510 m/s, which
would require a peak between 4.8 to 5.2 kHz for the void. The FFT in Figure 7 inherits a
matching peak, but it would have never been picked as ‘critical’. On the measurement sheet
for the area under consideration, the leakage was marked, but the structure was considered
sound with a depth of greater than 40cm.
A plausible explanation for this phenomenon is, that the void was very limited in its lateral
dimensions. The sound had to travel around the flaw to be reflected at 49cm, where close
examination revealed an enclosed grout layer. Going back to the general limitations in 2.1,
two values were given for detectable void sizes. The minimum lateral extensions are the
bigger of 14 times the sphere diameter or 1/4 of the depth. This would be 126mm or 113mm
respectively. With a core diameter of 100mm, it is possible, that the present void was smaller
than the required dimensions.
Other than that, the concrete back surface of core 2691 is heavily fragmented. It does not
form a face, from which the waves can be clearly reflected back to the sensor. They are more
scattered than at the boundary in a depth of 49cm. Additionally, in this special case, two
effects of the IE method interfere with each other. More shallow voids trigger higher resonant
frequencies. However, those high frequencies are more susceptible to absorption and diffusion
than lower ones. In case of a sound overlay this is not critical, whereas in the case at hand
with porous concrete, the high frequencies hardly reach the surface again. This is confirmed
by the low return signal amplitude of 200mV.
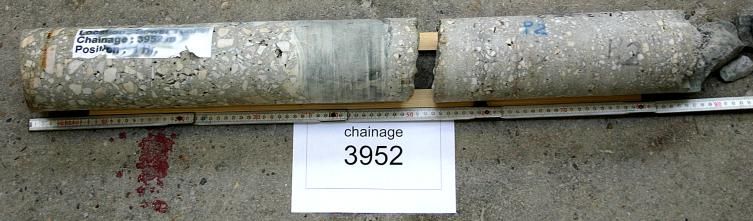
The second example refers to the concrete core from chainage 3952. The case 2 FFT
(Figure 9) pointed towards a layered structure. The location for the core was picked to
calibrate the sound velocity.
8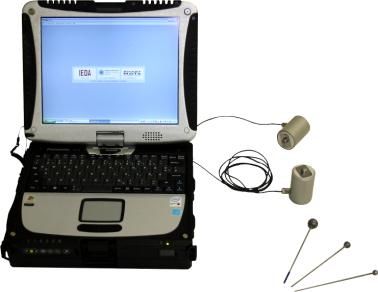
7th fib PhD Symposium in Stuttgart, Germany                            September 11 – 13, 2008

 Figure 9: Concrete core from chainage 3952 (left is inside) and corresponding FFT from the
                                        centre point
A verification of the IE measurements was possible with the drawn core. The FFT peaks are
at 54.2cm and 37.9cm. Compared to the interfaces in the concrete core at 37cm and 52cm
(Figure 9), the results are within the stated accuracy of ±4%. The interface at 48cm is not
visible in the FFT, which is evidence for a good bond between the two layers.

6. Evaluation of the measurement results and the applied NDT
   methods
Primarily the Impact Echo method came into use and delivered the data for analysis and
interpretation. In 4.1.2, the results were generalised to a concept of ‘flaw density’ in contrast
to absolute position statements about the lining thickness. This step was necessary, because a
comparison of the neighbouring results was not possible, which is a major procedure in
scanning IE. However, this might not be satisfying. Especially when compared to successfully
completed IE projects, ‘flaw density’ can not be a desired outcome. Nevertheless, it is a
possibility to draw conclusions about a structure, even though the circumstances are not
trivial.
    A big disadvantage of this concept is the close-to-impossible result verification. Cores
drawn by the employer will seldom resemble the IE results. This problem has already been
experienced with the concrete core described in section 5. The operator therefore has to be
experienced, because result verification is hardly possible. Mitigations were sought after to be
able to use the IE method even under the challenging circumstances (cf. section 4.1.1).
Through the use of a generalised result interpretation, successful non-destructive testing with
Impact Echo was possible.
    Ground Penetrating Radar for lining thickness determination was refrained from at a very
early stage in the testing. The two decisive reasons were the following:
     It was not possible to distinguish the two cases ‘GPR penetration depth is too shallow’
     and ’lining thickness is adequate’.
     The difference in electrical impedance between adjacent layers was not big enough. A
     minimum required void thickness of 6mm was too big to draw conclusions about the
     bond quality.
Ground Penetrating Radar was very useful in areas with reinforcement and to locate buried
concreting pipes. For the determination of the lining thickness, the GPR was not useable due
to the wet concrete and the construction without synthetic foil.

7. Summary and outlook
Within the framework of a water power plant in Nepal, a 5km headrace tunnel was built.
Already during the construction, defects became visible to an extent that gave reason for
concern. The MPA Stuttgart was called to the project to carry out an investigation about the
severity of the damage, using non-destructive testing methods.
                                               9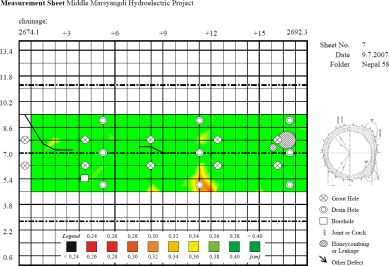
7th fib PhD Symposium in Stuttgart, Germany                             September 11 – 13, 2008

    A visual inspection and review of the documentation presented longitudinal and radial
cracks, severe efflorescence, minor thicknesses and insufficient concrete cover. The non-
destructive testing was carried out using the Impact-Echo method and Ground Penetrating
Radar. Non-trivial surface and structural conditions prevented a standardised approach to the
data analysis and interpretation. It was not possible to definitely state the lining thickness for
every point in the tunnel. A concept of ‘flaw density’ was suggested for the result
interpretation. This gave a comprehensive overview of the tested area and allowed for
successful non-destructive testing.
    Additional to the non-destructive testing, cores were drawn from selected locations. They
were tested both non-destructive with IE for calibration purposes and destructive for
determination of the compressive strength and modulus of elasticity.
    Current research focuses on the field of controlled impact generation. If it was possible to
introduce a standardised amount of energy into the structure, information about defect depth
and type could be won from the reflection amplitude. Yet, this will work only in conjunction
with a controlled sensor contact pressure. Consequently, a new IE device is currently under
development to fulfil these requirements.

References
1.    Sansalone MJ, Streett WB. Impact-Echo, Nondestructive Evaluation of Concrete and
      Masonry, Bullbrier Press, 1997
2.    GSSI Handbook for Radar Inspection of Concrete, Geophysical Survey Systems, Inc.,
      Salem, NH, 8.2006
3.    RI-ZfP-TU, Richtlinie für die Anwendung der zerstörungsfreien Prüfung von
      Tunnelinnenschalen, Bundesanstalt für Straßenwesen (bast), Allgemeines
      Rundschreiben Straßenbau Nr. 14/2001, Reg.-Nr. 05.72

                                               10
You can also read