RAPID ASSESSMENT SURVEY OF COASTAL HABITATS TO HELP PRIORITIZE THE SUITABLE NEW AREAS NEEDING A STATUS OF PROTECTION FOR THE DEVELOPMENT OF A ...
←
→
Page content transcription
If your browser does not render page correctly, please read the page content below

RAPID ASSESSMENT SURVEY OF COASTAL HABITATS TO
HELP PRIORITIZE THE SUITABLE NEW AREAS NEEDING A
STATUS OF PROTECTION FOR THE DEVELOPMENT OF
A NETWORK OF MARINE AND COASTAL PROTECTED
                          AREAS IN MONTENEGRO

                                           1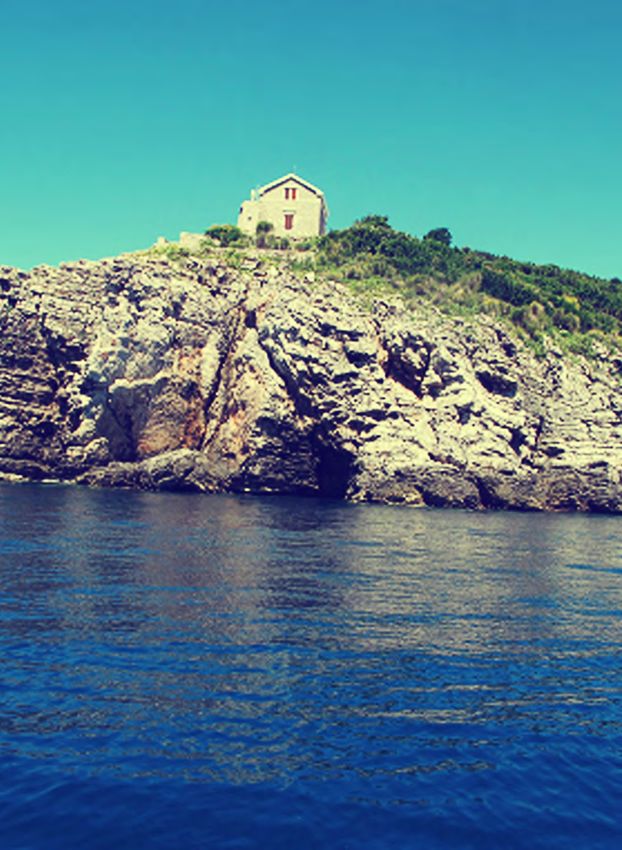
The designations employed and the presentation of the material in this document do not imply the expression of any opinion
whatsoever on the part of UNEP/MAP-RAC/SPA concerning the legal status of any State, Territory, city or area, or of its
authorities, or concerning the delimitation of their frontiers or boundaries. The views expressed in this publication do not
necessarily reflect those of UNEP/MAP-RAC/SPA.

Published by: RAC/SPA

Copyright: © 2014 - RAC/SPA

Reproduction of this publication for educational or other non-commercial purposes is authorized without prior written
permission from the copyright holder provided the source is fully acknowledged. Reproduction of this publication for resale or
other commercial purposes is prohibited without prior written permission of the copyright holder.

For bibliographic purposes, this report should be quoted as:

RAC/SPA - UNEP/MAP, 2011. Rapid assessment survey of coastal habitats to help prioritize the suitable new areas
needing a status of protection for the development of a network of Marine and Coastal Protected Areas in Montenegro. By
Badalamenti F., Garcia Charton J.A., Treviño-Otón J., Mačić V., and Cebrian D. Ed. RAC/SPA - MedMPAnet Project,
Tunis: 52 p + Annexes.

Layout: Tesnim AMRI, Asma KHERIJI and Zine El Abidine MAHJOUB.

Cover photo credit: Fabio BADALAMENTI.
Photos credits: Fabio BADALAMENTI and Golder Associates.

This document has been elaborated within the framework of the Regional Project for the Development of a Mediterranean
Marine and Coastal Protected Areas (MPAs) Network through the boosting of Mediterranean MPAs Creation and Management
(MedMPAnet Project).

The MedMPAnet Project is implemented in the framework of the UNEP/MAP-GEF MedPartnership, with the financial
support of EC, AECID and FFEM.

RAPID ASSESSMENT SURVEY OF COASTAL
HABITATS TO HELP PRIORITIZE THE SUITABLE
        NEW AREAS NEEDING A STATUS OF
  PROTECTION FOR THE DEVELOPMENT OF
    A NETWORK OF MARINE AND COASTAL
      PROTECTED AREAS IN MONTENEGRO

                Regional Project for the Development of a
             Mediterranean Marine and Coastal Protected
               Areas (MPAs) Network through the boosting
                        of MPA creation and management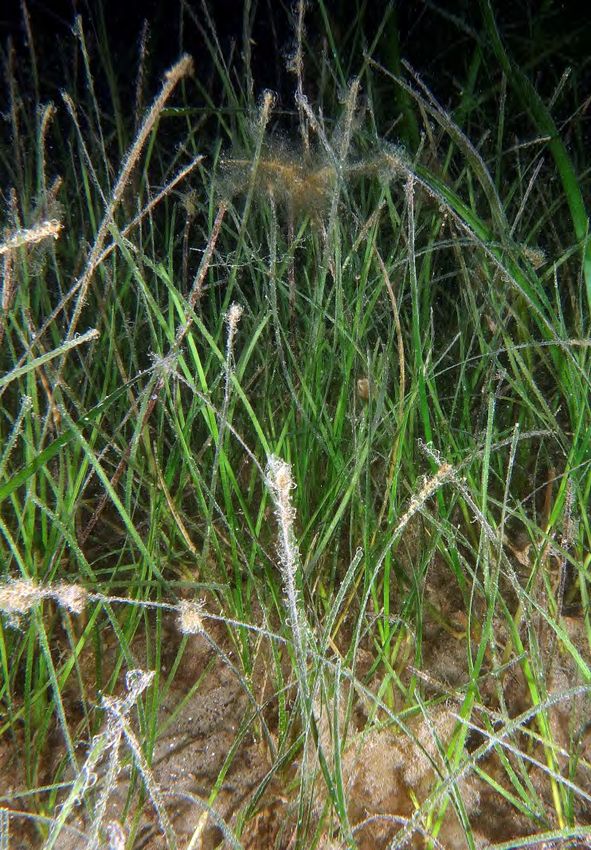
Study required and financed by:

Regional Activity Centre for Specially Protected Areas (RAC/SPA)
Boulevard du Leader Yasser Arafat
B.P. 337
1080 Tunis Cedex – Tunisia

In charge of the study :
Daniel CEBRIAN, SAP BIO Programme Officer, RAC/SPA
Atef LIMAM, MedMPAnet Project, RAC/SPA

Scientific responsibles of the study :
Fabio Badalamenti, Jose Antonio Garcia Charton and Jorge Treviňo Otón

With the participation of :
Vesna Mačić, Institute of Marine Biology of Kotor
Daniel Cebrian, SAP BIO Programme Officer, RAC/SPA

Reference of the study :
Contract N° 05/ MedMPAnet/2011
Contents

1. INTRODUCTION............................................................................................................................................5
2. METHODS ....................................................................................................................................................7
                  2.1. Study Area.....................................................................................................................................7
                  2.2. Pre-survey....................................................................................................................................14
                  2.3. Assessment of the benthic assemblages......................................................................................15
                  2.4. Assessment of fish assemblages ................................................................................................16
                  2.5. Data analysis................................................................................................................................17
3. RESULTS.....................................................................................................................................................19
                  3.1. Assessment of benthic assemblages............................................................................................19
                  3.2. Assesment of fish assemblages....................................................................................................33
4. DISCUSSION.................................................................................................................................................43
                  4.1. Assessment of the benthic assemblages......................................................................................43
                  4.2. Pinna nobilis ................................................................................................................................44
                  4.3. Assessment of fish assemblages...................................................................................................44
                  4.4. Quality of the environment..........................................................................................................46
                  4.5. Main human activities and threats to the coastal and marine environment .............................46
5. SUGGESTED SITES FOR PROTECTION...........................................................................................................49
6. EXECUTIVE SUMMARY................................................................................................................................51

ANNEXES

                                                                                                                                                                          3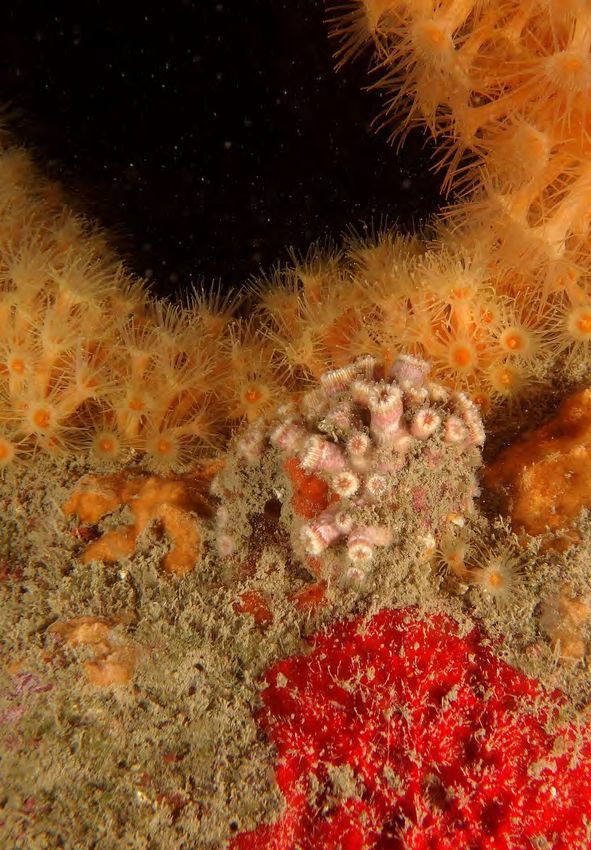
4
    © RAC/SPA, Golder Associates
1. INTRODUCTION

This report is part of the pilot activities for the on-       Montenegrin coast and is aimed at supporting the
site implementation of the project “Development of            definition of specific protection/management measures
a Mediterranean Marine and Coastal Protected Areas            for the Montenegro coast.
(MPAs) Network through the boosting of Mediterranean
                                                              The report includes two series of data, one on the benthic
MPAs creation and management in areas within national
                                                              habitats collected by Dr Fabio Badalamenti and the other
jurisdiction of third countries”, with support to RAC/
                                                              on the fish assemblages, collected by Dr Jose Antonio
SPA by the EC and the Spanish Agency for International
                                                              García Charton and Mr Jorge Treviño Otón. Notes on the
Cooperation to Development, AECID.
                                                              human activities and related socio-economic aspects
The report includes the findings of three different marine    were gathered by all the consultants.
biodiversity survey missions to Montenegro carried out
                                                              Data on benthic habitats from the three missions (2008,
in 2008 (20-29 July 2008) principally in the northern
                                                              2011 and 2012) were merged, a common analysis was
coast of the country, in 2011 (25 October-03 November
                                                              performed and a general discussion about the state of the
2011) in the southern coast and in the Bay of Kotor, and
                                                              benthic habitats provided.
in 2012 (12 – 20 June) in the following selected sites: Bay
of Boka Kotorska (o. Sv. Đorđe and Strp), Mamula island       Fish data from 2008, 2011 and 2012 were merged and
and surroundings (o. Mamula and u. Ploča),   island Sv.       analysed to extract a general view of the status of fish
Nikola in front of Budva town (several locations including    populations along the coast of Montenegro.
cape Mogren) and Trašte bay (Seka Kočište, Kamenolom
                                                              GPS coordinates and extension of the sites explored
Oblatno and Maslinada).
                                                              were provided by Dr Vesna Mačić, from the Institute of
The report includes the assessment of benthic and             Marine Biology in Kotor and Dr Daniel Cebrian from the
fish assemblages and of human activities along the            UNEP/MAP-RAC/SPA.

                                                                                                                      5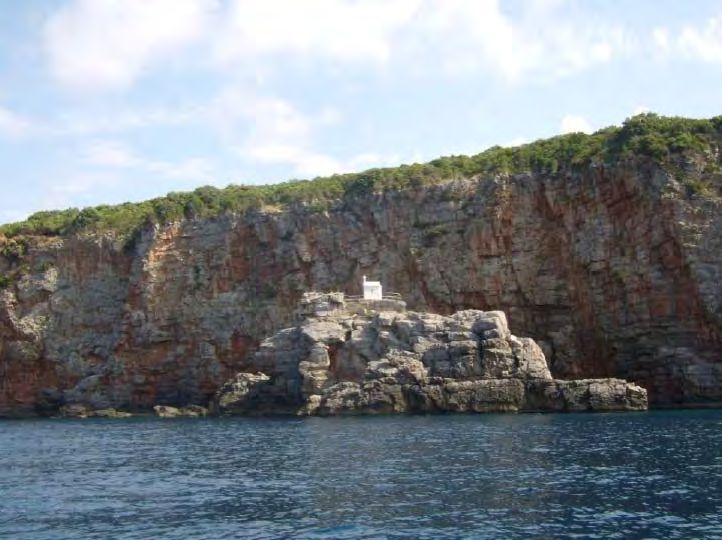
6
    © RAC/SPA, Golder Associates
2. METHODS

2.1. Study Area

The coast of Montenegro is small, with about 300 km            dominated by P. oceanica and sand or gravel and pebbles
long shoreline. This report covers the whole Montenegro        closer to the surface. The small bays, such as those of
coastline, from Mamula Island in the North, at the             Budva, Petrovac and Trašte, are dominated by P. oceanica
entrance of the Bay of Kotor, to Ulcinj in the South of the    and sand or gravel and pebbles closer to the surface.
country. The report also includes a survey inside the Bay of
                                                               The Bay of Kotor, Boka Kotorska, (Fig. 12), is a distinct
Kotor. The coastal habitat of Montenegro is characterized
                                                               system. The Boka Kotorska is a semi-enclosed bay. Owing
by calcareous rocky shores with sub-vertical (Fig. 1) and
                                                               to its peculiar shape and origin it is sometimes defined
vertical cliffs (Fig. 2) sloping abruptly down to 20-30 m
                                                               as the southernmost fjord. Since the middle of the 20th
depth on a mosaic of gravel, sand and mud, intermingled
                                                               century a number of researchers have begun to study
with generally small pebble/gravel beaches or creeks (Fig.
                                                               its fauna and have contributed greatly to improving
3) with gentler slopes. Two exceptions are the large sandy
                                                               knowledge of the Boka Kotorska. The most extensive
beaches close to the border with Albania (Annex I; Fig.
                                                               study is probably that by Stjpčević and Parenzan (1980)
21), the Velika Plaza south of Ulcinj, and the Bay of Kotor
                                                               carried out in 1970.
(Annex I; Fig. 32), which is a distinct system.
                                                               General description of the Bay
Along the rocky shore the lower part of the infralittoral
is often covered by well-preserved Posidonia oceanica          The sea passes through the strait between Cape Ostro (Rt
meadows (Fig. 4) with lower limits from 16 (in the south)      Ostro) and Punta Miriste, first entering the Bay of Herceg-
to 33 (in the north) m depth. The upper part of the            Novi (Hercegnovski zaliv) then turning towards the east,
infralittoral is rocky. In some areas the habitat structure    crossing a narrower channel (Kumborski tijesnac) then
is very complex (characterized by outcrops and large-          widening again into the Bay of Tivat (Tivatski zaliv). From
sized boulders) (Fig. 5). Algal coverage is generally scanty   here the sea heads north to the inner bays through the
because most of this zone is characterized by a coralline      narrow Verige Strait, widening to the west in the Bay of
barren dominated by sea urchins and encrusting algae           Risan (Risanski zaliv) and to the east in the Bay of Kotor
(Fig. 6).                                                      (Kotorski zaliv), which bends sharply while narrowing
                                                               towards the south.
Areas with dense coverage of Cystoseira spp. or other
brown algae are rare and generally located in the very         Between the Verige Strait and Perast lie the two small
upper infralittoral or in the infralittoral fringe where       islands of St. George (Sveti Djordje) and Our-Lady-of-the-
Cystoseira amentacea dominates the algal assemblage.           Reef (Gospa od Skrpjela).
The barren area (Fig. 7) extends on average from 0.5 to        The deep inlet of the Boka Kotorska is particular, due to its
10-12 m depth. Only at Seka Albaneze, Seka Kočište and         geographical situation, its orographical configuration and
Mamula Island does the barren area appear very small;          hydrographic characteristics, which influence the biotic
the sea bottom is covered by algae, in particular by           and abiotic factors. All of this determines a very specific
different species of Cystoseira and Sargassum, and Padina      physiognomy due to the enclosed waters, which present
pavonica (Fig. 8). Another exception is the Bay of Kotor,      notable differences to the open sea.
where the barren is absent, possibly because of a lack of
large rocky areas. Here, the upper infralittoral is rich in    Origin of the Bay
brown algae.                                                   The first hypothesis regarding the origin of the Boka
The midlittoral was not investigated thoroughly during         Kotorska was that of Savicki (1924), who considered
our missions. It is often characterized by the presence of     the morphological configuration to be of fluvial origin
Mytilus spp. (Fig. 9), with a rich assemblage of predators,    and pointed out that the straits have fluvial forms. The
including the starfish Coscinasterias tenuispina and the       existence of terraces along the straits suggest that a
mollusc Stramonita haemastoma (Fig. 10). Close to              tectonic predisposition should not be excluded. Cvijic
the surface, clear signs of biotope damaging owed to           (1924) supported Savicki’s opinion and added that the
date-fishing (Lithophaga lithophaga) are present (Fig.         Verige Strait is an erosion point, a similar one being present
11).   Between Bar and Ulcinj, mud is quite often found        at Capo Ostro. The Bay is accepted to be a drowned valley
at the bottom of the cliff, with the remarkable presence       shaped during the Pliocene period and continued later by
of Axinella cfr cannabina (finding a also common in the        tectonic down-warping (Campanelli et al. 2011).
Boka Kotorska). The small bays and inlets are generally

                                                                                                                           7
Hydrographic conditions                                         3-4 months (July-September).
Five small watercourses are present in the Boka Kotorska        Throughout the year there is wide variation in surface
area: Škurda, Ljuta, Široka rijeka, Gradiosnica and Sutorina.   water temperature in the Bay of Kotor. The mean maximum
The whole area is also characterized by karstic rivers and      temperature is in July (26.9° C) and the minimum in
underwater springs, which influence temperature, salinity       February (8.3 °C). Mean seafloor temperatures ranged
and species distribution.                                       from 19.5 °C to 14.4 °C (Stjepcevic and Parenzan, 1980).
The larger watercourses, coastal and underwater sources/        Salinity
springs are present mostly in the Bays of Kotor and Risan.
                                                                The lowest level of salinity, 26.27 ppm, is found in the
All the rivers, streams and torrents originate in the Lovcen
                                                                Bay of Risan at 11m depth. This low value is influenced
and Orjen mountain ranges, where there are vast areas of
                                                                by the great inflow from underwater freshwater sources/
karst which take in water in the rainy season and feed the
                                                                springs. The highest level of salinity is 39 ppm in the Bay
underground water system.
                                                                of Kotor (Stjepcevic and Parenzan, 1980).
From November to April, when precipitation is higher,
                                                                Benthic assemblages along the slopes
the sea surface of the Bays of Kotor and Risan, especially
close to Orahovac and Morinj, shows very low salinity.          The megafaunal benthic assemblages within the first
Precipitation in the Boka Kotorska reaches a maximum            20 metres depth are characterized by the presence of
of 5480 mm due to the enormous mass of freshwater               massive cnidarian with madrepores (notably Cladocora
flowing into the basin of Risan, which is relatively small      caespitosa) and gorgonians (Leptogorgia cfr sarmentosa
and closed (Stjepcevic and Parenzan, 1980). Precipitation       and Savalia savaglia) and sponge (Axynella spp., Geodia
varies greatly throughout the year. After the rainy season,     cydonium, Aplysina aerophoba) assemblages (Fig. 13
there is a period of summer drought, with no rainfall for       a-h).

        Figure 1: Calcareous rocky shores are one of the most common Montenegrin coastal habitats (Mendra)

          Figure 2: Calcareous vertical cliffs are one of the common Montenegrin coastal habitats (Valdanos)
8
Figure 3: Small pebble/gravel beaches are another typical habitat of the Montenegrin coast (stari Ulcinj)
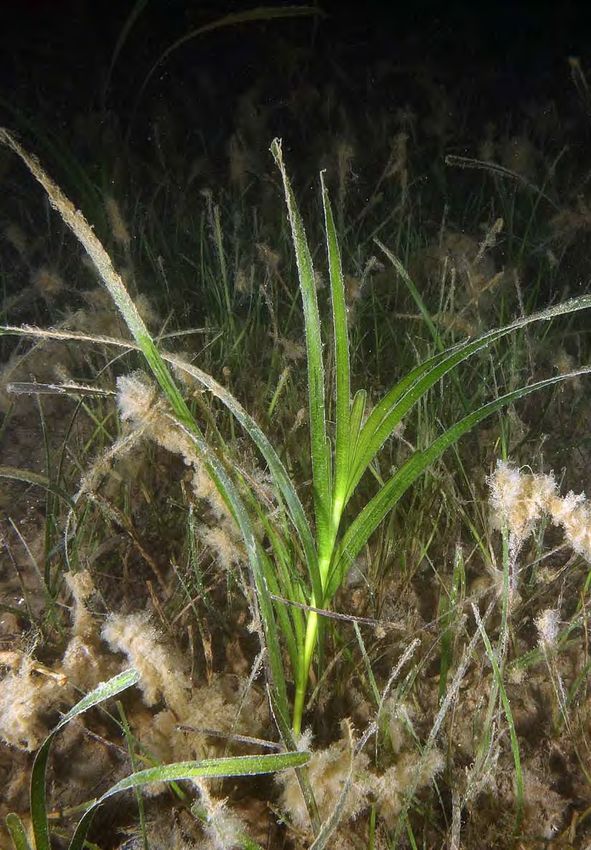
Figure 4: The lower part of the infralittoral along the rocky shore is often covered by well preserved
Posidonia oceanica meadows with lower limits from 16 to 33 m depth (Rep)
Figure 5: In some areas the habitat structure is very complex (characterized by outcrops and large-sized boulders
(Obala Strai Ulcinj)
9a b
Figure 6: Algal coverage in the infralittoral is generally scanty because most of this zone is characterized
by a coralline barren dominated by sea urchins and encrusting algae
Figure 7: Typical barren area at Rep
Figure 8: In the open sea at Seka Albaneze the barren area is very small and the sea bottom is covered by algae, in
particular by different species of Cystoseira, Sargassum and Padina pavonica
10Figure 9: The midlittoral could not be investigated thoroughly during our mission. It is often characterized
by the presence of Mytilus spp.
Figure 10: Coscinasterias tenuispina, a common predator of Mytilidae
11a b
Figure 11: Close to the surface, clear signs of date-fishing are present
Figure 12: Bay of Kotor, close to Dražin Vrt
12a b
c d
e f
g h
Figure 13: a) Madrepores, Cladocora caespitosa, b) and gorgonians, Leptogorgia cfr sarmentosa c) and Savalia
savaglia d), Parazoanthus axinellae e) and sponge Axynella cfr cannabina f), Geodia cydonium g),
Aplysina aerophoba h) characterize the mega benthic assemblages in the surveyed sites of Kotor Bay
132.2. Pre-survey survey was carried out due to the shortage of time. In
2011 at O. Sv. Đorđe only a qualitative survey was carried
Pre-survey activities mainly consisted of gathering out. This was because Cladocora caespitosa reefs had
information on the area, in particular on the benthic been reported in this site but we found none.
and fish assemblages and the human activities along the In 2012 at island Sv. Đorđe and Strp in the Bays of Kotor
Montenegrin coast and the Bay of Kotor and, during the and Risan and Školj (offshore of island Sv. Nikola) only a
second and third mission, reviewing the work carried qualitative survey was carried out. In the site at Kotor Bay,
out during the previous missions. Some important because diving was aimed at confirming the observation
references were found in the Kotor Marine Laboratory made in 2011 and to collect photos, školj was a qualitative
library, others were gathered after meeting with local replicate of island Sv. Nicola. Kamenolom Oblatno and
experts from the Laboratory or from the literature. Maslinada were used to describe the Pinna nobilis
Following the indications provided by the RAC/SPA contract population of Trašte Bay.
and the suggestions of the Kotor researchers the following
sites were chosen to carry out the surveys; 12 sites were All the other surveys included a quantitative assessment
surveyed both in 2008 and 2012 and 11 in 2011 (Table 1). of the benthic and fish assemblages. A list of the most
frequent and abundant benthic species was also collected,
In 2008 at Dražin Vrt, in the Bay of Kotor, only a qualitative together with photographic documentation.
Table 1: Sites surveyed in Montenegro coast in 2008, 2011 and 2012
Site Latitude Longitude Year of mission
1. Drazin Vrt N 42° 29’ 0.56’’ E 18° 44’ 55.81’’ 2008
2. Dubovac Cliff N 42° 09’ 7.67’’ E 18° 59’ 04.17’’ 2008
3. Formica islets N 42° 10’ 3.68’’ E 18° 57’ 51.90’’ 2008
4. Katic islets N 42° 11’ 3.35’’ E 18° 56’ 05.04’’ 2008
5. Mala Krekavica N 42° 16’ 2.38’’ E 18° 45’ 35.31’’ 2008
6. Mamula N 42° 23’ 8.20’’ E 18° 33’ 32.24’’ 2008
7. Posejdonov Grad N 42° 22’ 4.89’’ E 18° 36’ 00.57’’ 2008
8. Rt Kostovica N 42° 18’ 4.99’’ E 18° 43’ 47.52’’ 2008
9. Rt Platamuni N 42° 16’ 0.67’’ E 18° 46’ 41.85’’ 2008
10. Seka Albaneze N 42° 19’ 1.23’’ E 18° 41’ 58.32’’ 2008
11. Sveti Nikola N 42° 16’ 4.49’’ E 18° 46’ 10.81’’ 2008
12. Velika Krekavica N 42° 17’ 6.21’’ E 18° 44’ 55.81’’ 2008
13. Dražin Vrt N 42° 29’ 00.6’’ E 18° 42’ 54.3’’ 2011
14. Iza Perasta N 42° 29’ 45.3’’ E 18° 41’ 25.5’’ 2011
15. O. Stari Ulcinj N 41° 59’ 30.8’’ E 19° 08’ 29.5’’ 2011
16. O. Sv. Đorđe N 42° 29’ 07.1’’ E 18° 41’ 27.8’’ 2011
17. Obala Stari Ulcinj N 41° 59’ 29.2’’ E 19° 08’ 28.3’’ 2011
18. Opaljike N 41° 55’ 50.3’’ E 19° 11’ 04.4’’ 2011
19. Rt Kruče N 41° 58’ 47.7’’ E 19° 08’ 26.4’’ 2011
20. Rt Mendra N 41° 56’ 59.8’’ E 19° 08’ 56.9’’ 2011
21. Rt Rep N 41° 58’ 37.2’’ E 19° 08’ 20.6’’ 2011
22. Seka Albaneze N 42° 19’ 41.6’’ E 18° 41’ 58.8’’ 2011
23. Valdanos N 41° 57’ 36.2’’ E 19° 09’ 20.8’’ 2011
24. O. Sv. Đorđe N 42° 29’ 07.0’’ E 18° 41’ 28.4’’ 2012
25. Strp N 42° 30’ 17.1’’ E 18° 40’ 24.4’’ 2012
26. O. Mamula N 42° 23’ 38.5’’ E 18° 33’ 31.7’’ 2012
27. U. Ploča N 42° 25’ 01.6’’ E 18° 32’ 53.3’’ 2012
28. O. Sv. Nikola (west) N 42° 15’ 35.7’’ E 18° 51’ 21.6’’ 2012
29. O. Sv. Nikola (east) N 42° 15’ 36.9’’ E 18° 51’ 31.8’’ 2012
30. Hrid Galiola (o. Sv. Nikola west) N 42° 15’ 37.8’’ E 18° 51’ 11.7’’ 2012
31. Školj (o. Sv. Nikola west) N 42° 15’ 43.7’’ E 18° 51’ 01.3’’ 2012
32. Seka Kočište N 42° 21’ 59.8’’ E 18° 39’ 54.2’’ 2012
33. Kamenolom Oblatno N 42° 22’ 31.7’’ E 18° 39’ 21.1’’ 2012
34. Maslinada N 42° 22’ 41.6’’ E 18° 41’ 17.2’’ 2012
35. Rt Mogren N 42° 16’ 26.2’’ E 18° 49’ 47.4’’ 2012
142.3. Assessment of the benthic A protocol for data collection by SCUBA diving was
finalized before starting the field activities (Annex
assemblages 3). We decided to collect data along replicated
(generally three per site) 10 m wide transects running
The aim of this task was to report information on the most perpendicular to the coast from the foot of the cliff up
important benthic assemblages, including a list of dominant to the infralittoral fringe. Typically a transect ran from
mega-fauna and mega-flora species and on the habitat 20-25 m up to 0.5-2 m depth.
structure of the infralittoral zone of the selected sites.
The following 23 benthic assemblages were selected a priori and mapped as percentage of cover within each
transect:
1. Barren = encrusting coralline algae and sea urchins Arbacia lixula and Paracentrotus lividus
2. Boulders_barren = same as above plus large boulders
3. Caulerpa racemosa assemblage
4. Cladocora caespitosa reefs = Cladocora caespitosa assemblage
5. Coralligenous assemblages = Large boulders and vertical walls with dominance of Halimeda tuna, Parazoanthus
axinellae and sponges
6. Infralittoral algal turf assemblages
7. Infralittoral gravel assemblages
8. Infralittoral mud assemblages
9. Infralittoral mud and gravel assemblages
10. Infralittoral pebble assemblages
11. Infralittoral sand assemblages
12. Large sponge assemblage with Geodia, Aplysina and Petrosia
13. Mussel bed assemblage
14. Photophilic algae assemblage with Cystoseira spp. and Halopteris spp.
15. Photophilic algae assemblage with Cystoseira spp.
16. Photophilic algae assemblage with Padina pavonica
17. Posidonia oceanica
18. Rubble and turf assemblage with Codium sp.
19. Sciaphilic algae assemblages on hard substrata = Rocky substrates dominated by Codium bursa and Flabellia
petiolata
20. Sciaphilic algae assemblages on hard vertical/subvertical substrata with Flabellia petiolata and Halimeda tuna
21. Sciaphilic algae assemblages on hard substrata with Flabellia petiolata and Peyssonnelia spp.
22. Submerged canyon
23. Submerged caves
To facilitate graphic visualization, these assemblages were The following variables were collected while diving and
reduced to the following 10: reported on pre-constructed polyamide sheets: habitat
complexity, depth and sea bottom slope, percentage
• Barren, including assemblages 1 and 2 ;
cover of the most important assemblages and list of
• Coralligenous including assemblages 4, 5, 12 and 23 ; species. From land, the position of each transect (GPS
coordinates), the existence of human activities, the
• Mussel bed ;
geological nature and slope of the coast were recorded.
• Pebbles ; Complexity was visually estimated by assigning different
• Photophilic algae, including assemblages 3 and 14-16 ; parts of transects with a value of 1 to 4, where 1 = low; 2
= medium; 3 = high and 4 = very high complexity. During
• Posidonia ; the first survey in 2008. no data were collected from the
• Rubble and turf with Codium sp. ; midlittoral because of poor weather conditions and rough
sea surface. For the next two surveys is decided to avoid
• Sciaphilic algae including assemblages 19-22 ; more detailed survey of midlittoral in order to provide
• Soft bottom, including assemblages 7-11 ; more compatible methodology and data compatibility
with the previous survey. Also, we had idea to finish more
• Turf. difficult and more expensive survey of the deeper areas,
Pie charts were drawn for those 10 assemblages and non considering that possible future survey of midlittoral
Metric Multidimensional Scaling (nMDS) calculated. could be easier to organize and to perform.
152.3.1. Assessment of Pinna nobilis 2.4. Assessment of fish assemblages
Pinna nobilis is the largest bivalve mollusc of the
Mediterranean Sea, with records of individuals larger Underwater visual census (UVC) technique is a standardised
than 100 cm maximum shell length measured from the method, not destructive and performed by SCUBA diving,
apex. It is endemic to this sea and inhabits subtidal soft that allow to collect data on fish richness, size structure
bottoms, mainly Posidonia oceanica and Cymodocea and density data of fish assemblage. This method was
nodosa meadows, sand, mud, biodetritic and maërl used at the three campaigns in Montenegro with the aim
beds. Large-sized populations of Pinna nobilis have been to estimate rocky reef fish assemblages. 28 of the total sites
spotted in the bay of Trašte. It was decided to dedicate a selected were quantitatively surveyed, being Seka Albaneze
day in the area to locating at least two of these spots and done twice (2008 and 2011) (Table 2), while a qualitative
performing a quantitative assessment of this threatened observation was done in the other sites.
species listed in Annex II of the SPA/BD Protocol.
Table 2. List of sites surveyed each campaign grouped, by proximity, on zones within localities.
Year Locality Zone Site
2008 PLATAMUNI Eastern Grbalj Rat Platamuni
Sv. Nikola
Western Grbalj Seka Albaneze
Rat Kostovica
Krekavica Velika Krekavica
Mala Krekavica
PETROVAC Katic Islets Katic Is.
Sv. Nedjelja
Dubovica Dubovac Cliff
Formika Is.
2011 KOTOR Perast Drazin Vrt
iza Perasta
PLATAMUNI Western Grbalj Seka Albaneze
ULCINJ Stari Ulcinj Stari Ulcinj Is.
o. Stari Ulcinj
Rep rt Kruce
rt Rep
Valdanos
Ulcinj rt Mendra
Opaljike
2012 MAMULA Mamula Mamula Is.
Ploca
PLATAMUNI Traste Seka Kociste
Sveti Nikola Nikola East
Nikola West
Hrid Galiola
Skolj
Mogren
16Underwater visual census (UVC) technique was used at A matrix, sites per assemblages, was constructed and a
each site in three replicates of transects 50 x 5 m. nMDS was calculated on the Bray-Curtis similarity matrix
of untransformed data.
Measuring tape of 50m length was layed on sea bottom,
parallel to the coast line and trying to keep an average 2.5.1.1 Pinna nobilis
depth of 15 m. Observations along the 50m lenth and 5m
Stripe sampling was used to assess Pinna nobilis density
wide transects were recorded in situ on a underwater-
at two sites selected within Trašte Bay: Kamenolom
notebook estimating the size (in classes of 2 cm) and
Oblatno and Maslinada. Four 10 x 50 transect were
abundance of all species detected. Each fish observation
carried out at Kamenolom Oblatno and one at Maslinada.
was assigned to one of the nine predetermined
Individuals observed within thetransects were counted
abundance classes (1, 2-5, 6-10, 11-30, 31-50, 51-100,
and measured. Unburied length (UL) and corresponding
101-200, 201-500, >500), the limits of which match
minimum width (w) of individuals were measured
up the terms of a base (approximately) 2 geometric
underwater (Figure 14). Maximum shell length (Ht) of
series. Small-sized, cryptic species (belonging to families
each Pinna nobilis was estimated using the equation (Ht =
Gobiidae, Callyonimidae, Bleniidae, Gobioesocidae
UL + 1.79w +0.5).
and Tripterygidae) were excluded from the censuses to
avoid biases due to inappropriate size of sampling unit.
Censuses were done between 10 and 15 h, when water
conditions were optimal.
Along with the census of fish assemblages, habitat
characteristics were also studied. In each transect, values
of the deepest and shallowest points were recorded. From
these values, average depth and verticality (difference
between maximum and minimum depth) were calculated.
Substrate types were also recorded as the percentage
cover of rocky matrix, Posidonia meadow, sand bed or
pebbles at each 10 x 5 m segment inside each transect.
Surveys were followed by a short briefing were all divers
comment theirs observations to complete the species list.
2.5. Data analysis
2.5.1. Benthic assemblages
Each transect was divided a posteriori into Units. A Unit
was selected according to one of the following two criteria:
a) change in the dominant assemblage and/or b) abrupt Figure 14: Standard measurements in Pinna nobilis
change in the slope (> 15°). Each Unit included one or individuals
more patches of the assemblages selected a priori. Units
2.5.2. Fish assemblages
were named using the name of the dominant assemblage
followed by the slope degree (i.e. flat 0°-10°, low 10°-30°, Data from the three campaigns were merged in order to
moderate 30°-60°, high 60°-80° and vertical wall 80°- evaluate globally the spatial variation of fish assemblages
90°). Overall, a total of 115 Unit was possible from the along the coast of Montenegro. To this aim sites surveyed
combination of the 23 assemblages x 5 slope degrees. were grouped by proximity in zones and, equally, zones were
organized in five localities (Table 2). Being one of them the
Total and average number of Units per site, average
Kotor bay, with peculiar characteristics and four localities
number of assemblages per Unit, average habitat
placed outside the bay, from south to north, Ulcinj, Petrovac,
complexity per site and the overall frequency of
Platamuni and Mamula. For data analysis geometric mean of
occurrence of assemblage per site were calculated.
each fish abundance class were extracted. Three parameters
The length of each unit was calculated a posteriori were used to evaluate the community structure, species
according to its depth range and slope. By summing the richness and total and “reduced” abundance. Being the
length of each unit the total length of each transect was “reduced” abundance the total abundance excluding all
calculated, and by multiplying length by width the unit pelagic and shoaling species occupying the water column
and the overall transect surface area were obtained. From and those species particularly cryptic or hidden, because
the percentage cover of each assemblage recorded within they could not be accurately censused in a multi-species
Units the surface area of each assemblage per transect visual survey. We also examined differences at individual
was calculated and was then standardized as percentage species but only on those non-pelagic taxa sufficiently
cover of the whole transect. present throughout the study, establishing the threshold on
species with a frequency of occurrence ≥ 30%.
17A three factor nested PERMANOVA (sites nested in zones As a multivariate approach to evaluate the differences and zones in localities) was done to evaluate differences at community level between sites we performed, using from small to large scale (considering the factor Locality transformed abundance data (log x + 1), a non Metric and as fixed). PERMANOVA analyses were done with the Multidimensional Scaling (nMDS) based on the Bray-Curtis entire community, with the three parameters obtained similarity matrix and a Principal Component Analysis (species richness and total and “reduce” abundance) (PCA). We did the analysis with the entire community and individually with those species with a frequency and repeated it with a “reduced” one after removing of occurrence ≥ 30%. PERMANOVA analyses were also the shoaling and very abundant species which resulted completed with habitats variables in order to compare determinant in the first ordination. We completed these them with those obtained with fish population. analyses using PRIMER v6. Figure 15: Map of the Montenegro coast and of the study sites. Numbers 1- to 13 refer to the first survey, numbers 14 to 25 to the second survey and numbers 26 to 37 to the third survey. 1 Mamula, 2 Posejdonov Grad, 3 Rt Platamuni, 4 Sveti Nikola, 5 Katič islets, 6 Dokova seka, 7 Formica islets, 8 Dubovac Cliff, 9 Seka Albaneze, 10 Rt Kostovica, 11 Mala Krekavica, 12 Velika Krekavica, 13 Dražin Vrt, 14 Opaljike, 15 rt Mendra, 16 rt Rep, 17 Valdanos, 18 o. Stari Ulcinj, 19 Rt Kruče, 20 obala Stari Ulcinj, 21Seka Albaneze, 22 Dražin Vrt, 23 Dražin Vrt, 24 O. Sv. Đorđe, 25 iza Perasta, 26 O. Sv. Đorđe, 27 Strp, 28 O. Mamula, 29 u. Ploča, 30 O. Sv. Nikola (west), 31 O. Sv. Nikola (east), 32 hrid Galiola (O. Sv. Nikola west), 33 školj (O. Sv. Nikola west), 34 Seka Kočište, 35 Kamenolom Oblatno, 36 Maslinada, 37 Rt Mogren. 18
3. RESULTS

3.1. Assessment of benthic assemblages                            assemblages per site was the same at Dražin Vrt and Iza
                                                                  Perasta, but the average number of assemblages per unit
                                                                  was higher at Iza Perasta (2.08) than at Dražin Vrt (1.71).
The coast surveyed is mainly composed of vertical or sub-         Average complexity showed the opposite trend (Table 3).
vertical calcareous cliffs. Some of the sites are small islets    Overall, Barren, Posidonia oceanica, Soft bottoms and Turf
or outcrops (e.g. Katič   islet, O. Stari Ulcinj, Sveti Nikola,   were the dominant assemblages along the Montenegrin
etc.) and in two cases offshore reefs were also surveyed          coasts, both as percentage cover and frequency of
(Seka Albaneze and Seka Kočište) (Table 3). Land use in           occurrence (Table 4 and 5 and Figure 3-4). Barren resulted
the area surveyed is moderate (Table 3) but expansion             the assemblage with the highest frequency of occurrence
of tourism is very likely in the whole area. Overall, 80          in the area (89%) followed by Turf and the Soft bottom
quantitative transects were explored in the sites visited         assemblages (86%) and Posidonia oceanica (82%) (Table
and 70 Units identified (Table 3). Some further sites,            4 and  5). The assemblages with the lowest frequency of
(e.g. Dražin Vrt, Školj, O. Sv. Đorđe, Strp) were explored        occurrence in the area was Cladocora caespitosa (4%)
qualitatively.                                                    (Table 4 and 5).
Open sea sites                                                    In terms of % cover, Barren assemblages (i.e. Barren +
Katić islets was the site with the highest number of units        Boulders_Barren) were dominant in 11 sites, with values
(13), while Opaljike and Posejdonov Grad, showed the              ranging between 24,3% and 61,8% (Barren only in 6 in
lowest (4 units) values (Table 3). The average number of          the complete list of assemblages), Posidonia oceanica in
Units per site ranged between 8.00 (Mendra) and 2.50              8 sites, with values ranging between 29,6% and 64,2% (11
(Posejdonov Grad). The number of assemblages per site             sites in the complete list of assemblages) and soft bottoms
varied between the maximum recorded at Hrid Galiola               in 5 sites, with values ranging between 27,6% and 95,0%
(13) and the minimum recorded at Opalijke (5). The                (Table 4 and 5; Fig. 16 a-c).
average number of assemblages per Unit varied between             Coralligenous assemblages were important within the Bay
3.38 (Seka Kočište) and 1.20 at Mala Krekavica (Table             of Kotor (14,3% at Dražin Vrt and 12,7% at Iza Perasta)
3). Average habitat complexity was between 2.94 (Rt               and, notably, was present also in Hrid Galiola, Mogren and
Kostovica) and 1.30 (Opaljike) (Table 3).                         Seka Kočište but with lower percentages (Table 4; Fig. 16
Boka Kotorska                                                     a-c). Rubble and Turf with Codium (28,1% at Dražin Vrt and
                                                                  19,9% at Iza Perasta) resulted exclusive of the Bay of Kotor.
Two quantitative surveys, Dražin Vrt and Iza Perasta, and         The complex of Sciaphilic algae reaches higher values
three qualitative ones were carried out within the Bays           at Seka Kočište (58,1%) while Photophilic algae reaches
of Kotor and Risan.  Overall, 6 units were found at both          higher values at Mamula (60,5%) and Seka Albaneze II
Dražin Vrt and Iza Perasta, with an average of 5.33 and           (45,2%). Turf is the most important assemblage at Velika
4.33 units per site respectively. The total number of             Krekavica (33,3%) (Fig. 16 a-c)

                                                                                                                           19
Table 3: Main characteristics of the sites studied. Table 4: Percentage contribution of different assemblages to sites. 20
Table 5: Percentage contribution of the reduced number of assemblages to sites.

                                                                                  21
22
Figure 16 (a): Percentage cover of the 10 «reduced» assemblages in the surveyed sites23
Figure 16 (b): Percentage cover of the 10 «reduced» assemblages in the surveyed sites24
Figure 16 (c): Percentage cover of the 10 «reduced» assemblages in the surveyed sitesThe nMDS segregated sites characterized by important southernmost part of the country (Fig. 15) and are linked.
coverage of soft bottom assemblages such as Dražin This distribution is due to the effects of the Bojana river.
Vrt and Iza Perasta inside Kotor Bay, and Opaljike in the Posidonia oceanica resulted the most important feature
open sea, from those characterized by a large proportion of Katic Islet, Rep and Sv Nikola (Budva) inshore (Fig. 16
of Posidonia oceanica, such as Katić islets, Obala Stari a-c and Fig. 17 f and m). P. oceanica was important also
Ulcinj, Rep and Sv Nikola (Budva) inshore and offshore, or at Seka AlbaneseII, Seka Kočište and Mamula, where,
by Photophilic algal assemblages such us Mamula, Seka however, the best conserved algal, Photophilic and
AlbanezeII and Seka Kočište (Fig. 17 a-m). Kruče, Mala Sciaphilic, assemblages in the country were found (Fig.
Krekavica, Rat Patamuni, Stari Ulcinj and others showed 16 a-c and Fig. 17 e, h and m) and at Obala Stari Ulcinj,
large percentages of Barren and Mussel beds, while where coralligenous assemblages are important (Fig. 16
Mendra added Turf assemblages to the two previous b) and Hrid Galiola, MamulaII, Sv. Nikola (Budva) Inshore
ones (Fig. 17 a, c and l). Valdanos had a heterogeneous and Uvalla Ploča, where soft bottom assemblages were
and balanced mixture of all the main assemblages. also important (Fig. 16 a-c and Fig. 17 i).
Coralligenous assemblages were almost exclusive to sites
All the other sites were strongly characterized by a large
in Kotor Bay (Fig. 17 b). Coralligenous in Boca Kotorska
proportion of barren (Fig. 16 a-c and Fig. 17 a and m). The
was found in its best form at Dražin Vrt between 12 and
possible causes of the extensive presence of barren (i.e.
30m depth (Fig. 18).
overfishing with the use of explosives and date harvesting)
Large colonies of Parazoanthus axinellae started at about are discussed in the next section.
12 m depth, covering isolated boulders on the seaward
Finally, it is worth noting that mussel beds were more
side of each boulder (Fig. 18). Deeper, down to about 17
developed in the southern sites, from Obala Stari Ulcinj to
m depth, isolated colonies of Leptogorgia cfr tormentosa,
Opaljike (Fig. 16 a-c and Fig. 17 c).
Savalia savaglia, P. axinellae and large-sized sponges were
found. These isolated colonies were followed by massive As far as species distribution is concerned, Ophidiaster
colonies of Cladocora caespitosa down to about 30 m ophidianus was almost absent from the southern sites.
depth. Colonies were spherical or egg-shaped. Length Instead, large-sized Axinella cfr cannabina were found
ranged from 0.5 to 8 m, width was between 0.5 and 3 m there, in particular at the foot of the cliffs, and the
and height reached 3 m. Between C. caespistosa colonies, infralittoral fringe was dominated by mussel beds which
very large colonies of S. savaglia were found with L. cfr extended, in some cases, down to 2.5 m depth. Pinna
tormentosa intermingled between them. On the seaward nobilis is abundant in the north at Trašte Bay.
surface of C. caespitosa, colonies of P. axinellae and
Overall, 119 different taxa, including invertebrates, algae
several large-sized sponges were found, together with
and phanerogames, were identified underwater at the
ascidians. Both isolated and massive colonies were close
investigated sites (Annex 2).
to freshwater springs (Fig. 18).
Assessment of Pinna nobilis
Results showed quite clearly that sites inside the Boca
Kotorska were distinct from the others because of a) the Data from two sites (Kamenolom Oblatno and Maslinada
large percentage of soft bottom assemblages and b) the ) were merged for this analysis. Overall, 63 individuals
exclusiveness of Rubble and Turf with Codium and c) the were found within the 6 transects, with an average of
importance of Coralligenous assemblages (Fig. 16 a-c 2,13 (±0.95) individuals/100 m2. Average length of the
and Fig. 17 b, g, i and m). Another two sites, Valdanos shell (Ht) was 54,42 cm (±7,21). No significant differences
and Opaljike were characterized by large percentages of were found in the Ht among the 6 transects (F5,58 =1,29;
soft bottom assemblages (Fig. 16 b-c), both close to the P = 0,28).
25a
b
Figure 17 (a-b): nMDS bubble plots constructed on the sites per assemblages matrix. The Bray-Curtis similarity
index of untransformed data was used to perform the analysis. Bubble size is proportional
to the importance of the assemblage at each site.
26c
d
Figure 17 (c-d): nMDS bubble plots constructed on the sites per assemblages matrix. The Bray-Curtis similarity
index of untransformed data was used to perform the analysis. Bubble size is proportional
to the importance of the assemblage at each site.
27e
f
Figure 17 (e-f): nMDS bubble plots constructed on the sites per assemblages matrix. The Bray-Curtis similarity
index of untransformed data was used to perform the analysis. Bubble size is proportional
to the importance of the assemblage at each site.
28g
h
Figure 17 (g-h): nMDS bubble plots constructed on the sites per assemblages matrix. The Bray-Curtis similarity index
of untransformed data was used to perform the analysis. Bubble size is proportional
to the importance of the assemblage at each site.
29i
l
Figure 17 (i-l): nMDS bubble plots constructed on the sites per assemblages matrix. The Bray-Curtis similarity
index of untransformed data was used to perform the analysis. Bubble size is proportional
to the importance of the assemblage at each site.
30m
Figure 17 (m): nMDS constructed on the sites per assemblages matrix. The length of the blue line represents the
degree of correlation of the investigated sites with the ten “reduced” assemblages. The Bray-Curtis similarity
index of untransformed data was used to perform the analysis. Bubble size is proportional
to the importance of the assemblage at each site.
31Figure 18: Schematic map of the Dražin Vrt area, illustrating the species contributing to the Coralligenous assemblage.
Size of Cladocora caespitosa, main currents, depth, freshwater springs, slope steepness
(mod = moderate, high= high, vhigh=very high) are reported.
323.2. Assesment of fish assemblages
Habitat data
Despite of we selected 15 meters as work depth, coast Rocky matrix was the predominant habitat in the transects
characteristics made difficult to complete all transects surveyed with the exception of the Katic Islets zone (Katic
within this depth, ranging the transect depth from 5,8 Is. And Sv. Nedjelja), Dubovac Cliff and the coast near the
to 19,3 meters, being the average depth of all transects islands of Mamula (Ploca) and Stari Ulcinj (O. Stari Ulcinj)
13,88 meters. In the same way habitat heterogeneity were Posidonia oceanica was dominant, and the Kotor
made hard to keep a constant depth obtaining values of bay, where sandy and muddy bottoms were the principal
verticality varying from 2 to 8,7 meters (Table 6). habitat (Table 6).
Habitat complexity values, explained by the number of Table 6 Mean depth (m), mean verticality (m), number of
boulders (mainly medium and large blocks), varied from small, medium and large boulders and average percentage
sites with low complexity like those inside the Kotor bay to cover of rocky matrix, Posidonia oceanica, sand and
high complex sites like Sv. Nikola or Mala Krekavica (Table 6). pebbles associated to fish assemblages visual censuses.
Table 6: Mean depth (m), mean verticality (m), number of small, medium and large boulders and average percentage
cover of rocky matrix, Posidonia oceanica, sand and pebbles associated to fish assemblages visual censuses
Site Mean depth Verticality Small Medium Large %Rock %Posid %Sand %Pebbles
Rat Platamuni 16,8 4,3 64,0 24,0 13,3 86,7 13,3 0,0 0,0
Sv. Nikola 19,0 8,7 59,3 22,0 20,7 100,0 0,0 0,0 0,0
Seka Albaneze 15,0 6,0 18,3 6,0 6,3 75,0 21,7 3,3 0,0
Rat Kostovica 10,8 4,3 61,0 16,3 10,0 83,3 16,7 0,0 0,0
Velika Krekavica 16,8 7,0 51,7 20,0 9,7 96,7 3,3 0,0 0,0
Mala Krekavica 17,8 4,3 61,3 21,7 16,7 100,0 0,0 0,0 0,0
Katic Is. 16,7 2,7 37,3 16,7 12,7 30,0 70,0 0,0 0,0
Sv. Nedjelja 10,7 8,0 39,3 12,3 15,3 38,3 61,7 0,0 0,0
Dubovac Cliff 15,5 5,0 37,3 12,0 8,0 36,7 63,3 1,7 0,0
Formika Is. 13,3 3,3 50,7 17,7 12,0 60,0 16,7 23,3 0,0
Drazin Vrt 17,7 4,0 28,0 7,7 3,3 29,3 0,0 44,7 26,0
Iza Perasta 10,3 3,3 32,0 1,0 0,0 0,0 0,0 85,3 14,7
Seka Albaneze 19,3 4,7 18,0 6,7 7,0 64,7 33,3 2,0 0,0
Stari Ulcinj Is. 15,7 4,0 46,0 20,7 14,3 76,7 22,0 1,3 0,0
O. Stari Ulcinj 11,0 3,3 27,3 19,3 13,3 45,3 48,0 6,7 0,0
Rt Kruce 14,8 4,2 40,3 19,0 12,3 66,0 25,3 8,7 0,0
Rt Rep 16,7 2,7 48,7 9,7 7,3 48,7 22,7 28,7 0,0
Valdanos 8,1 2,5 64,0 23,0 13,7 85,3 8,7 0,0 6,0
Rt Mendra 9,7 2,7 83,0 18,7 8,0 93,7 0,3 6,0 0,0
Opaljike 5,8 2,0 34,0 20,3 13,0 72,0 0,0 28,0 0,0
Mamula Is. 14,3 4,7 40,0 11,0 9,0 98,0 2,0 0,0 0,0
Ploca 11,0 4,7 24,3 8,0 5,0 46,7 53,3 0,0 0,0
Seka Kociste 15,7 3,3 24,0 16,7 5,7 76,0 19,3 4,7 0,0
Nikola East 7,5 4,3 81,0 12,7 4,3 89,3 10,7 0,0 0,0
Nikola West 14,0 4,7 94,7 22,7 9,3 88,0 12,0 0,0 0,0
Hrid Galiola 16,5 5,7 66,3 9,7 8,3 87,3 3,3 9,3 0,0
Skolj 13,7 4,7 28,7 12,7 10,3 60,7 31,3 8,0 0,0
Mogren 14,3 4,7 25,0 22,0 11,3 71,3 24,0 4,7 0,0
33As the Kotor bay was clearly different from the rest of the PCA plot displayed similar results to those obtained in
sites surveyed the two sites placed inside the bay were PERMANOVA analysis (Fig. 19). The first two axes of the
excluded from data analysis. ordination explained the 53,2% of the variability obtained,
dividing the graph into three parts. Above were the sites
PERMANOVA analysis presented differences in the habitat
with sandy bottoms, mainly represented by the Ulcinj
characteristics at Locality level and at Small scale, while there
locality. At the right side of the plot were placed the sites
were not significant differences at Zone scale. Pair-wise test
of Petrovac locality with high percentages of P. oceanica.
showed that these dissimilarities were presents between all
Finally, at the left bottom were found the deepest transects
localities with the exception of Mamula (Table 7).
with high complexity represented by the Platamuni locality.
Table 7: Habitat PERMANOVA analyses results and Pair-wise test between localities. Significant F-values and
corresponding P-values are indicated in bold.
Source df SS MS Pseudo-F P(perm)
Locality 3 99,225 33,075 2,3893 0,0117
Zone(Locality) 7 99,357 14,194 1,0774 0,3783
Site(Zone(Locality)) 14 182,73 13,052 3,073 0,0001
Res 53 225,11 4,2473
Total 77 616
Pair-wise test t P(perm)
Platamuni Petrovac 1,9467 0,01
Platamuni Ulcinj 1,5892 0,0442
Platamuni Mamula 1,063 0,3435
Petrovac Ulcinj 1,7168 0,0438
Petrovac Mamula 1,2934 0,3313
Ulcinj Mamula 1,3084 0,205
Fish assemblages case for example of Diplodus sargus and Sarpa salpa, two
frequently sparids found in the Mediterranean, which did
In total, 41 species were detected along the three
not appear in the transects of the 2012 campaign (Table 8).
campaigns in the visual censuses of fish assemblages.
Labrids with 12 and sparids with 11 were the families The three species more abundant were the shoaling species
with more number of species followed by serranids with Chromis chromis, Boops boops and Spicara smaris with 223,8
6 (Table 8). The rest of families were represented by just ind., 135,5 ind. and 56,1 individuals 250 m-2 respectively.
one species with the exception of centracanthids and Excluding these three shoaling species Coris julis appeared
scorpaenids with two. Trigla lucerna was not localized to be the more abundant species with 28,2 ind/250m2. Far
during the realization of the censuses but detected by from this species but also abundant we found Symphodus
other divers in the course of the dives and thus were not ocellatus, Oblada melanura, Serranus cabrilla, Diplodus
taken into account for the analysis. vulgaris and Diplodus annularis (Annex 5).
None of the 41 species were detected at all the transects Species richness per site ranged from 8 species censused
done. Coris julis, Chromis chromis and Serranus cabrilla at iza Perasta to 30 in Rat Kostovica with an average value
were the species more frequently founded. On the other of 18,39 species observed per site. Regarding the total and
hand, 25 species did not reach the 30% of presence, “reduced” abundance we found medium values of 487,3
being excluded from subsequent analysis. Some of these and 67,5 individuals 250m-2 respectively varying between
omitted species were common Mediterranean species 2369,6 ind./250m2 at Seka Albaneze to 84,7 ind./250m2 at
that due to its low density in the zone were not present Iza Perasta for total abundance and from 145,3 ind./250m2
in a high number of transects (Table 8), however they in Opaljike to a minimum of 22,6 ind./250m2 in Katic Is. for
were frequently detected during the dives. This was the “reduced” abundance (Annex 5).
34Figure 19: PCA ordination plot of transects within localities. PC1: 32,3% PC2: 20,9%
35Table 8: Percentage frequency of occurrence of the fish species observed in the quantitative assessment. Present/absent table of fish species at each campaign and locality. 36
Table 9: a) b) PERMANOVA analyses results and Pair-wise test between localities for the entire community (a) and for
richness, total abundance and “reduced” abundance (b).
Significant F-values and corresponding P-values are indicated in bold.

 a)          Source                       df       SS           MS         Pseudo-F       P(perm)

             Locality                     3      12878        4292,8       1,9959         0,026
             Zone(Locality)               7      15766        2252,4       1,5541         0,0213
             Site(Zone(Locality))         14     20116        1436,9       1,7995         0,0002
             Res                          53     42318        798,46
             Total                        77     91601

              Pair-wise test                      t                                       P(perm)

             Platamuni         Petrovac           1,4854                                  0,0767
             Platamuni         Ulcinj             1,2278                                  0,1785
             Platamuni         Mamula             0,88256                                 0,6126
             Petrovac          Ulcinj             2,1157                                  0,0141
             Petrovac          Mamula             2,0606                                  0,3353
             Ulcinj            Mamula             1,38                                    0,1233

 b)        Source

             Richness                     df          SS        MS         Pseudo-F       P(perm)

             Locality                     4      257,06       64,266       3,3392         0,0949
             Zone(Locality)               7      142,35       20,336       1,8452         0,1498
             Site(Zone(Locality))         15     163,89       10,926       1,2845         0,234
             Res                          57     484,83       8,5058
             Total                        83     1017,6

             Total abundance              df          SS        MS         Pseudo-F       P(perm)

             Locality                     4      3,94E+06     9,84E+05     3,1214         0,1507
             Zone(Locality)               7      1,91E+06     2,72E+05     0,34559        0,8908
             Site(Zone(Locality))         15     1,18E+07     7,90E+05     2,4759         0,0106
             Res                          57     1,82E+07     3,19E+05
             Total                        83     3,74E+07

             Reduced abundance            df          SS        MS         Pseudo-F       P(perm)

             Locality                     4      20061        5015,2       2,1867         0,1516
             Zone(Locality)               7      16345        2335         1,0492         0,4315
             Site(Zone(Locality))         15     33144        2209,6       1,8237         0,0533
             Res                          57     69063        1211,6
             Total                        83     1,38E+05

                                                                                                                 37
PERMANOVA analysis completed with the entire Ulcinj and high variability at the smaller scales (Table 10).
community revealed high variability at site and zone
With respect to the PERMANOVA analysis done to
levels while at the locality level we just found differences
evaluate the differences in abundance, total and “reduce”,
between the localities of Petrovac and Ulcinj (Table
and those in the species richness, we did not distinguish
9a). These results match with the nMDS plot obtained,
significant results at locality level. We just found meaning
however this nMDS graph must be read carefully because
changes at site level in the total abundance (Table 9b).
of its high stress (Fig. 20).
When we checked the PERMANOVA by single species we
PERMANOVA analysis were performed also on “reduced” met significant results at locality level only for Symphodus
fish community, were all pelagic, shoaling and cryptic mediterraneus and differences at zone level for Mullus
species were removed. Results of that analysis almost surmuletus and Serranus cabrilla. Other five species
match with previous one, presenting significant showed differences just at small scale (Table 11).
differences at locality level just between Petrovac and
Figure 20: nMDS plot of the entire community
38Table 10. PERMANOVA analyses results and Pair-wise test between localities for the “reduced” community.
Significant F-values and corresponding P-values are indicated in bold.
Source df SS MS Pseudo-F P(perm)
Locality 3 12819 4273,2 1,9959 0,0245
Zone(Locality) 7 15685 2240,8 1,5541 0,0454
Site(Zone(Locality)) 14 21379 1527,1 1,7995 0,0001
Res 53 42776 807,09
Total 77 93017
Pair-wise test t P(perm)
Platamuni Petrovac 1,4085 0,0849
Platamuni Ulcinj 1,4447 0,08
Platamuni Mamula 0,73206 0,7699
Petrovac Ulcinj 2,1201 0,013
Petrovac Mamula 1,5519 0,3319
Ulcinj Mamula 1,4994 0,0684
Table 11. PERMANOVA analyses results for the species with significant differences.
Significant F-values and corresponding P-values are indicated in bold.
C. chromis D. vulgaris
Source MS Pseudo-F P(perm) MS Pseudo-F P(perm)
Locality 3,12E+05 3,8805 0,0963 110 1,9849 0,1744
Zone(Locality) 61377 0,21852 0,9626 54,902 0,75233 0,6206
Site(Zone(Locality)) 2,83E+05 2,8392 0,0057 72,349 3,1337 0,0018
Res 99847 23,088
M. surmulletus S. cabrilla
Source MS Pseudo-F P(perm) MS Pseudo-F P(perm)
Locality 23,243 0,55553 0,7013 109,05 2,2022 P(perm)
Zone(Locality) 46,226 11,334 0,0007 54,393 4,9526 0,1594
Site(Zone(Locality)) 4,0326 0,36408 0,9826 10,837 1,9016 0,0172
Res 11,076 5,6988 0,042
S. cantharus S. mediterraneus
Source MS Pseudo-F P(perm) MS Pseudo-F P(perm)
Locality 42,665 0,83661 0,5393 52,528 18,921 0,0361
Zone(Locality) 53,782 1,5528 0,1958 1,752 0,13616 0,9647
Site(Zone(Locality)) 34,223 3,2155 0,0016 13,245 2,5321 0,0044
Res 10,643 5,231
39S. tinca C. julis
Source MS Pseudo-F P(perm) MS Pseudo-F P(perm)
Locality 2,0208 0,13459 0,9661 4510,1 2,9449 0,1394
Zone(Locality) 15,677 1,3486 0,292 1649,7 2,5565 0,0603
Site(Zone(Locality)) 11,496 2,8408 0,0022 637,7 1,859 0,046
Res 4,0468 343,04
SIMPER analysis done with the entire community showed vulgaris, D. sargus and S. cabrilla were present mainly in
an important influence of shoaling and pelagic species on the southern locality (Ulcinj) with shallower depth and
the nMDS ordination due to its high abundance, therefore rocky bottom. Similarly C. jullis and S. ocellatus prefer
a “reduced” fish community were used in a second SIMPER rocky bottoms but were more frequents at Platamuni.
analysis in order to avoid the influence of these species.
Finally, D. annularis prefers habitats with more occurrence
This second SIMPER analysis determined six species as of sand and P. oceanica (Fig. 21).
the responsible of the dissimilarities between sites. D.
40a
b
c
Figure 21: (a-c) nMDS bubble plots constructed on the sites per fish assemblages matrix.
Bubble size is proportional to the importance of the species at each site.
Numbers in the bubble represents the locality. 1: Platamuni, 2: Petrovac, 3: Ulcinj, 4: Mamula
41d
e
f
Figure 21: (d-f) nMDS bubble plots constructed on the sites per fish assemblages matrix.
Bubble size is proportional to the importance of the species at each site.
Numbers in the bubble represents the locality. 1: Platamuni, 2: Petrovac, 3: Ulcinj, 4: Mamula
424. DISCUSSION
4.1. Assessment of the benthic following protection the dominance of sea urchins should
come to an end because fish abundance and size increase
assemblages should lead to algal assemblage recovery. In the case of
Seka Albanese, the reduction in barren area between
2008 and 2011 seems to be the result of a storm, rather
The benthic assemblages surveyed along the coast of than of predation, which swept most of the urchins away
Montenegro are diverse and typical of the infralittoral of from the reef.
Mediterranean hard and soft substrates, with the notable
exception of those in the Bay of Kotor, which represent a In the south of the country, the lower infralittoral is
unicum. All the assemblages seem to be in a good state dominated by soft bottoms, sand and mud. South of Cape
of health, with the exception of the upper infralittoral Mendra at Opalijke, fine sand assemblages start at about
in the offshore sites, where the date fishery, when and 5-6 m depth and include some Cymodocea nodosa and
where practised, has provoked a profound change in both a few rocky outcrops with Posidonia oceanica. Sand is
the physical structure of the substrate and the biological mixed with mud around 20 m depth. Similarly, at Valdanos,
composition of the benthic communities. north of Cape Mendra, soft bottoms - mainly mud, start
at about 12- 14 m depth. In contrast, Cape Mendra is a
Dates are collected once the rock has been demolished rocky promontory. The greater frequency of soft bottoms
mechanically. This kind of destructive fishery increases in the south of the country is very likely to correlate to
the amount of stone blocks, gravel and sand at the the nearness of the Bojana River delta. At the base of the
bottom of the cliff and triggers a change in the state of cliffs at depths of between 16 and 20m colonies of large
the system from forested to barren. This action, coupled sized Axinella cfr cannabina are very common. In this
with overfishing, which dramatically reduces the size part of the country, at such depths, water transparency
and number of predatory fish, is at the base of the is reduced and a cloud of mud is often observed close to
proliferation of barren habitats dominated by sea urchins the cliff foot. Also in this case there is the possible effect
in shallow Montenegrin waters. Indeed, fishing with of the Bojana river.
explosives is a plague for Montenegro, and has led to the
impoverishment of predator fish assemblages. Very well preserved, Posidonia oceanica beds dominate
the lower infralittoral in most of the other sites, together
The barren stable state characterises the upper rocky with pristine sciaphilic assemblages, where the slope or
infralittoral at all the sites of the open sea visited except the complexity of the substratum is high.
Mamula, Seka Albaneze and Seka Kočište. Some of the
areas surveyed were the object of study by algologists in Algal turf was important in Mendra. This may be the
past decades (Ŝpan and Antroliċ 1983), who reported a consequence of high slope and runoff from date fishing.
luxuriant algal canopy with several species, brown algae in The infralittoral fringe is often characterised by brown
particular. Sea urchin grazing has led to the disappearance alga Cystoseira amentacea. However, turf dominates on
of photophilic algal assemblages from a large part of the vertical walls and, in the southernmost site, the fringe is
Montenegrin coast. These have now been substituted by dominated by mussel beds, in some cases down to 2.5 m
a coralline barren area. depth.
Seka Albaneze showed Cystoseira assemblages Inside Boca Kotorska at Dražin Vrt and Strp a Coralligenous
flourishing, although in the first survey a sea urchin front assemblage was found between 12 and 30 m depth. At
and a vast barren area were reported. It is beyond the scope Dražin Vrt, impressive Cladocora coespitosa reefs were
of this report to comment on the cause of the expansion present and were associated with a rich assemblage
of the barren areas. However, it is worth highlighting the of large-sized sponges and cnidarians, notably massive
complexity of the mechanisms regulating the presence of colonies of the false black coral, Savalia savaglia, the
alternative stable states such as the Cystoseira kelp and gorgonian Leptogorgia cfr sarmentosa and the yellow
the barrens. Among the other causes, a trophic cascade cluster anemone Parazoanthus axinellae. In the other two
could be invoked to explain the phenomenon. The sites investigated no such large reefs were found, only
decrease in number, after intensive fishing, of large sea small colonies. At Iza Perasta, brown algae characterized
urchin predators, such as a number of sea bream species, the first few metres and large sponges were common at
may lead to the explosion of grazers and to a consequent greater depths, notably Geodia cydonium.
reduction in the algal canopy. According to this model,
43You can also read