Review on Multitemporal Classification Methods of Satellite Images for Crop and Arable Land Recognition
←
→
Page content transcription
If your browser does not render page correctly, please read the page content below
agriculture

Article
Review on Multitemporal Classification Methods of Satellite
Images for Crop and Arable Land Recognition
Joanna Pluto-Kossakowska

                                          Faculty of Geodesy and Cartography, Warsaw University of Technology, 00-661 Warsaw, Poland;
                                          joanna.kossakowska@pw.edu.pl

                                          Abstract: This paper presents a review of the conducted research in the field of multitemporal
                                          classification methods used for the automatic identification of crops and arable land using optical
                                          satellite images. The review and systematization of these methods in terms of the effectiveness of
                                          the obtained results and their accuracy allows for the planning towards further development in this
                                          area. The state of the art analysis concerns various methodological approaches, including selection of
                                          data in terms of spatial resolution, selection of algorithms, as well as external conditions related to
                                          arable land use, especially the structure of crops. The results achieved with use of various approaches
                                          and classifiers and subsequently reported in the literature vary depending on the crops and area
                                          of analysis and the sources of satellite data. Hence, their review and systematic conclusions are
                                          needed, especially in the context of the growing interest in automatic processes of identifying crops
                                          for statistical purposes or monitoring changes in arable land. The results of this study show no
                                          significant difference between the accuracy achieved from different machine learning algorithms,
                                yet on average artificial neural network classifiers have results that are better by a few percent than

                                          others. For very fragmented regions, better results were achieved using Sentinel-2, SPOT-5 rather
Citation: Pluto-Kossakowska, J.
                                          than Landsat images, but the level of accuracy can still be improved. For areas with large plots there
Review on Multitemporal
                                          is no difference in the level of accuracy achieved from any HR images.
Classification Methods of Satellite
Images for Crop and Arable Land
Recognition. Agriculture 2021, 11, 999.
                                          Keywords: crop detection; machine learning; satellite image classification
https://doi.org/10.3390/agriculture
11100999

Academic Editors: Maciej Zaborowicz       1. Introduction
and Dawid Wojcieszak                            The aim of this paper is to systematise the present achievements in the field of crop and
                                          arable land recognition with use of multitemporal classification based on machine learning
Received: 24 August 2021                  algorithms using optical satellite images. Recognition and classification of different crops
Accepted: 7 October 2021                  in a particular area and environmental conditions involves the accuracy and optimalisation
Published: 13 October 2021
                                          of these processes. Such factors as crop types and agriculture structure, classifier methods,
                                          and optical sensors are the focus of this paper. Certain trends as well as indications of
Publisher’s Note: MDPI stays neutral
                                          further development and research directions, whose aim is to automatise crop identification
with regard to jurisdictional claims in
                                          processes, transpire from the projects and implementation experience described so far.
published maps and institutional affil-
                                                Research and studies into arable areas could be categorised into three main groups
iations.
                                          depending on spatial resolution of data. The first category consists in monitoring change
                                          and its dynamics in arable land on a continental scale with a resolution of 1 km, with use
                                          of data from sensors such as, for instance, NOAA/AVHRR, VEGETATION, MODIS [1,2].
                                          The second category includes studies into identification and classification of crop types,
Copyright: © 2021 by the author.          conducted on a regional scale [3]. Currently, this approach is frequently adopted by
Licensee MDPI, Basel, Switzerland.
                                          scientists and developers using widely available data of medium resolution of several
This article is an open access article
                                          dozen metres, which is still called high resolution (for instance SPOT or Sentinel-2 of 10 m
distributed under the terms and
                                          to 60 m resolution or Landsat of 30 m resolution). The third category in the context of
conditions of the Creative Commons
                                          spatial resolution consideration are studies with use of very high resolution imaging–of 1
Attribution (CC BY) license (https://
                                          m or less resolution, such as WorldView, QuickBird, Ikonos (Table 1), or aerial imaging of
creativecommons.org/licenses/by/
                                          several centimetres resolution [4]. Such data are mainly used for the purpose of local-scale
4.0/).

Agriculture 2021, 11, 999. https://doi.org/10.3390/agriculture11100999                                 https://www.mdpi.com/journal/agriculture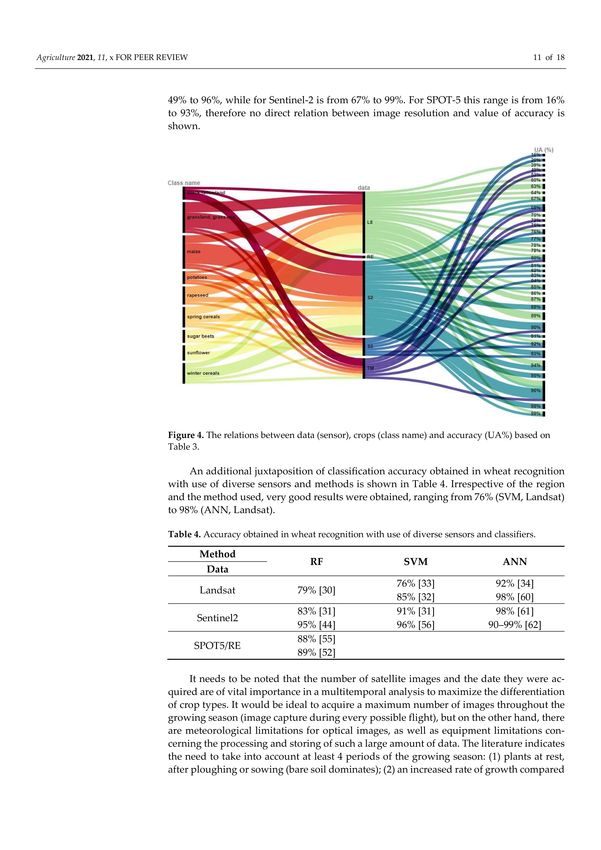
Agriculture 2021, 11, 999                                                                                              2 of 16

                            application in detection and monitoring of arable land and crop conditions at the detail
                            level, which is used to manage and plan agricultural production in a single farm, often
                            in combination with GIS and GPS technologies in precision agriculture [3]. Research and
                            studies of the second category play a vital role in managing and monitoring vegetation
                            cover in arable land, providing answers to questions of what and where something is
                            cultivated [3]. This means recognition of the crop or land type along with a specification
                            of their location and boundaries. However, it needs to be emphasized that arable land is
                            characterised by high complexity, which means a great diversity of species and types as well
                            as dynamics of change related to the growing season or crop rotation [5]. All of these are
                            particularly important in the areas of the complex mosaic of crops and arable plots of varied
                            geometry and size. These factors, combined with a diversity of crop types, phenological
                            changes, agricultural practices, and environmental and climatic parameters result in a great
                            divergence and variability that need to be allowed for while establishing a model and prove
                            challenging in the automatic classification of images [6]. Hence, the issue of automatic crop
                            detection is a topical one, present in numerous studies undertaken in order to improve
                            quality and reliability. As a matter of fact, that consists in a search for methods allowing
                            high accuracy of intermediate results as well as final cartographic products. Numerous
                            global projects aiming at crop recognition with use of satellite images [7–9] make use of
                            machine learning classification algorithms.

                            Table 1. Sensors most frequently used to examine vegetation and identify crops in arable lands,
                            based on [3,10].

                                                                         Resolution
                                     Sensor                                      Multispectral Mode      Imaging Width
                                                      Panchromatic Mode
                                                                                 (Number of Bands)
                                  LR–category 1
                                  NOAA AVHRR                   -                   1 km/8 km (6)            2400 km
                                   (Vegetation]                -                     1.15 km (4)            2000 km
                                  MODIS/Terra                  -               250 m/500 m/1 km (36)        2330 km
                                  HR–category 2
                                     SPOT 1–4                 10 m                   20 m (3–4)              60 km
                                      SPOT 5               2.5 m/5 m                  10 m (4)               60 km
                                     SPOT 6–7                1.50 m                    6 m (4)               60 km
                                   Landsat 7–8                15 m                   30 m (6–8)             185 km
                                     Sentinel 2                 -               10 m/20 m/60 m (13)         290 km
                                    Gaofen 1–2                 2m                      8 m (4)               93 km
                                 VHR–category 3
                                      Ikonos                 0.82 m                       3.20 m (4)         11 km
                                    Quick Bird               0.65 m                       2.62 m (4)         16 km
                                      Geo Eye                0.46 m                       1.84 m (4)         15 km
                                  World View 1–3          0.46–0.31 m                  1.84–1.24 m (8)       13 km
                              Pleiades/Pleiades Neo      0.50 m/0.30 m                2 m/1.2 m (4/6)    20 km/14 km
                                    Super View               0.50 m                         2 m (4)          12 km

                                 The early commonly applied classification methods known as parametric or non-
                            parametric [11] were used to categorize land or crop types on the basis of single images.
                            This resulted mainly from the costliness and rareness of such imaging in the 1980s and
                            1990s, in addition to IT limits. More recent decades brought the development of methods
                            based on a combination of variability of the spectral reflection value with the crop growth
                            stage during the growing season [5]. This approach requires monitoring of changes in the
                            area during the season and establishing samples called spectro-temporal profiles which are
                            most frequently based directly on reflection values or on processed data e.g., vegetation
                            indices. These indices calculated from two bands (e.g., NDVI from red and infrared)
                            correlate well with biomass [3]. The value of such processed images indicates healthier or
                            more stressed vegetation and can be used to compare conditions of the same species at
                            different times in a year, in different years or growing in different areas in the same region
                            or same field [3].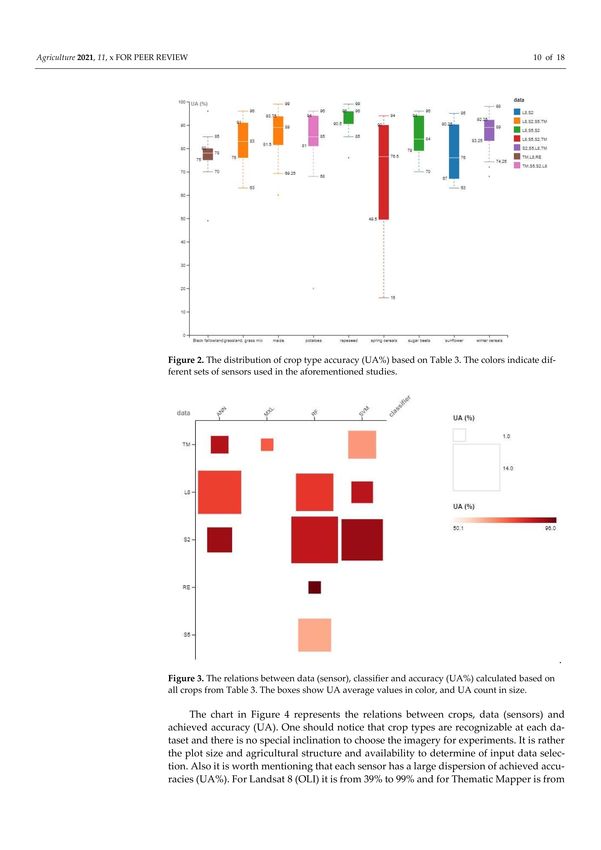
Agriculture 2021, 11, 999                                                                                            3 of 16

                                  The further progress in processing was to obtain a multitemporal image dataset,
                            whose timing coincides with changes typical of a specific crop type. It involves numerous
                            specific and variable features of the cultivation calendar as well as individual cases [5,6].
                            Hence, a difficulty of establishing appropriate patterns arises, not to mention a difficulty of
                            obtaining adequate imaging data or attempts at universalising or extrapolating the model
                            to other regions [5]. And this is where machine learning as an image classification approach
                            can be of help.
                                  The main aim of machine learning (ML) is to create an automated system able to
                            improve with use of the gained experience (here: imagery data) as well as to be able to
                            extrapolate the acquired knowledge [12] in order to crop recognition and classification.
                                  The idea of classification in the context of processing and analysing satellite images
                            implies data categorisation into defined groups. This group process can vary significantly,
                            depending on the various needs, including the need for thematic details, which means the
                            number of classes, or geometric details related to image spatial resolution. Classes that
                            should be classified into the same category exhibit certain physical features, most frequently
                            in the form of a spectral reflection registered in one or many spectral channels [11]. The
                            aim of a systematised and automated process of digital classification is to identify areas of
                            similar features, label them and assign them to a class. Automated classification methods
                            rely on defining the rules of assigning pixels to classes on the basis of their spectral
                            features [13], or in the case of crop detection on spectral and time feature space [14].
                                  The earliest methods of ML that were effectively used for remote sensing were known
                            as unsupervised and supervised classifications. In the supervised approach, the “machine”
                            otherwise algorithm is taught using samples (i.e., the training set) of the desired input
                            and output. The “machine” processes the input data to determine correlations and logic
                            which can be later used to predict results. After the identification of a logical pattern,
                            this can be applied to determine whether a given object belongs to a given class [12].
                            This spectro-temporal sample as a training set is a key issue of any algorithm [5,6,13].
                            Moreover, Vieira et al. involved the spectro-temporal response surface (STRS), which
                            provides for the generalization in time of spectral reflectance properties of agricultural
                            areas [14]. For unsupervised training, the analyst employs a computer algorithm that
                            locates concentrations of feature vectors within a heterogenous sample of pixels. These
                            so-called clusters are then assumed to represent classes in the image and are used to
                            calculate class signatures. They remain to be identified (labelled), however, they may not
                            correspond to classes of interest to the analyst [11]. Therefore it is rather rarely used for
                            crop identification, though some studies involved such approaches [5,14].
                                  Another aspect of crop identification, independent of the ML algorithm, concerns the
                            spatial unit, i.e., pixel or object (i.e., single parcel) [5]. Pixel-based methods often fail to
                            identify actual parcel boundaries [15], while spatial filters improve accuracy by removing
                            small inclusions within the dominant class [16].
                                  Although certain algorithms and image data combinations may produce good results in
                            specific land and crop type, they may perform poorly in other related applications [5,17,18]. In
                            this regard, the choice of data sets, sensors, and processing methods depends on the feasibility
                            and objectives of the crop identification study. The main goal of this paper is to compare the
                            results of ML methods used for crop recognition at the parcel level, especially in fragmented
                            areas. To the best of my knowledge, there is no comprehensive assessment of the progress
                            and challenges in crop types studies with a key focus on complex structure agricultural areas.
                            Consequently, there is a need to review the advancements in crop types detection methods,
                            especially using the most popular high resolution (HR) images. The paper also interrogates
                            the results from commonly used ML algorithms with respect to crop types, structure, and
                            parcel size achieved in recent studies.

                            2. Methods
                                The multitemporal classification of optical images approach was chosen from among
                            the many described in literature methods since it is reported as the effective one and to
Agriculture 2021, 11, 999 4 of 16
make possible the comparison of the results. The major research method was literature
review and analysis of the reported outcomes. The databases (e.g., Scopus, Google Scholar,
Web of Science, IEEE Xplore, ScienceDirect, MDPI, BazTech) were chosen to search for the
relevant literature. This choice was motivated by the extensive numbers of publications as
well as advanced tools for literature analysis. Queries covering all possible combinations of
terms related to optical satellite sensors, arable land and crop classification methods were
used and returned over 50 articles from 1995 to 2021. The majority of the papers (almost
30) are dated from 2014–2018. The most popular journals are Remote Sensing (11 papers),
Computers and Electronics in Agriculture (6), International Journal of Applied Earth
Observation and Geoinformation (5), and ISPRS publishing (6 papers). A few papers were
found in the IEEE Journal of Selected Topics in Applied Earth Observations and Remote
Sensing (3 papers), the International Journal of Remote Sensing (3), Remote Sensing of
Environment (2), and Machine Learning (2 papers). Besides the peer-reviewed papers, in
this research some other types of publication were included: one Master’s thesis and four
reports or information on the internet. Most of the reviewed articles are case studies on the
topic of crop type classification using optical and radar data. In addition to the reviewed
case studies, literature on remote sensing data and ML algorithms were analysed. These
research and review publications were mainly used as information sources to describe
the methodological context and background of the above-mentioned topics but were not
included in the systematic review.
In the last decade the interest in machine learning (ML) methods in crop detection
increased, especially using time-series images [5,6,14,17,18]. Therefore the literature review
covers several recent years, mainly but not only the period since 2010. Earlier efforts before
1995, though vital in development of currently used crop and arable land recognition
algorithms, are already historical studies and therefore not the subject of this paper. During
the last 20 years, the most focus went to study and adjust the classifiers using multitemporal
data as much as possible.
A state of the art review indicates main areas of interest for research groups so far
concerning the development of algorithmics in automation processes of crop and arable
land recognition and the quality increase of these processes (here: increase in accuracy
of the products of these processes). The most frequent statistics describing the accuracy
of classification are adopted from Congalton [19], and they are estimated based on an
error matrix. Overall Accuracy (OA) for classification itself, and User’s Accuracy (UA) for
particular classes (crops) dominate in the publications, therefore these will be used in the
next paragraphs to compare the results of classification. The results were juxtaposed in the
tables and displayed in figures as an alluvial chart, box plot and matrix plot.
3. Results
In this chapter, the results of crop detection using multitemporal optical images were
compared. The technical issues like classifiers and image sensors were considered as were
the environmental issues i.e., crop types and agricultural structure.
Analysis of the bibliography available on the subject indicates considerable inter-
est in some particular supervised algorithms: Random Forests–RF [20], Support Vector
Machine–SVM [21] and Artificial Neural Network–ANN [22] successfully used in satel-
lite images classification [23]. A steady increase in interest in supervised methods of
multitemporal classification of vegetation classes [5,24] or topographic objects identifica-
tion [25,26] can be seen as well. The automated crop and arable land recognition based on
multitemporal classification includes methods such as RF [17,27–30], SVM [16,17,28,31–33],
ANN [28,34–36]. Other methods, such as maximum likelihood algorithm–MXL [5,24,37] or
K-Means algorithm [5] are still used, mostly to compare the classification results. There
are a lot of aspects affecting the performance of the classification: chosen classification
method, spectral characteristic similarities of the crops [33] or biophysical variables [38]
and weather conditions, such as cloudiness [39], temperature and precipitation of the study
area [6]. Therefore, an identification method working well in one agro-region, i.e., an areaAgriculture 2021, 11, 999 5 of 16
with similar climate, soil and agro-technical conditions, cannot be assumed to work as
well in another, different environment [6]. The final result of classification depends not
only on the selected method of data processing but also on many other factors such as
input satellite data type and acquisition period, quality of the training data, plant species
or arable land structure. Therefore it is difficult to discuss the merits of any method in
comparison with others. However, the previous mentioned classifier, that is RF, ANN
and SVM, yield very good results. Since they are very common in use for multitemporal
classification, their accuracy will be discussed, paying special attention to the dominant
crops and agricultural structure.
3.1. Approach to Classification
Since both elements input images and the type of classifier establish an approach to
classification, their results will be considered together.
Both pixel and object approach for crop classification are frequently used. The choice
depends on the availability of software of the OBIA type [40] and the ability to generate
reference boundaries for the crops [34]. However, the pixel approach seems to dominate,
followed with aggregation of the classification result related to the plot. Extra filters are
frequently used in the final processing stage in order to smooth and remove single random
pixels [18]. The parcel-based approaches have been found to be more accurate than the
pixel-based approaches [41]. The field boundaries can be derived from the digital vector
database [42] or by segmentation [43]. The accuracy of the results is also affected by
the image processing unit (i.e., pixel or object). In mixed agriculture landscapes, image
segmentation methods seem to provide a significant advantage, as different types of land
use have different functions and at the same time are similar spectrally [44].
Although the weather can make the crop development start earlier or later, so too are
the amount and correct timing images important factors for crop identification [6]. There
are also some unique approaches to classification, such as using single date imagery [45] or
pre-harvest images [46]. Nevertheless, most of the studies are based on time-series data
from the whole growing season.
The most popular satellite images used for crop recognition are Landsat and Sentinel-2
due primarily to the open and easy access to the data. Another reason is the parameters of
these systems: spatial and spectral resolution and temporal resolution i.e., time of revisits.
Today, the access to this data and processing tools is even faster and less complicated
since both data and software are incorporated within single services e.g., DIAS–Data and
Information Access Services [47], the Google Earth Engine [48] or even through the open-
access software [49,50]. The other remote sensing systems i.e., SPOT, Pleiades, RapidEye,
or commercial VHR systems are not so common in use due to the price and small area
of acquisition [3]. For instance, Landsat image covers an area 180 km by 180 km, while
WorldView-2 is 16 km by 16 km only (Table 1). Again, it is much faster is to process a
single image for a big area at once rather than to process mosaics of the images acquired on
different dates [13].
Table 2 presents crop classification results obtained with use of RF, SVM, ANN, and
MXL, the most popular techniques and diverse satellite data. Countries (as research
areas) in bold type are the ones where small-holdings and complex agricultural structure
dominate. The results are presented from the lowest to highest accuracy within each
method and for each sensor separately. The overall accuracy level of classification results
in Landsat images (TM, ETM+, OLI) ranges from 70% (Tasmania, MXL) to 92% (Iran, SVM),
in Sentinel-2 images from 77% (South Africa, SVM) to 98% (China, ANN), and in SPOT-5
or RapidEye images from 74% (Pakistan, RF) to 95% (China, ANN). This range seems
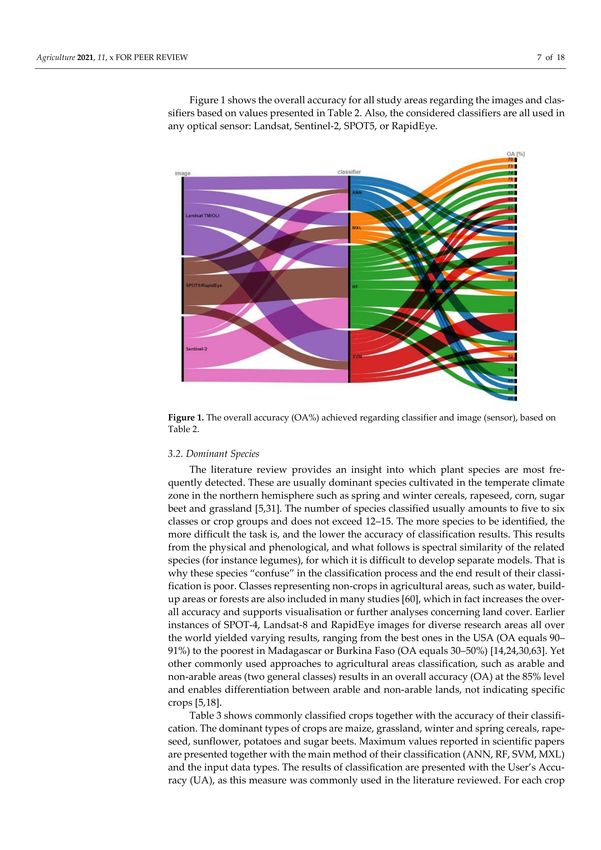
relatively stable regardless the method. On Figure 1 one can notice that RF classifier ranges
from 74–96%, MXL varies from 70% to 92%, while SVM is from 82% to 92%. The best
results are found by the ANN method, which reaches the accuracy of 85–98% for Ukraine
and China, respectively, and this method is on top of other classifiers.Agriculture 2021, 11, 999 6 of 16
Table 2. The best overall accuracy (OA) of crop classification with machine learning methods and the
area of research from selected publications. “Small-holdings” in bold type.
Landsat TM/ETM/OLI Sentinel-2, S2 + L8 Country SPOT5/RapidEye
Classifier
Country [Reference] [Reference] Country [Reference]
79% Poland [51] 80% Mali [27] 74% Pakistan [45]
83% Austria [52]
90% France [45] 86% Uzbekistan [54]
96% Austria [53]
RF 87% Germany [55]
90% Argentina [30] 84% India [45]
87% Luxemburg [55]
94% France, Belgium,
90% South Africa [30] 86–91% Poland [51]
Ukraine [18]
90% USA [30] 89% Spain [31]
89% Japan [56]
84% Portugal [33] 83% South Africa [46] 87% Turkey [57]
86% France, China [17] 82% India [45] 90% USA [16]
SVM
90% Argentina, South Africa,
91% Spain [31]
USA [17]
92% Iran [32] 91% Japan [56]
85% Ukraine [34] 91% Finland [58] 95% China, Gaofen1–2 [59]
ANN 86% Ukraine [60] 96% Italy [61]
89% Canada [36] 98% China [62]
70% Tasmania [63] 89% China [64] 78% Turkey [65]
MXL 73% Germany [6] 86% USA [16]
90% Canada [24] 92% Canada [45]
Figure 1. The overall accuracy (OA%) achieved regarding classifier and image (sensor), based on
Table 2.
In the research areas characterised by great fragmentation of plots, these values vary
from 83% (Austria) to 89% (Spain) for the RF method, while for the SVM method it is
slightly higher and reaches 84% (Portugal) to 91% (Spain). Overall there is no significant
difference between results on complex and any other areas in respect to the classifiers.
Another observation for this type of fragmented structure of plots concerns the images. The
classification has better accuracy on the Sentinel-2, where the range is 83% to 96% (Austria)
and on SPOT-5, which reaches 87% (Germany, Luxemburg). This range is similar to the
accuracies for any other areas; for Sentinel-2 it ranges from 80% (Mali) to 98% (China),
and for SPOT-5 from 74% (Pakistan) to 95% (China). For Landsat, these accuracies for
complex areas are somewhat worse, from 79% (Poland) to 84% (Portugal). In comparisonAgriculture 2021, 11, 999 7 of 16
with the accuracies in any other area, OA is lower approximately about 10% (i.e., from 85%
in Ukraine to 92% in Iran).
Figure 1 shows the overall accuracy for all study areas regarding the images and
classifiers based on values presented in Table 2. Also, the considered classifiers are all used
in any optical sensor: Landsat, Sentinel-2, SPOT5, or RapidEye.
3.2. Dominant Species
The literature review provides an insight into which plant species are most frequently
detected. These are usually dominant species cultivated in the temperate climate zone in
the northern hemisphere such as spring and winter cereals, rapeseed, corn, sugar beet and
grassland [5,31]. The number of species classified usually amounts to five to six classes
or crop groups and does not exceed 12–15. The more species to be identified, the more
difficult the task is, and the lower the accuracy of classification results. This results from
the physical and phenological, and what follows is spectral similarity of the related species
(for instance legumes), for which it is difficult to develop separate models. That is why
these species “confuse” in the classification process and the end result of their classification
is poor. Classes representing non-crops in agricultural areas, such as water, build-up
areas or forests are also included in many studies [60], which in fact increases the overall
accuracy and supports visualisation or further analyses concerning land cover. Earlier
instances of SPOT-4, Landsat-8 and RapidEye images for diverse research areas all over
the world yielded varying results, ranging from the best ones in the USA (OA equals
90–91%) to the poorest in Madagascar or Burkina Faso (OA equals 30–50%) [14,24,30,63].
Yet other commonly used approaches to agricultural areas classification, such as arable and
non-arable areas (two general classes) results in an overall accuracy (OA) at the 85% level
and enables differentiation between arable and non-arable lands, not indicating specific
crops [5,18].
Table 3 shows commonly classified crops together with the accuracy of their classi-
fication. The dominant types of crops are maize, grassland, winter and spring cereals,
rapeseed, sunflower, potatoes and sugar beets. Maximum values reported in scientific
papers are presented together with the main method of their classification (ANN, RF, SVM,
MXL) and the input data types. The results of classification are presented with the User’s
Accuracy (UA), as this measure was commonly used in the literature reviewed. For each
crop classification, results were ordered from the poorest to the best results obtained. The
RF method yielded the poorest results for spring cereals (16%) and potatoes (20%), while
the SVM method yielded highly accurate results for the same crops: 90% for spring cereals
and 94% for potatoes. Cited accuracy for other crops are usually within a range from
60% (maize, grasslands, sunflower) up to even 99% (rapeseed, maize). Juxtaposing the
results for various crops it is possible to notice that the accuracy divergence is high and it
is difficult to find a correlation between specific crops, classification method or data type.
Since Table 3 itself is rather extensive to facilitate its interpretation, Figures 2–4 illus-
trate the results and relations between crops, data (sensor), classifier, and accuracy. They
show that classifiers achieve similar accuracy regardless of the type of crops (Figure 2). The
majority of the crops reach the User Accuracy (UA) value from 60% to 99% with the median
at the 87% level. Spring cereals group different kinds of cereals, hence this large variation
of results from 50% to 90%. The best and the most consistent results were reported for
rapeseed (from 90% to 96% of UA). Figure 2 summarizes a quantitative distribution with
five standard statistics: the smallest value, lower quartile, median, upper quartile, and
largest value.Agriculture 2021, 11, 999 8 of 16
Table 3. Dominant arable land classes in given areas and the User’s Accuracy (UA) of their classification, together with
the classification method: ANN, RF, SVM, MXL and the sensor types: L8—Landsat-8 (OLI), S2—Sentinel-2, TM and
ETM—Landsat, S5—Spot-5.
Class Name Maize
UA (%) 60% 77% 80% 88% 92% 93% 87% 89% 98% 99% 82% 90% 96%
Classifier RF RF RF RF RF RF ANN ANN ANN ANN SVM SVM SVM
L8 S2 S2 S2 S5 S2 L8 L8 S2 S2 S2 TM S2
Data [source]
[30] [52] [56] [27] [55] [31] [34] [60] [61] [62] [66] [33] [31]
Class name Grassland
UA (%) 76% 77% 91% 93% 63% 68% 89% 68% 80% 83% 94% 96%
Classifier RF RF RF RF ANN ANN ANN SVM SVM SVM SVM SVM
L8 S2 S2 S5 L8 S2 L8 TM L8 S2 S2 S2
Data [source]
[30] [31] [56] [55] [60] [61] [34] [33] [32] [31] [56] [46]
Class name Winter cereals
UA (%) 98% 68% 88% 92% 93% 72% 87% 90%
Classifier ANN RF RF RF RF SVM SVM SVM
S2 S5 S2 L8 S2 TM L8 S2
Data [source]
[58] [55] [31] [51] [52] [33] [32] [31]
Class name Spring cereals
UA (%) 39% 64% 16% 89% 90% 94% 53% 90%
Classifier ANN ANN RF RF RF RF SVM SVM
L8 L8 S5 L8 S2 S2 TM S2
Data [source]
[34] [60] [55] [51] [31] [58] [33] [31]
Class name Rapeseed
UA (%) 76% 86% 95% 96% 96% 99% 96%
Classifier RF RF RF RF ANN ANN SVM
S5 L8 S2 L8 L8 L8 S2
Data [source]
[55] [51] [31] [30] [60] [34] [31]
Class name Sunflower
UA (%) 67% 85% 63% 67% 92% 95%
Classifier ANN ANN RF RF RF SVM
L8 L8 L8 S2 S2 S2
Data [source]
[60] [34] [30] [52] [31] [31]
Class name Black fallow land
UA (%) 80% 75% 78% 96% 49%
Classifier ANN MXL RF RF SVM
TM TM L8 RE TM
Data [source]
[14] [24] [30] [54] [33]
Class name Potatoes
UA (%) 96% 20% 81% 85% 94%
Classifier ANN RF RF SVM SVM
TM S5 S2 S2 L8
Data [source]
[14] [55] [56] [56] [32]
Class name Sugar beets
UA (%) 70% 94% 79% 84% 96%
Classifier ANN ANN RF RF SVM
L8 L8 L8 S5 S2
Data [source]
[60] [34] [51] [55] [56]
Figure 3 shows the aggregation of User’s Accuracy (boxes) as an average value in
relation to images (vertical axis), and classifiers (horizontal axis). User Accuracy in percent
(UA) was averaged for all crops and displayed from the lowest value (light colors) to the
highest value (dark red). The count of UA value for crop types describing in the reviewed
literature is shown as the size of square (from 1 to 14 as maximum). The best single result
was achieved using the RF method on the RapidEye dataset for black fallow land. Since this
value refers to single measure it cannot be used for comparison (similar to MXL method
on TM for black fallow as well). The best mean values reached were for crops classified
by SVM in Sentinel-2 time series images. The poorest results were indicated for crops
classified by RF in SPOT-5 images similar to SVM in Thematic Mapper (TM) images on a
50% level.Agriculture 2021, 11, 999 9 of 16
Figure 2. The distribution of crop type accuracy (UA%) based on Table 3. The colors indicate different
sets of sensors used in the aforementioned studies.
Figure 3. The relations between data (sensor), classifier and accuracy (UA%) calculated based on all
crops from Table 3. The boxes show UA average values in color, and UA count in size.
The chart in Figure 4 represents the relations between crops, data (sensors) and
achieved accuracy (UA). One should notice that crop types are recognizable at each dataset
and there is no special inclination to choose the imagery for experiments. It is rather the
plot size and agricultural structure and availability to determine of input data selection.
Also it is worth mentioning that each sensor has a large dispersion of achieved accuracies
(UA%). For Landsat 8 (OLI) it is from 39% to 99% and for Thematic Mapper is from 49% toAgriculture 2021, 11, 999 10 of 16
96%, while for Sentinel-2 is from 67% to 99%. For SPOT-5 this range is from 16% to 93%,
therefore no direct relation between image resolution and value of accuracy is shown.
Figure 4. The relations between data (sensor), crops (class name) and accuracy (UA%) based on
Table 3.
An additional juxtaposition of classification accuracy obtained in wheat recognition
with use of diverse sensors and methods is shown in Table 4. Irrespective of the region and
the method used, very good results were obtained, ranging from 76% (SVM, Landsat) to
98% (ANN, Landsat).
Table 4. Accuracy obtained in wheat recognition with use of diverse sensors and classifiers.
Method
RF SVM ANN
Data
76% [33] 92% [34]
Landsat 79% [30]
85% [32] 98% [60]
83% [31] 91% [31] 98% [61]
Sentinel2
95% [44] 96% [56] 90–99% [62]
88% [55]
SPOT5/RE
89% [52]
It needs to be noted that the number of satellite images and the date they were acquired
are of vital importance in a multitemporal analysis to maximize the differentiation of crop
types. It would be ideal to acquire a maximum number of images throughout the growing
season (image capture during every possible flight), but on the other hand, there are
meteorological limitations for optical images, as well as equipment limitations concerning
the processing and storing of such a large amount of data. The literature indicates the
need to take into account at least 4 periods of the growing season: (1) plants at rest, after
ploughing or sowing (bare soil dominates); (2) an increased rate of growth compared to
natural vegetation; (3) the culmination moment of growth–maturity; and (4) a decrease in
biomass–harvest and withering [5,6].Agriculture 2021, 11, 999 11 of 16
3.3. Structure and Size of Agricultural Plots
Classification of large plots, i.e., the size above 50 ha, based on the data from Landsat-8
yielded varying accuracy levels (OA range of 60–90%) depending on the method used
and the character and structure of the area [28,35,37,66]. Classification for small plots,
as conducted in Poland, indicates an overall accuracy of 77–89% [51], when SAR images
were used the results reached as high as88% [29,35,67,68]. A similar to Polish fragmented
agricultural structure and similar classification results were noted in Austria and Portugal,
where the overall accuracy was of 76–83% in Austria [52] and 68–84% in Portugal [33].
Comparing these results (Table 2) one should notice that the agricultural structure is an
important variable that makes an impact on the accuracy and feasibility of crop classifica-
tion. Certain initiatives have been undertaken to resolve such problems all over the world
independently of agricultural structure and size of plots. Their results can be seen in the
open access software Sen2Agri and Sen4CAP used for crop classification developed in the
ESA projects [69,70] and the OneSoil Map service [71]. The data published by OneSoil come
from the satellite images supplied by the ESA on free-access service for Sentinel-2. 24 crops
are identified with the accuracy of F1 = 0.91 with use of a neural networks algorithm in this
service. The data included in the map include crop name, location, size, as well as the crop
size estimate for the whole country. Machine learning algorithms identify crop boundaries
with an accuracy of up to five metres [71]. Yet, these systems have limitations and can be
used to give an overview of the distribution of crops for smallholders where the width of a
parcel is sometimes 10 m or less [51,72].
4. Discussion
As was previously mentioned, it is difficult to compare the classification results
due to differences in cultivation methods or agricultural features of the studied areas.
Moreover, examples of multi-site assessments, which compare the performances of the
same classification method in different agro-systems, are very scarce [5]. Examination of
the accuracy of automated crop identification is closely related to the specific features of the
regions and the specific kinds of crops, so that is why the results tend to be unique. Hence,
the analysis of the results achieved on arable land classification with the use of optical data
has limitations. To make feasible the comparison of the outcomes, the review included only
the main optical image sensors the Landsat (18 out of 46 studies), Sentinel-2 (15), SPOT-5
and RapidEye (together 13 out of 46). Although Landsat images are still the most popular
in crop recognition, areas with small-holdings and fragmented structures are preferably
analysed in Sentinel-2, SPOT5, or RapidEye images because of the spatial resolution and
better accuracy, e.g., in Spain OA reached the level of 89–91% [31], in Luxemburg 87% [55]
(Table 2). Still, it is a little lower than on large plots. For example in Ukraine where the
dominant field area is approx. 50 ha, 94% of OA was achieved using SPOT-5 [45], and 90%
of OA in the USA [16] and Canada [36]. There are also interesting studies in Germany using
Landsat TM/ETM showing 73% of OA [6] while using SPOT5 and RapidEye 87% [55].
The most popular classifiers were Random Forests (20 studies), Support Vector Ma-
chine (12), Artificial Neural Network (8), and Maximum Likelihood (8), taking into account
an agricultural structure as well. It should notice a slight dominance of RF methods more of-
ten chosen for such regions (Table 2). Results from this classifier achieve OA from 79% [51]
to 90% [30] using Landsat, from 80% [27] to 89% [31,56] using Sentinel-2, and from 74% [18]
to 94% [45] on SPOT5. Using the SVM classifier, the OA was from 84% [33] to 92% [32] on
Landsat, from 83% [46] to 91% [56] on Sentinel-2, and from 87% [57] to 90% [16] on SPOT5.
For ANN, outcomes were 85% [34] to 89% [36] on Landsat and 91% [58] to 98% [62] on
Sentinel-2. Maximum Likelihood classifier was normally used to compare the results from
other classifiers and has lower OA values (about 4–5 percent) [6,16,64].
It was not considered in the time range of acquired images, since each study area had a
specific, adjusted and feasible timeline. However, the earlier the estimation (ideally before
the harvest), the more efficient the management [5]. The results discussed in Valero [18]
showed that the cropland extent accuracy increased when the number of images increasedAgriculture 2021, 11, 999 12 of 16
through the agricultural season. The real-time classification results yielded accuracies
around 80% in the middle of the season and approximately 90% at the end of the season.
The impact of missing observations in some periods of the year was also found to be
a serious limiting factor [18]. The number and timing of image acquisition is crucial to
distinguishing crop types [6].
There are also no evident findings if the number of crops have an influence on classifi-
cation accuracy. It is rather a case of the particular agricultural structure than the number
of crop types. However, it should be noticed that the overall accuracy is higher if the list
of crops is shorter. For instance, Valero et al. reported 90% of accuracy for crop/non-crop
mapping on 12 different test sites spread across the globe [18]. While in Poland, classifi-
cation of 19 classes resulted with 89% of overall accuracy [51], and in Spain for 9 classes
the percentage was the same [31]. In Germany, classification of 12 types of crops reached
73% of OA [6]. The list of crops is different for different regions, but the most common
crop type is wheat. For this cereal, the best results above 90% of accuracy were achieved
using the ANN algorithm on Landsat [35,60], on Sentinel-2 [61,62], and using SVM [31,56]
or RF [56] on Sentinel-2 (Table 4). The other popular investigated crop types are maize,
rapeseed, potatoes, sugar beets, and grassland, with an average UA value between 83%
and 90%. Spring and winter cereals are very similar in results, reaching the average UA
value of 76% and maximum UA value at the 94–95% level.
It was observed that the investigated areas for crop mapping are focused on a specific
region of the world without comparing the effectiveness of their methodology in different
conditions. Only a few papers [5,17,18] that covered this topic tested their methods on
different areas. Differences in agronomic practices, field sizes, climatic differences, etc. are
major challenges for large-scale mapping tasks. Another reason may be that the availability
of training data for large areas and the spatial transferability of classification models
remain a problem. Nevertheless, machine learning methods prove useful in satellite image
classification for a few reasons. Most of all, these are universal algorithm systems mapping
multidimensional data sets (multispectral and multitemporal data). These algorithms are
capable of learning and adapting to the changing environment and choosing an ideal set
of parameters and their organisational structure to solve the task. Moreover, they are
capable of generalising the acquired knowledge and thereby enable the repeatability of
results [17,35]. Table 5 juxtaposes the most frequently cited advantages and disadvantages
of the three chosen machine learning algorithms: Random Forests (RF), Support Vector
Machine (SVM) and Artificial Neural Networks (ANN).
The results obtained do not depend on classifiers as much as they do on local envi-
ronmental conditions. Generally speaking, the more data, i.e., Landsat 8 plus Sentinel-2,
the higher accuracy and better chances of success [51,53]. However, larger data sets result
in higher data divergence and a higher potential for predictive error. On the other hand,
simpler models with a bigger amount of data seem better than more complex models with a
smaller amount of data. These constitute the basis for team modelling techniques using the
“collective power” to predict results [12,39]. Growing amounts of EO data, especially time
series collections, are accelerating advanced computing needs and capacities. Furthermore,
the increasing availability of computing platforms and geospatial analysis as a service are
major drivers of the advancement of crop mapping research. The continuous increase in
the number of scientific publications on the use of optical data to distinguish between types
of crops reflects the great advantage of multi-temporal analysis of data in terms of their
informative content for crop recognition [68].Agriculture 2021, 11, 999 13 of 16
Table 5. Most frequently cited advantages and disadvantages of chosen machine learning algorithms
used in crop classification in satellite images. Based on [27,39,51,55].
Algorithm Disadvantages Advantages
Effective for big data sets and small
amount of training samples;
Low sensitivity to the amount of data
input, resistance to “noise”;
Increase in the amount of training
Lack of overfitting (resistance to
data does not increase accuracy;
RF overtraining);
Difficulty interpreting the results;
Low number of parameters defined by
Variability of the results
the user;
Analysis of feature (variable)
importance;
Low computational requirements
Multitude of parameters to be
Accuracy even for a low number of
optimised;
training grounds, including mixels;
SVM Difficulty building a universal model;
Possibility of adjusting parameters to
Sensitivity to feature (variable) choice;
specific cases (optimisation)
High computational requirements
High tolerance to lack of data, weak
Long period of building and representation or noise interference in
optimising the network; the training data;
ANN Large training set required; Adaptive learning from the training
Relatively long computation process; data streams–minimising errors;
Possibility of “overtraining” Varied types of variables used in the
model
5. Conclusions
The current study has reviewed the literature on the progress of remote sensing
methods in recognition of crop types. Empirical evidence has shown that satellite images
offer invaluable data sources in crop identification at regional and local scales. However,
although the crop identification using ML methods results with very high accuracy (above
90%), the modelling of crops from remote sensing data remains a challenge in terms of
developing models that can be used efficiently in all environments. The general outcomes
from this study can be summarized as follows:
• There is no significant difference between the accuracy achieved from different ML
algorithms, yet on average the ANN classifier is better than the others by a few
percentage points.
• For complex, fragmented regions, better results were achieved using Sentinel-2 or
SPOT-5 rather than Landsat images, but the level of accuracy can still be improved.
• For areas with large plots there is no difference in the level of accuracy achieved from
any HR images.
Many studies prefer the simple and straightforward approach of layer-stacking and
multitemporal data analysis. There are still some problems to be considered, like advisable
temporal sequence of images versus data availability or expected number of crops versus
a number of possible identified classes. The spatial and temporal transferability of the
models still remains as one of the main issues. Future trends and possible development
directions in automated crop recognition might include the following:
• A multi-seasons approach dealing with an increasing number of images captured
over years;
• multi-sensor image fusion, optical and radar [29,67,68], or even satellite and aerial or
UAV data for large-scale mapping;
• the creation of training samples and processing automation archives into the universal
and repeatable models.Agriculture 2021, 11, 999 14 of 16
Even with considerable experience, developing machine learning applications is
still an experimental and iterative process, regardless of whether an already well-known
algorithm is used. In each case, the algorithm needs to be trained and tuned to the
agricultural context and image dataset. Machine learning is a powerful tool and is extremely
efficient when the user possesses the thorough knowledge of the agricultural structure.
Funding: This research received no external funding.
Institutional Review Board Statement: Not applicable.
Informed Consent Statement: Not applicable.
Data Availability Statement: No new data were created or analyzed in this study. Data sharing is
not applicable to this article.
Acknowledgments: The RAWGraphs application was used to create the graphs and charts.
Conflicts of Interest: The authors declare no conflict of interest.
References
1. Khan, M.R.; de Bie, C.A.J.M.; van Keulen, H.; Smaling, E.M.A. Disaggregating and mapping crop statistics using hypertemporal
remote sensing. Int. J. Appl. Earth Obs. Geoinf. 2010, 12, 36–46. [CrossRef]
2. Kowalik, W.; Dabrowska-Zielinska, K.; Meroni, M.; Raczka, U.T.; de Wit, A. Yield estimation using SPOT-VEGETATION products:
A case study of wheat in European countries. Int. J. Appl. Earth Obs. Geoinf. 2014, 32, 228–239. [CrossRef]
3. Aronoff, S. Remote Sensing for GIS Managers; ESRI Press: Redlands, CA, USA, 2005; pp. 338–348.
4. Bochenek, Z.; Ciołkosz, A.; Filipiak, K. Szacowanie powierzchni upraw z wykorzystaniem teledetekcji lotniczej i satelitarnej.
Fotointerpret. Geografii. Probl. Telegeoinformacji 2000, 31, 129–136.
5. Matton, N.; Sepulcre Canto, G.; Waldner, F.; Valero, S.; Morin, D.; Inglada, J.; Arias, M.; Bontemps, S.; Koetz, B.; Defourny, P. An
Automated Method for Annual Cropland Mapping along the Season for Various Globally-Distributed Agrosystems Using High
Spatial and Temporal Resolution Time Series. Remote Sens. 2015, 7, 13208–13232. [CrossRef]
6. Foerester, S.; Kaden, K.; Foerester, M.; Itzerott, S. Crop type mapping using spectral-temporal profiles and phenological
information. Comput. Electron. Agric. 2012, 89, 30–40. [CrossRef]
7. Atzberger, C. Advances in Remote Sensing of Agriculture: Context Description, Existing Operational Monitoring Systems and
Major Information Needs. Remote Sens. 2013, 5, 949–981. [CrossRef]
8. Dabrowska-Zielinska, K.; Meroni, M.; Atzberger, C.; Léo, O. Monitoring agriculture and agri-environmental conditions with
Earth Observation. Int. J. Appl. Earth Obs. Geoinf. Pref. Spec. Issue 2014.
9. Devos, W.; Fasbender, D.; Lemoine, G.; Loudjani, P.; Milenov, P.; Wirnhardt, C. Disscusion Document on the Introduction of Monitoring
to Substitute OTSC; JRC Technical Report DS/CDP/2017/03; Publications Office of the European Union: Luxembourg, 2017.
10. eoPortal. Available online: https://earth.esa.int/web/eoportal/satellite-missions/ (accessed on 30 May 2021).
11. Schowengerdt, R.A. Remote Sensing. Models and Methods for Image Processing, 3rd ed.; Elsevier Academic Press: Burlington, MA,
USA, 2007; pp. 387–427.
12. Rudin, C. Stop Explaining Black Box Machine Learning Models for High Stakes Decisions and Use Interpretable Models Instead.
Nat. Mach. Intell. 2019, 1, 206–215. [CrossRef]
13. Jensen, J.R. Introductory Digital Image Processing. A Remote Sensing Perspective, 4th ed.; Pearson: London, UK, 2016; pp. 361–457.
14. Vieira, C.A.O.; Mather, P.; Aplin, P. Agricultural Crop Classification Using the Spectral-Temporal Response Surface. In Proceedings
of the Anais XI SBSR, Belo Horizonte, Brasil, 5–10 April 2003; pp. 255–262.
15. Ormeci, C.; Alganci, U.; Sertel, E. Identification of Crop Areas using SPOT-5 Data. In Proceedings of the FIG Congress, Sydney,
NSW, Australia, 11–16 April 2010; pp. 1–12.
16. Yang, C.; Everitt, J.H.; Murden, D. Evaluating high resolution SPOT 5 satellite imagery for crop identification. Comput. Electron.
Agric. 2011, 75, 347–354. [CrossRef]
17. Inglada, J.; Arias, M.; Tardy, B.; Hagolle, O.; Valero, S.; Morin, D.; Dedieu, G.; Sepulcre, G.; Bontemps, S.; Defourny, P.; et al.
Assessment of an Operating System for Crop Type Map Production Using High Temporal and Spatial Resolution Satellite Optical
Imagery. Remote Sens. 2015, 7, 12356–12379. [CrossRef]
18. Valero, S.; Morin, D.; Inglada, J.; Sepulcre, G.; Arias, M.; Hagolle, O.; Dedieu, G.; Bontemps, S.; Defourny, P.; Koetz, B. Production
of a Dynamic Cropland Mask by Processing Remote Sensing Images at High Temporal and Spatial Resoluion. Remote Sens. 2016,
8, 55. [CrossRef]
19. Congalton, R.G.; Green, K. Assessing the Accuracy of Remotely Sensed Data. Principles and Practices, 2nd ed.; CRC Press, Taylor &
Francis Group: New York, NY, USA, 2009.
20. Breiman, L. Random Forests. Mach. Learn. 2001, 45, 5–32. [CrossRef]
21. Cortes, C.; Vapnik, V. Support-vector networks. Mach. Learn. 1995, 20, 273–297. [CrossRef]Agriculture 2021, 11, 999 15 of 16
22. Rumelhart, D.E.; Hinton, G.E.; Williams, R.J. Learning Internal Representation by Error Propagation. Parallel Distributed Processing:
Explorations in the Microstructure of Cognition; MIT Press: Cambridge, MA, USA, 1986; Volume I, pp. 318–362.
23. Belgiu, M.; Dragut, L. Random forest in remote sensing: A review of applications and future directions. ISPRS J. Photogramm.
Remote Sens. 2016, 114, 24–31. [CrossRef]
24. Brisco, B.; Brown, R.J. Multidate SAR/TM Synergism for Crop Classification in Western Canada. Photogramm. Eng. Remote Sens.
1995, 61, 1009–1014.
25. Blaschke, T.; Lang, S.; Lorup, E.; Strobl, J.; Zeil, P. Object-oriented image processing in an integrated GIS/remote sensing
environment and perspectives for environmental applications. Environ. Inf. Plan. Politics Public 2000, 2, 555–570.
26. Blaschke, T. Object based image analysis for remote sensing. ISPRS J. Photogramm. Remote Sens. 2010, 65, 2–16. [CrossRef]
27. Lambert, M.-J.; Traore, P.C.S.; Blaes, X.; Defourny, P. Estimating smallholder crops production at village level from Sentinel-2 time
series in Mali’s cotton belt. Remote Sens. Environ. 2018, 216, 647–657. [CrossRef]
28. Shelestov, A.; Lavreniuk, M.; Kolotii, A.; Vasiliev, V.; Shumilo, L.; Kussul, N. Cloud Approach to Automated Crop Classification
using Sentinel 1 Imagery. In Proceedings of the Conference on Big Data from Space (BiDS’17), Toulouse, France, 28–30 November
2017; p. 122.
29. Grabska, E. Ocena możliwości wykorzystania satelitarnych danych optycznych i radarowych do identyfikacji typów użytków
rolnych. Pr. Geogr. 2017, 148, 135–155. [CrossRef]
30. Inglada, J.; Vincent, A.; Arias, M.; Marais-Sicre, C. Improved Early Crop Type Identification by Joint Use of High Temporal
Resolution SAR and Optical Image Time Series. Remote Sens. 2016, 8, 362. [CrossRef]
31. Sitokonstantinou, V.; Papoutsis, I.; Kontoes, C.; Arnal, A.L.; Armesto Andrés, A.P.; Garraza Zurbano, J.A. Scalable Parcel-Based
Crop Identification Scheme Using Sentinel-2 Data Time-Series for the Monitoring of the Common Agricultural Policy. Remote
Sens. 2018, 10, 911. [CrossRef]
32. Asgarian, A.; Soffianian, A.; Pourmanafi, S. Crop type mapping in a highly fragmented and heterogeneous agricultural landscape:
A case of central Iran using multi-temporal Landsat 8 imagery. Comput. Electron. Agric. 2016, 127, 531–540. [CrossRef]
33. Schmedtmann, J.; Campagnolo, M.L. Reliable Crop Identification with Satellite Imagery in the Context of Common Agriculture
Policy Subsidy Control. Remote Sens. 2015, 7, 9325–9346. [CrossRef]
34. Kussul, N.; Lemoine, G.; Gallego, J.; Skakun, S.; Lavreniuk, M. Parcel Based Classification for Agricultural Mapping and
Monitoring using Multi-Temporal Satellite Image Sequences. In Proceedings of the International Geoscience and Remote Sensing
Symposium (IGARSS), Milan, Italy, 26–31 July 2015; pp. 165–168. [CrossRef]
35. Stankiewicz, K. The Efficiency of Crop Recognition on ENVISAT ASAR Images in Two Growing Seasons. IEEE Trans. Geosci.
Remote Sens. 2006, 44, 806–814. [CrossRef]
36. Ban, Y. Synergy of Multitemporal ERS-1 SAR and Landsat TM Data for Classification of Agricultural Crop. Can. J. Remote Sens.
2003, 29, 518–526. [CrossRef]
37. Iannini, L.; Molijn, R.A.; Hanssen, R.F. Integration of Multispectral and C-Band SAR Data for Crop Classification. In Proceedings
of the SPIE Dresden, Germany, Remote Sensing for Agriculture, Ecosytems, and Hydrology XV, 16 October 2013; Volume 8887,
p. 88871D. [CrossRef]
38. Waldner, F.; Lambert, M.-J.; Li, W.; Weiss, M.; Demarez, V.; Morin, D.; Marais-Sicre, C.; Hagolle, O.; Baret, F.; Defourny, P. Land
cover and crop type classification along the season based on biophysical variables retrieved from multi-sensor high-resolution
time series. Remote Sens. 2015, 7, 10400–10424. [CrossRef]
39. Belgiu, M.; Csillik, O. Sentinel-2 cropland mapping using pixel-based and object-based time-weighted dynamic time warping
analysis. Remote Sens. Environ. 2018, 204, 509–523. [CrossRef]
40. Li, M.; Ma, L.; Blaschke, T.; Cheng, L.; Tiede, D. A systematic comparison of different object-based classification techniques using
high spatial resolution imagery in agricultural environments. Int. J. Appl. Earth Obs. Geoinf. 2016, 49, 87098. [CrossRef]
41. Ok, A.; Akar, O.; Gungor, O. Evaluation of random forest method for agricultural crop classification. Eur. J. Remote Sens. 2012, 45,
421–432. [CrossRef]
42. De Wit, A.; Clevers, J. Efficiency and accuracy of per-field classification for operational crop mapping. Int. J. Remote Sens. 2004, 25,
4091–4112. [CrossRef]
43. Castillejo-González, I.; López-Granados, F.; García-Ferrer, A.; Peña Barragán, J.; Jurado-Expósito, M.; de la Orden, M.; Gonzaález-
Audicana, M. Object—and pixel-based analysis for mapping crops and their agro-environmental associated measures using
QuickBird imagery. Comput. Electron. Agric. 2009, 68, 207–215. [CrossRef]
44. Marshall, M.; Husak, G.; Michaelsen, J.; Funk, C.; Pedreros, D.; Adoum, A. Testing a high-resolution satellite interpretation
technique for crop area monitoring in developing countries. Int. J. Remote Sens. 2011, 32, 7997–8012. [CrossRef]
45. Saini, R.; Ghosh, S.K. Crop classification on single date sentinel-2 imagery using random forest and suppor vector machine. In
Proceedings of the International Archives of the Photogrammetry, Remote Sensing & Spatial Information Sciences, Dehradun,
India, 20–23 November 2018. [CrossRef]
46. Maponya, M.G.; van Niekerk, A.; Mashimbye, Z.E. Pre-harvest classification of crop types using a Sentinel-2 time-series and
machine learning. Comput. Electron. Agric. 2020, 169, 105164. [CrossRef]
47. Data and Information Access Services. Available online: https://www.copernicus.eu/en/access-data/dias (accessed on
24 September 2021).
48. Google Earth Engine. Available online: https://earthengine.google.com/ (accessed on 24 September 2021).Agriculture 2021, 11, 999 16 of 16
49. QGIS. A Free and Open Source Geographic Information System. Available online: https://qgis.org (accessed on 24 September
2021).
50. STEP—Scientific Toolbox Exploitation Platform. Available online: https://step.esa.int/ (accessed on 24 September 2021).
51. Pluto-Kossakowska, J.; Pilarska, M.; Bartkowiak, P. Automatic detection of dominant crop types in Poland based on satellite
images. Artif. Satell. 2020, 55, 185–208. [CrossRef]
52. Immitzer, M.; Vuolo, F.; Atzberger, C. First Experience with Sentinel-2 Data for Crop and Tree Classifications in Central Europe.
Remote Sens. 2016, 8, 166. [CrossRef]
53. Vuolo, F.; Neuwirth, M.; Immitzer, M.; Atzberger, C.; Ng, W.T. How much does multi-temporal Sentinel-2 data improve crop type
classification? Int. J. Appl. Earth Obs. Geoinf. 2018, 72, 122–130. [CrossRef]
54. Conrad, C.; Dech, S.; Dubovyk, O.; Fritsch, S.; Klein, D.; Löw, F.; Zeidler, J. Derivation of temporal windows for accurate crop
discrimination in heterogeneous croplands of Uzbekistan using multitemporal RapidEye images. Comput. Electron. Agric. 2014,
103, 63–74. [CrossRef]
55. Stefanski, J.; Mack, B.; Waske, B. Optimization of object-based image analysis with Random Forests for land cover mapping. IEEE
J. Sel. Top. Appl. Earth Obs. Remote Sens. 2013, 6, 2429–2504. [CrossRef]
56. Sonobe, R.; Yamaya, Y.; Tani, H.; Wang, X.; Kobayashi, N.; Mochizuki, K. Crop classification from Sentinel-2-derived vegetation
indices using ensemble learning. J. Appl. Remote Sens. 2018, 12, 026019. [CrossRef]
57. Ustuner, M.; Sanli, F.B.; Abdikan, S.; Esetlili, M.T.; Kurucu, Y. Crop type classification using vegetation indices of RapidEye
imagery. In Proceedings of the The International Archives of the Photogrammetry, Remote Sensing and Spatial Information
Sciences, Istanbul, Turkey, 9 September–2 October 2014; Volume 40, pp. 195–198. [CrossRef]
58. Laine, J. Crop Identification with Sentinel-2 Satellite Imagery in Finland. Master’s Thesis, Aalto University, Espoo, Finland, July
2018. Available online: https://aaltodoc.aalto.fi/bitstream/handle/123456789/33726/master_Laine_Joona_2018.pdf?sequence=2
(accessed on 30 May 2021).
59. Ji, S.; Zhang, C.; Xu, A.; Shi, Y.; Duan, Y. 3D Convolutional Neural Networks for Crop Classification with Multi-Temporal Remote
Sensing Images. Remote Sens. 2018, 10, 75. [CrossRef]
60. Skakun, S.; Kussul, N.; Shelestov, A.; Lavreniuk, M.; Kassul, O. Efficiency Assessmnet of Multitemporal C-band Radarsat-2
Intensity and Landsat-8 Surface Reflectance Satellite Imagery for Crop Classification in Ukraine. IEEE J. Sel. Top. Appl. Earth Obs.
Remote Sens. 2016, 9, 3712–3719. [CrossRef]
61. Mazzia, V.; Khaliq, A.; Chiaberge, M. Improvement in Land Cover and Crop Classification based on Temporal Features Learning
from Sentinel-2 Data Using Recurrent-Convolutional Neural Network (R-CNN). Appl. Sci. 2019, 10, 238. [CrossRef]
62. Wang, Y.; Zhang, Z.; Feng, L.; Ma, Y.; Du, Q. A new attention-based CNN approach for crop mapping using time series Sentinel-2
images. Comput. Electron. Agric. 2021, 184, 106090. [CrossRef]
63. Barrett, R.; Crowther, P.; Laurence, R.; Lincolne, R. Agricultural Crop Identification Using Spot And Landsat Images In Tasmania.
Int. Arch. Photogramm. Remote Sens. 2000, 33, 133–139.
64. Feng, S.; Zhao, J.; Liu, T.; Zhang, H.; Zhang, Z.; Guo, X. Crop Type Identification and Mapping Using Machine Learning
Algorithms and Sentinel-2 Time Series Data. IEEE J. Sel. Top. Appl. Earth Obs. Remote Sens. 2019, 12, 3295–3306. [CrossRef]
65. Turker, M.; Ozdarici, A. Field-based crop classification using SPOT4, SPOT5, IKONOS and QuickBird imagery for agricultural
areas: A comparison study. Int. J. Remote Sens. 2011, 32, 9735–9768. [CrossRef]
66. Kussul, N.; Skakun, S.; Shelestov, A.; Lavreniuk, M.; Yailymov, B.; Kussul, O. Regional scale crop mapping using multi-temporal
satellite imagery. Int. Arch. Photogramm. Remote Sens. Spat. Inf. Sci. 2015, 40, 45. [CrossRef]
67. Mróz, M.; Ciołkowska, M. Porównanie możliwości identyfikacji upraw rolniczych na podstawie serii obrazów radarowych
ENVISAT/ASAR/IMG i APG oraz wielospektralnych obrazów SPOT XS/XI. Arch. Fotogram. Kartogr. I Teledetekcji 1999, 9,
201–215.
68. Orynbaikyzy, A.; Gessner, U.; Conrad, C. Crop type classification using a combination of optical and radar remote sensing data:
A review. Int. J. Remote Sens. 2019, 40, 6553–6595. [CrossRef]
69. Sen2Agri—Czech Agriculture National Demonstrator (CzechAgri) Final Report 20/02/2017. Available online: https://www.esa-
sen2agri.org/ (accessed on 30 March 2021).
70. Bontemps, S.; Bajec, K.; Cara, C.; Defourny, P.; De Vendictis, L.; Heymans, D.; Kucera, L.; Malcorps, P.; Milcinski, G.; Nicola,
L.; et al. Sen4CAP—Sentinels for Common Agricultural Policy. System Software User Manual. Sen4CAP_SUM_v1.2. ESA.
Available online: http://esa-sen4cap.org/sites/default/files/Sen4CAP_System-Software-User-Manual_v1.1.pdf (accessed on 20
December 2020).
71. Precision Farming Apps Based on Satellite Imagery and Machine Learning Technologies. Available online: https://onesoil.ai/
en/technologies (accessed on 30 May 2021).
72. Jaafar, H.H.; Ahmad, F.A. Crop yield prediction from remotely sensed vegetation indices and primary productivity in arid and
semi-arid lands. Int. J. Remote Sens. 2015, 36, 4570–4589. [CrossRef]You can also read