Shaping the Future of Mobility - European Parliamentary Technology Assessment - Mobility Pricing in Europe and beyond - Austrian Academy of Sciences
←
→
Page content transcription
If your browser does not render page correctly, please read the page content below
Shaping the Future of Mobility
              Mobility Pricing in Europe and beyond

European Parliamentary Technology Assessment

                  European Parliamentary Technology Assessment
Impressum

European Parliamentary Technology Assessment (EPTA) eptanetwork.org
Published in Bern, October 2017 (ed. TA-SWISS)
Online available at www.ta-swiss.ch
Layout and illustrations: Hannes Saxer, Bern
Printing: Jordi AG Das Medienhaus, Belp
European Parliamentary Technology Assessment
Contents
PREFACE 5
1. INTRODUCTION 7
2. AUSTRIA 9
3. CATALUNYA (SPAIN) 13
4. EUROPEAN UNION 17
5. FINLAND 21
6. FRANCE 27
7. GERMANY 31
8. GREECE 37
9. JAPAN 39
10. MEXICO 43
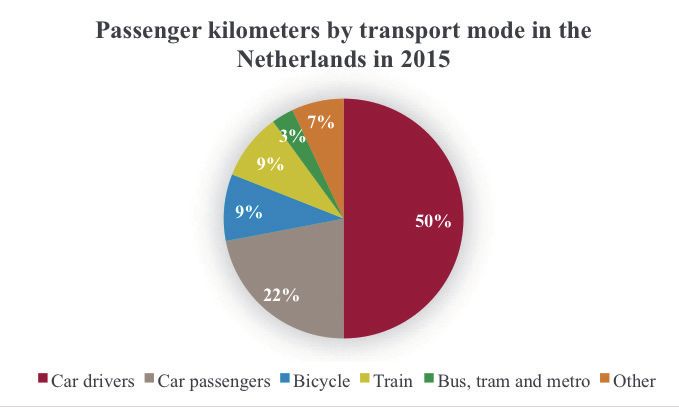
11. NETHERLANDS 47
12. NORWAY 53
13. POLAND 57
14. RUSSIAN FEDERATION 61
15. SWEDEN 63
16. SWITZERLAND 67
17. UNITED STATES 71
18. MOBILITY PRICING IN EUROPE AND B
EYOND: SUMMARY SYNTHESIS 75
19. APPENDIX 1: ABSTRACTS 83
20. APPENDIX 2: CONTRIBUTORS 88
3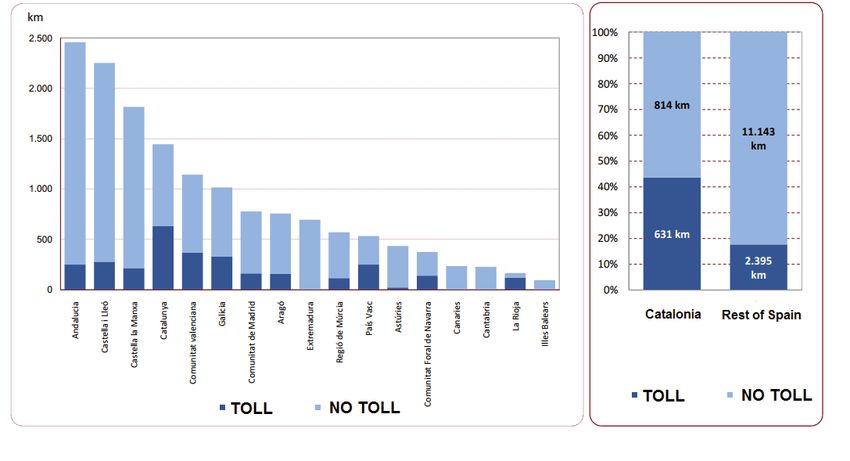

   European Parliamentary Technology Assessment

Preface

Distinguished reader!

By today’s standards it is not much more than a surprisingly small, yellow and black lacquered plywood
box. But in the 1840’s, drawn by five horses, it grandly ushered in a new era, putting Switzerland at the
crossroads of major transport corridors in Europe and thereby reshaping the country’s geographic, polit-
ical and social contexts: The first stagecoach negotiating the hair-raising hairpin turns of the then newly
opened road over the Gotthard pass.
         As in many industrialized countries, the transport system in Switzerland has since evolved with
ever increasing speed. Not just in the Gotthard region, where in 1882, the pass road was outclassed by the
opening of the railway tunnel. Almost exactly one hundred years later, the motorway tunnel started oper-
ating, dwarfed today by the rail base tunnel whose 57 km make it the world’s longest tunneling project.
         Technology Assessment (TA) is well-placed to know that such technological feats entail op-
portunities as well as risks. Greater mobility, better means of communication and improved transport
systems have to be balanced with ever increasing numbers of infrastructure users, traffic congestion,
pollution and environmental impacts as well as exploding costs in financial as well as social terms. By
furnishing independent and credible analyses, TA provides policy options intended to guide technolog-
ical developments for the good of society.
         This report provides an overview of mobility pricing in different countries as well as their plan
to tackle the challenge of managing mobility in the near future. It is part of a series of similar reports
compiled every year by the respective presidency of the EPTA network1. As in previous editions, it is a col-
lection of contributions written from the perspectives of different full and associate members of EPTA.
As such, it can be read as a stand alone survey of the transport policy situation in a number of industri-
alized countries, but it also provides an information basis for the issues addressed by the international
EPTA conference “Shaping the Future of Mobility” hosted by TA-SWISS in the Swiss Transport Museum
in Lucerne on November 8, 2017 – by the way, Switzerland’s most popular museum.
         I wish to thank all contributors for making each country report in this collection a compelling
read and, in particular, Dr Christina Tobler from the team of TA-SWISS, for defining the contextual
framework, providing the introduction and synthesis chapters and for joining, with unwavering pa-
tience, the individual parts to an enticing and thought-provoking whole. Special thanks go to Christine
D’Anna-Huber for editing the contributions as well as taking care of the printing and finishing of the
report.

Wishing you an instructive and enjoyable reading

Sergio Bellucci
EPTA President 2017, Director TA-SWISS, Foundation for Technology Assessment/Switzerland

Bern, October 2017

1 See the EPTA project database at eptanetwork.org/database/projects
Download the 2016 EPTA report at http://epub.oeaw.ac.at/0xc1aa500e_0x003469a0.pdf

                                                                                                          5
Introduction
European Parliamentary Technology Assessment
1. Introduction
Christina Tobler, TA-SWISS
1.1 Shaping the Future of Mobility
Citizens and economic actors in Europe and beyond need a transport system which provides them with
seamless, high-quality door-to-door mobility2. However, according to the European Commission, many
towns and cities increasingly face problems caused by transport and traffic. One dominant problem is
severe traffic congestion; its total cost in the EU is estimated at €80 billion annually3.
The question of how to enhance mobility while at the same time reducing pollution, conges-
tion and accidents is a common challenge to all major cities in Europe4. A profound transformation in
the transport system will be required in the coming decades. New developments like autonomous and
connected driving, sharing economy, mobility pricing or mobility as a service are expected to shape the
future of our mobility and revolutionize our transport systems.
The Annual EPTA Conference in 2017 addresses different developments in future mobility and
examines them from multiple perspectives. The conference aims to foster debate on shaping future
mobility, encouraging parliamentarians, experts and stakeholders to discuss possible solutions as well as
desirable and adverse outcomes.
1.2 Aim of this report “Mobility Pricing in Europe and beyond”
The EPTA network of international TA institutions produces an annual report on timely topics concern-
ing the relationships between technological change, society, economy and politics. Each year a different
partner assumes the presidency of the network. The main tasks of the EPTA presidency are to create
the report based on the contributions from each network member, and to organize a conference on
the chosen topic in the presiding country for presentation and discussion of the report’s findings with
members of parliament. The present report also serves to provide information on mobility pricing for
international policy makers, researchers, and the wider public.
The term “mobility pricing” describes charges for the use of any transport infrastructure or ser-
vices on all transport modes with the objective of influencing travel demand and mobility behaviour5.
Mobility pricing aims to manage transportation demand in order to reduce peak hour travel, conges-
tions, air pollution or greenhouse gas emissions. Possible instruments are road or congestion pricing as
well as transportation fares.
The EU has created a framework to encourage the use of taxation and infrastructure charging,
which should promote the ‘user pays’ and ‘polluter pays’ principles and contribute to the internalisa-
tion of external costs6. The aim is a more efficient use of transport infrastructures currently affected by
2 http://europa.eu/rapid/press-release_MEMO-13-1160_en.htm
3 http://europa.eu/rapid/press-release_MEMO-13-1160_en.htm
4 https://ec.europa.eu/transport/themes/urban/urban_mobility_en
5 Rapp, M. (2006). Mobility pricing scenarios for Switzerland. Retrieved from https://www.gised.ch/wAssets-de/docs/
trans/fachartikel-referate/2006/dokumente/its-congress-london/mobility_pricing_ch_itslondon-doc.pdf
6 https://ec.europa.eu/transport/modes/road/road_charging_en
7Introduction
European Parliamentary Technology Assessment
congestion. However, despite its potential benefits, mobility pricing is controversially discussed. Critics
for instance argue that the transport sector is already overtaxed and predict negative impacts on the
economy.
The comparative report should shed light on the implementation of and political debate about
mobility pricing in Europe and beyond. To present an overview on the topic, the presidency suggested
the following main questions:
1 Mobility: Facts and Figures
What distance does the average resident travel – by which means of transportation? What are the costs
of transportation and who funds it? Is there any income from transportation (e.g., from mobility pricing)?
2 Current implementation of mobility pricing in the country or region
Is there a mobility pricing scheme implemented, and if so: on which level (national, regional, local)? How
is it implemented (e.g., vignettes, tolls etc.)? Is it charged directly, based on use, distance or time – or is
it covered by an annual fee? Does the mobility pricing scheme cover public, private or freight transport?
Who are the drivers? Are they from the public, private or industrial sector? If no such scheme is imple-
mented (yet), are there plans to do so and why (not)?
3 Societal and political debate
How is the political and public acceptance, what are the arguments and concerns? What stakeholders
are involved? Are there any current political proposals on this topic? Is there any resistance, if so: from
whom and why?
4 Experiences and outlook
What are the effects of mobility pricing on traffic, economy and environment? To what extent can
Mobility Pricing contribute to solving transport problems? What are the effects of Mobility Pricing on
the traffic behaviour?
5 Other approaches to future mobility
Are there any other approaches to solve mobility problems or to prepare for future mobility?
8AUSTRIA
European Parliamentary Technology Assessment
2. AUSTRIA
Stefanie Peer & Tanja Sinozic
2.1 Mobility: Facts and Figures
Austria has a population of 8.4 million and an area of 83,850 km2. Two thirds of its geographical ter-
ritory is mountainous, almost one half of the country is covered with forests, and about 16% is arable
land7. The capital city Vienna is Austria’s only major sized city, with approximately 1.84 million inhabit-
ants in 2016. Austria shares borders with eight EU countries. The country’s borders as well as its topog-
raphy have significantly shaped its transportation network. Austria’s motorways play an important role
for transportation across Europe. Major infrastructure projects are currently taking place, including the
construction of three new long rail tunnels and a new subway line in Vienna.
Austria’s transportation network is generally advanced, not only in (sub-)urban areas, but also in
more rural and remote regions, and the transport system in Vienna in particular is internationally consid-
ered to be excellent.8 The large majority of transportation infrastructure such as motorways, roads and
railways is publicly financed, and public means of transportation tend to be heavily subsidized. The main
means of transportation are private cars (50.5% of trips on an average working day), public transport
(14.6%), walking (17.8%) and cycling (6.4%). On working days, Austrians cover on average 36 km,
which takes them about 70 minutes.9 Commuters are granted various forms of tax allowances, most of
which are targeted at car commuters.
There exist several kinds of pricing schemes for mobility, differentiated by transport and vehicle
type, as well as by the level at which they are levied (national, federate state, regional or local level)10.
There is a usage-independent motorway toll targeted at individual travellers, and a usage-dependent toll
targeted at trucks. Public transport is generally fairly affordable, especially season passes. For example,
the ticket covering all modes of public transportation in Vienna costs 365 Euros per year11. Also cycling
is promoted by most city administrations, for instance by expanding cycle lanes and by offering bicycle
rental (the Citybike scheme in Vienna is virtually free of charge).12 As a consequence, Vienna has quite
a low share of trips made by car (ca. 32%) compared to other cities of similar size.9
2.2 Current implementation of mobility pricing
There is no single consistent mobility pricing scheme in Austria. Some steps were made in the direction
for specific transport modes, such as trains: the ÖBB (Austrian Federal Railways) “Austriacard” allows
for the unlimited use of all trains in Austria for one year for the price of 1.784 Euros13. In Vienna, some
7 statistik.at/web_en/statistics/Economy/agriculture_and_forestry/farm_structure_cultivated_area_yields/land_use/
8 migration.gv.at/en/living-and-working-in-austria/austria-at-a-glance/transport/
9 bmvit.gv.at/verkehr/gesamtverkehr/statistik/oesterreich_unterwegs/downloads/oeu_2013-2014_Ergebnisbericht.pdf
10 bmvit.gv.at/verkehr/nahverkehr/verbuende/oesterreich.html
11 wienerlinien.at/eportal3/ep/channelView.do/pageTypeId/66526/channelId/-46642
12 citybikewien.at
13 oebb.at/en/angebote-ermaessigungen/ermaessigungskarten/oesterreichcard
9AUSTRIA
European Parliamentary Technology Assessment
progress has been made towards “mobility as a service” by Wiener Linien: since 2015 the city’s public
transportation provider offers a “mobility card”, which includes public transportation, the use of the
Citybike, discounts on taxis, parking garages and the City Airport Train (CAT). Despite optimistic predic-
tions from the public transport agency that the mobility card would be very popular, very few have been
purchased so far14. The federate state of Vorarlberg has recently rolled out a mobility service card that
combines local public transportation (such as buses) with regional train transport covered by a single
annual fee15.
As previously mentioned, road pricing for individual travellers on motorways goes by way of a
vignette, which in 2017 costs 86.40 Euros per year (per car), with bi-monthly and weekly options avail-
able as well.16 Moreover, Austria has distance-dependent tolls for vehicles exceeding the weight of 3.5
tonnes on motorways, measured by a small device inside the truck and overhead sensors (Go-Box). The
toll further depends on the truck type (with larger, more polluting and noisier trucks paying higher tolls
per km). Both for individual travellers as well as for trucks, extra tolls are levied on specific links (espe-
cially in Alpine areas such as the Brenner pass) for environmental reasons and/or in order to recover the
costs of the infrastructure.17
Most cities and towns have implemented some type of parking management18, which tries to
motivate commuters to use alternative forms of transport or park at locations at which public space is
less scarce. In Vienna, the parking management includes parking permits for residents, which are an
annual fee paid to the city for parking allowance in the district of residence, inner city zoning with fees
for short term parking for non-residents19, as well as some Park & Ride facilities also catering mostly to
non-residents. Public transportation fees are quite diverse, with annual, monthly, weekly and daily tick-
ets available, as well as trip and distance based ones. A single trip within a city, e.g., costs between 1.80
and 2.20 Euros in most cases20.
2.3 Societal and political debate
In general, mobility pricing and related topics such as public transport infrastructure and zoning are
highly politicized in Austria. Large infrastructure transportation projects such as the planned rail tunnels
are always controversial, because of environmental risks, their massive cost and often very low return on
investment. Recent zoning attempts motivated by environmental concerns have been abandoned main-
ly for political reasons. The implementation of pedestrian zones, such as in one of the boulevard streets
in the Vienna city centre (the Mariahilferstrasse), and short-term parking zones to contain car traffic
in residential areas have all been preceded by long political processes with much debate in the media
and resistance most notably from centre-right parties and private industry (organized by the Chamber
of Commerce). Environmental reasons have also been the political drivers to contain traffic in the city
14 orf.at/news/stories/2760445/
15 presse.vorarlberg.at/land/servlet/AttachmentServlet?action=show&id=20173
16 austria.info/us/basic-facts/getting-there-around/austria-by-car/toll-sticker
17 diepresse.com/home/ausland/eu/451455/Entlastung-fuer-den-Brenner_Zeichen-stehen-auf-Oekomaut;
https://de.wikipedia.org/wiki/Richtlinie_1999/62/EG_(Wegekostenrichtlinie)
18 salzburg.orf.at/news/stories/2841198/
19 wien.gv.at/amtshelfer/verkehr/parken/kurzparkzone/parkpickerl.html
20 migration.gv.at/en/living-and-working-in-austria/austria-at-a-glance/transport/
10AUSTRIA
European Parliamentary Technology Assessment
of Graz, which has recently contemplated the introduction of a “car free day” to lower the amount of
particulate matter in the air.21 Overall, the debates in Austria focus more on regulation (for example zon-
ing) than on pricing, with the former being more popular due to the distributional concerns raised with
pricing (with the concern being that in future only the more affluent members of society will be able to
afford car ownership and usage).
There is some persistent discussion on the taxation of gasoline (in particular, Diesel) in Austria,
because the levied taxes are considerably lower than in most neighbouring countries. The resulting so-
called “fuel tourism” generates substantial revenues for the Austrian government – 830 million Euros
in 201722. Low fuel taxes are also linked to environmental concerns, not least because the current CO2
emissions targets attribute emissions to the country where the fuel is purchased and not where it is
consumed23. Because of the large revenues obtained from fuel tourism and the high dependency of
Austrians on private car travel, an increase in fuel charges is unlikely in the short and medium term.
The political debates surrounding mobility pricing and regulation in Austria are also due to pow-
erful stakeholders and lobby organisations. The two main Austrian automobile clubs with approximately
two million members each24 (ÖAMTC and ARBÖ) play an important role in national decision-making.
Both mainly lobby in favour of motorized mobility. Another important organisation with wide media
presence is the Verkehrsclub Österreich (VCÖ), which is a lobby and research organisation focusing on
ecologically safe, socially just and economically efficient transportation.25 Other important organisations
are the public transport agencies in cities such as the Wiener Linien, Grazer Verkehrsbetriebe and Linz
Linien, the transport ministry, the finance ministry, provinces, municipalities and political parties. In the
freight sector, the Zentralverband Spedition & Logistik as well as the chamber of commerce are the most
relevant stakeholders.26
Debates have also been ignited as private companies have entered a previously public domain,
such as the rail service provider Westbahn27 competing with the national railway line ÖBB on Austria’s
main rail link which connects Vienna, Linz and Salzburg.
2.4 Experiences and outlook
The above-mentioned types of mobility pricing are likely to have affected the behaviour of individual
travellers as well as logistics providers, and in turn traffic conditions, the economy and the environment.
However, it is often hard to pinpoint the specific cause of certain developments. One example is that
road traffic in Vienna has decreased by about 6.3% between 2010 and 2015 despite a growing num-
ber of inhabitants.28 The cause of this decline cannot be attributed to a single measure implemented in
that time period. Instead it is likely to be the combined outcome of a number of measures that the city
government has taken in past years, including the following: (1) introduction of parking management in
21 kurier.at/chronik/oesterreich/wegen-feinstaub-autofreier-tag-fuer-graz-angedacht/272.478.047
22 derstandard.at/2000054921143/Tanktourismus-auch-bei-hoeherer-Steuer
23 derstandard.at/2000054846297/Rupprechter-stellt-hoehere-Steuern-fuer-Dieselautos-in-den-Raum
24 oeamtc.at
25 vcoe.at/ueber-vcoe/ueber-vcoe
26 spediteure-logistik.at
27 westbahn.at
28 wien.gv.at/stadtentwicklung/projekte/verkehrsplanung/strassen/verkehrszaehlung/index.html
11AUSTRIA
European Parliamentary Technology Assessment
large areas of Vienna (which caused a significant decrease in parking occupancy levels in those areas29),
(2) introduction of a 365-Euro-annual-ticket that covers all public transport (which induced a substantial
increase in public transport usage30), (3) extensions and improvements of the network of cycling paths.
As mobility pricing in Austria is fairly moderate, no large-scale effects on the economy are evi-
dent. Extensive tax allowances for commuters (Pendlerpauschale, Pendlereuro) are likely to – ex aequo
– lead to longer commuting distances, more urban sprawl, and in turn a higher car dependency. Various
current and upcoming projects concerning mobility pricing in Austria focus on mobility as a service,
and the use of digital technologies (especially smartphone apps) to optimise route and transport mode
choice (e.g. the project Smart Journey31 currently being tested in Carinthia and Styria).
2.5 Other approaches to future mobility
A substantial shift towards E-mobility is considered a key instrument for achieving the CO2 targets set
in the Paris Climate agreement.32 Various subsidies are available for buyers of electric cars as well as for
the construction of charging infrastructure both at the national as well as the provincial level.33 Despite
these incentives, the share of electric vehicles in the Austrian car fleet is still very low (0.25% of the
overall car fleet, 1.54% of new vehicles).34 One exception is the federate state of Vorarlberg which has
one of the highest shares of electric vehicles of all regions in the EU.35
Car-sharing is indirectly supported by the city government in Vienna by providing free park-
ing to operators of free-floating car schemes. In Vienna more than 100,000 persons are subscribed to
car-sharing providers.36
R&D towards autonomous driving is mainly funded by the Austrian Research Promotion Agency
(FFG).37 It for instance funds a test region on autonomous driving around the city of Graz as well as a
self-driving bus in a newly constructed district of Vienna (Seestadt Aspern).38 Graz has been selected
due to the large car manufacturing cluster located there (including the availability of test tracks) as well
as the presence of related research institutions.
29 wien.gv.at/verkehr/parken/entwicklung/ausweitung/
30 diepresse.com/home/panorama/wien/4839954/365-Euro_Traegt-sich-die-Jahreskarte-von-allein
31 oebb.at/de/umfragen-gewinnspiele/smartjourney/
32 bmvit.gv.at/verkehr/elektromobilitaet/
33 energiemagazin.at/foerderungen-fuer-elektroautos-in-oesterreich-eine-uebersicht-der-bundeslaender/
34 bmvit.gv.at/verkehr/elektromobilitaet/downloads/oesterreich2016_de.pdf
35 vlotte.at
36 wien.gv.at/stadtentwicklung/studien/pdf/b008470.pdf
37 ffg.at/automatisiertesfahren
38 bmvit.gv.at/service/faktenblaetter/automatisiertesFahren_testen.pdf
12CATALUNYA (SPAIN)
European Parliamentary Technology Assessment
3. CATALUNYA (SPAIN)
CAPCIT, with the collaboration of the Government of Catalonia
3.1 Mobility: Facts and Figures
The Catalan road network has a total length of 12,060 km, of which 50% are owned by the Catalan
Government, 15% by the Spanish Government and the remaining 35% by the four Catalan provincial
councils.
High-capacity roads (motorways, dual carriageways and stretches of other controlled-access
highways) are particularly important in this network due to their technical characteristics. There are 1,648
km of high-capacity roads and they account for 14% of the total Catalan road network (12,060 km).
The Catalan Government owns 762 km (46%) of these 1,648 km of high-capacity roads in Catalonia,
the Spanish Government 860 km (52%) and local government 26 km.
As for the management and pricing scheme, the Catalan high-capacity road network consists
of 675 km of direct toll roads (with pay-per-use or for mobility), 343 km of shadow toll roads (payment
by the government) and the remaining 630 km which are non-concessionary roads (financed directly
out of the budget).
Direct toll roads are run under a concession contract whereby in return for building and oper-
ating the road the concession operator is paid a charge by users which varies by the type of vehicle and
the distance travelled. At present in Catalonia there are 675 km of direct toll roads, of which 474 km
are Spanish Government-owned roads (the AP-7 and AP-2) and the remaining 201 km are roads owned
by the Catalan Government.
In the case of shadow toll roads the construction and upkeep costs are passed on to the govern-
ment as a function of their traffic so they are not directly paid for by users. At present only the Catalan
Government owns shadow toll concessions.
The direct tolls system in Catalonia has a high degree of maturity, although this is not the case
with shadow tolls. In the next few years 515 km of direct toll concessions in Catalonia will expire (87
km in 2019 and 458 in 2021) which are the ones that generate the greatest impact in terms of pricing.
3.2 Current implementation of mobility pricing
To date there has been no consistent or harmonious pay-per-use system, but rather three different mod-
els on the Catalan network: direct toll roads, shadow toll roads and direct management roads (non-con-
cessionary roads). The latter two are free for users while on the direct toll roads the user pays a charge
based on their use of the road (distance travelled between joining the road and leaving it at the toll).
675 km of the 1,648 km of high-capacity roads have direct tolls, i.e. 40% of the high-capacity network
has tolls which are directly paid by users. The other 60% is free for users. The final price depends on the
category of the vehicle (motorcycles, cars, bans, coaches or lorries).
On the roads, the unit price (euro per kilometre) and the resulting tolls charged when bringing a
particular motorway into service are set in the contract awarding the concession. The charges take into
account initial investment costs, maintenance costs and reinvestment, financial costs and the return for
the shareholders associated with the funds required to carry out the investment, expected traffic and
the years of operation specified.
13CATALUNYA (SPAIN)
European Parliamentary Technology Assessment
It should be borne in mind that depending on the location of the mainline toll stations and wheth-
er or not there are any slip road toll stations, the final cost to the user will vary depending on where they
join and leave the motorway. Under the Toll Homogenisation Plan the number of slip road toll stations on
the motorways is being increased in order to adjust the toll paid to the actual journey taken.
For a variety of reasons and under the contracts with the concession operators, there are a
number of stretches on the toll motorway network where local journeys and sometimes all journeys are
exempt from paying the toll. Some stretches have had this system in place since the start of the conces-
sion period, while others have become free of charge later on.
The pricing scheme covers public, private and freight transport. In Catalonia, there are currently
six direct toll concession operators.
3.3 Societal and political debate
The current toll system generates a degree of controversy and some rejection in a number of sectors.
The heterogeneity of the system of high-capacity roads – some free and some not – does not
have a positive impact on public opinion about road pricing as toll roads are seen as a regional grievance.
In Spain as a whole most of the high-capacity road network is free of charge for users, and Catalonia is
the region which has the most direct toll roads in both absolute and relative terms.
Figure 1.- Spanish Autonomous Communities and tolls – Source: Viacat Statistical Yearbook (2014)
There are several civic campaigns organised against tolls as they consider the initial investment
has been recovered. Other platforms call for greater road safety and criticise the inefficiencies of redi-
rected traffic resulting from toll policies.
Likewise, the fact that some conventional roads run parallel to toll roads leads to an inefficient
use of the network which generates externalities such as congestion and accidents.
14CATALUNYA (SPAIN)
European Parliamentary Technology Assessment
Other sectors do not so much question pay-per-use as the fact that the tolls are managed by
private firms and not state-owned enterprises.
There are other sectors of opinion which argue that taxation on vehicles (road tax, registration,
fuel, VAT) easily covers the cost of running the road system.
Finally, one of the criticisms of the current system is that tolls have been used as a financial
mechanism and not for mobility management or environmental pricing. In other words, current charges
are calculated on the basis of covering costs, which means that in those stretches where construction
costs are very high – tunnels and rough terrain – or where revenues are lower – because of low traffic
volumes – a system of higher charges per kilometre is required.
At any event there is also greater social awareness of the Eurovignette “the user pays” and “the
polluter pays” principles.
The main stakeholders are the concession operators, the tiers of government owning the toll
roads, toll road users and civic engagement platforms and civil society.
Over the next few years 515 km of direct toll concessions in Catalonia expire, and this will make
it possible to put forward fairer, more equitable and simpler road pricing schemes.
At present the Catalan Ministry of Planning and Sustainability is considering the option of a
charging system involving a vignette for the availability and use of high-capacity roads in Catalonia.
There is a consensus among the Catalan Government, concession operators, businesses, civil society
and academics that any new road charging scenario requires harmonious treatment on all high-capacity
roads regardless of who owns them (the Spanish Government or the Catalan Government).
As for the Spanish Government, the inclusion in Spanish law of the Eurovignette Directive has
not entailed any change in the current status quo. The Spanish Government enacted the Eurovignette
Directive in Spanish law – without any real impact on the current system of toll motorways and toll-free
motorways – through the Royal Decree 286/2014, of 25 April, which lays down the principles for de-
ciding on the tolls to be charged to certain freight transport vehicles on concession motorways forming
part of the National Highways Network. The Spanish Government’s official position is to make motor-
ways free as the concessions expire, an approach that is not devoid of problems given the sunk costs
of the roads (final balances) as well as the fact that the upkeep of these roads – until now the respon-
sibility of the concession operator – might generate new costs for the governments owning them at a
time of limited resources. The first motorway concession to expire is the AP-1 between Burgos and the
Basque Country in 2018 which is owned by the Spanish Government. The charging option the Spanish
Government chooses will set the rules of the game for the following reversions.
3.4 Experiences and outlook
The current toll system leads to major inefficiencies due to accidents and congestion on the free con-
ventional roads that run parallel to the toll roads. These inefficiencies take the shape of loss of time and
accidents and have been quantified by several studies as running into the millions.
Furthermore, the inefficient use of the network has led to the widening of some stretches of
the parallel roads which has required significant amounts of investment. Greater use of the current toll
motorways or adding lanes to them are solutions that would solve the problem of road safety and con-
gestion much more efficiently than widening the parallel roads.
In a through-traffic country such as ours, logistics and transport are factors that drive invest-
ment and attract companies and industry. In addition, we are also a country with a powerful tourism
sector. Hence it is essential to have a well-maintained, affordable, high-quality land transport network
that connects companies and logistics, production and distribution hubs at the European and global
level featuring infrastructures that carry people and goods and connect us to the world.
15CATALUNYA (SPAIN)
European Parliamentary Technology Assessment
The concession operators have the option to give trade discounts to some or all users of their
roads. The various tiers of government also implement measures to improve mobility and the environment.
Since 1 January 2012 the Catalan Government has used a system of cumulative general dis-
counts on the roads it owns to subsidise commuting and promote efficient behaviour by users, i.e. re-
current journeys (30%), high occupancy vehicles (40%) and low emissions vehicles (30%).
Since 1 January 2014 the Catalan Government has added other specific discounts on particular
stretches or concessions. This measure is designed to continue with the progress made since 1999 in
bringing the most expensive stretches of motorway (in terms of euro per kilometre) closer to the average
for the network owned by the Catalan Government. There are also special discounts such as the 100%
discount for electric vehicles, the peak and off-peak rate system for congested stretches and the Tariff
Homogenisation Plan.
In addition, the act accompanying the Catalan Government’s budget (Act 5/2017) includes a
tax on carbon dioxide emissions by vehicles with mechanical traction (which is payable as of 1 January
2018, except in the case of motorcycles where it is payable as of 1 January 2019).
There is no plan for general or specific discounts by type of mobility or vehicle on the Spanish
Government’s direct toll roads. However, some local journeys on the AP-7 – the Girona and Tarragona
bypasses and the Montmeló – El Papiol stretch – are free in order to improve mobility. In addition, since
2013 in the Spanish Government-owned N-II / AP-7 Girona corridor, lorries with four or more axles
have been banned on the N-II in order to cut the accident rate and improve traffic flows on this road. In
lockstep the Catalan Ministry of Planning and Sustainability, the Spanish Ministry of Public Works and
concession operator Acesa have agreed on a system of discounts for these HGVs on the AP-7 motorway
depending on their route.
16EUROPEAN UNION
European Parliamentary Technology Assessment
4. EUROPEAN UNION
Christian Kurrer
4.1 Mobility in the European Union (EU): Facts and Figures
The average EU-28 inhabitant travels about 13,000 km per year by motorised means of transport, of
which almost three quarters are travelled by car. While the number of kilometres travelled by car has
slightly decreased in recent years, cars still remain by far the dominant mode of transportation in the life
of average Europeans.
In terms of kilometres travelled, the other dominant modes of transport are airplanes, busses
and trains, which account for a share of about 9.8 and 6.5 percent, respectively.
In 2014, European private households spent about 1,000 billion euro on transport-related ex-
penses, about a quarter of that amount for purchasing vehicles, 50 percent for operating costs (gasoline
etc.) and the remaining quarter for purchasing tickets for other modes of transportation. This expense
represents on average 13 percent of the available household income, compared to only 1 percent spent
for education, and also still more than expenditure for food and non-alcoholic drinks.
Beside these direct costs, the transport sector generates costs of more than 100 billion euro
per year through the road congestion it causes39.
In addition to the expenditure of private households, public authorities in the EU spend an ad-
ditional 100 billion euro per year investing in transport infrastructure, of which about 54 percent are
devoted to road infrastructure and 36 percent to rail infrastructure40.
The EU budget is contributing to these infrastructure investments to the order of 12 billion
euro annually through the cohesion programmes and 1 billion euro annually through Trans-European
Transport Network (TEN-T) funding41.
In addition to the direct cost of transportation shouldered by EU households, in a globalising
economy, the costs of freight transport constitute an increasingly important part of the costs of the
goods purchased by households.
While the costs of passenger transportation directly impacts European households and consum-
ers, the cost of freight transport indirectly affects them through the price of the goods and services they
purchase42.
Estimates from the US suggests that around 14 percent of the price of agricultural products and
9 percent of the price of manufactured goods are made up of transport-related costs43.
39 https://ec.europa.eu/transport/sites/transport/files/pocketbook2016.pdf; https://ec.europa.eu/transport/sites/trans-
port/files/connect-to-compete-people_2016_en.pdf
40 www.eea.europa.eu/data-and-maps/indicators/infrastructure-investments/assessment-3
41 www.transportenvironment.org/what-we-do/eu-transport-spending/background
42 www.rita.dot.gov/bts/sites/rita.dot.gov.bts/files/publications/transportation_economic_trends/ch3/index.html
43 https://ops.fhwa.dot.gov/freight/freight_analysis/freight_story/costs.htm
17EUROPEAN UNION
European Parliamentary Technology Assessment
4.2 Current implementation of mobility pricing in the EU
The EU recognises that taxation and infrastructure charging are important for maintaining and devel-
oping the trans-european infrastructure network. It has therefore created a framework to encourage
member states to use taxation and infrastructure charging in the most effective and fair manner, in or-
der to promote the «user pays» and »polluter pays» principles, as enshrined in the treaties.
This framework contributes to the internalisation of external costs related to road transport,
such as those generated by the use of infrastructure or its environmental and social impact. With the
internalisation of costs, the EU also wants to encourage a more efficient use of transport infrastructure,
currently affected by congestion, thus reducing the time wasted due to bottlenecks.
Road charging can also be a useful instrument for generating new sources of revenue to help
develop Europe’s vital infrastructure, as well as cleaner, more energy-efficient modes of transport.
The different instruments at the disposal of the EU for promoting these goals include vehicle
and fuel taxation as well as road infrastructure charging44.
According to the subsidiarity principle, the charging of private vehicles falls within the compe-
tence of member states and therefore no secondary rules on this issue exist at EU level. However, any
road-charging scheme put in place by a member state must uphold the fundamental principles of the
EU treaties, in particular the principle of non-discrimination on the grounds of nationality.
The legislative conditions for the road charging of heavy goods vehicles (HGVs) are different
from those for private vehicles, as the movements of HGVs are directly linked to the EU’s core principles
of free trade and the free movement of goods. In 1999 the Directive 1999/62/EC45 «on the charging of
heavy goods vehicles for the use of certain infrastructures» – known as the Eurovignette Directive – laid
the foundations for the internalisation of the costs generated by HGVs.
The Directive was amended in 2006 (Directive 2006/38/EC) and 2011 (Directive 2011/76/EU),
allowing the inclusion of external costs such as air and noise pollution in the calculation of charges. Thus
the «user pays» regime was extended to encompass the «polluter pays» principle46.
While leaving the implementation of road charging systems to the level of individual member
states, the EU is promoting the interoperability of electronic road toll systems in the Union47.
4.3 Societal and political debate
European legislation
On 31 May 2017, the European Commission put forward a new (road) mobility package «Europe on the
Move». It contains the following legislative proposals on road charging:
–– Smarter Road Infrastructure Charging
–– Revision of Eurovignette Directive (1999/62)
–– Promoting the European Electronic Toll Service (EETS)
–– Recast of the Directive on the interoperability of electronic road toll systems in the Community
(2004/52).
44 https://ec.europa.eu/transport/modes/road/road_charging_en
45 http://eur-lex.europa.eu/legal-content/EN/TXT/PDF/?uri=CELEX:31999L0062&from=EN
46 http://www.europarl.europa.eu/RegData/etudes/BRIE/2016/583781/EPRS_BRI(2016)583781_EN.pdf
47 https://ec.europa.eu/transport/sites/transport/files/media/publications/doc/2011-eets-european-electronic-toll-service_en.pdf
18EUROPEAN UNION
European Parliamentary Technology Assessment
In preparation of these proposals, the Commission conducted stakeholder consultations and
published studies that give an overview of the main arguments put forward during the stakeholder
consultations48.
While these consultations showed broad support among member states for further incentivis-
ing the use of fuel-efficient vehicles in general, not all were convinced of the ease and value of imple-
menting this through CO2 -differentiated charges.
These proposals have now been sent to the European Parliament and the Council for legislative
debate and approval.
European Parliament (STOA) studies
The European Parliament and in particular its Science and Technology Options Assessment (STOA) Panel
have repeatedly addressed the issue of mobility pricing and novel transport options and technologies in
recent studies, including:
2012 – Technology Options in Urban Transport: Changing paradigms and promising innovation pathways49
This report gives a broad overview over the different approaches being pursued for a transition towards
more sustainable urban transport systems, ranging from technological options such as electric or fu-
el-cell cars, ICT solutions to improve traffic flows, e-ticketing systems, changes in urban land use poli-
cies, as well as behavioural changes such as the emergence of car- or bike-sharing.
2013 – STOA Study on Eco-efficient transport50
This study is aimed at assessing to what extent different concepts and approaches can help to increase
the eco-efficiency of the transport system, looking in particular into energy systems, cleaner cars, clean-
er trucks, smart logistics, automation, integrated ticketing, access instead of ownership, shift to rail,
shift to short sea and inland shipping, awareness of/making use of habit and attitude changes, urban
design as well asmobility pricing. To allow the required systemic perspective, the assessment has been
supported by scenario building. The feasibility and desirability of the scenarios and their elements were
the subject of a stakeholder consultation.
2014 – Integrated urban e-ticketing for public transport and touristic sites51
This report deals with the development of integrated e-ticketing systems for public transport and touris-
tic sites in cities. The idea of integrated e-ticketing is to combine several modes of transport (e. g. tram,
bus, car-, and bike-sharing) on a single ticket. Modern multi-application smart cards are able to incor-
porate additional fields of application (e. g. leisure activities or tourist attractions) on one fare medium.
Such systems aim at facilitating the combination of modes and the transfer between modes by making
the ticketing system as easy and attractive as possible.
48 https://ec.europa.eu/transport/modes/road/studies/road_en
49 http://www.europarl.europa.eu/RegData/etudes/etudes/join/2012/482692/IPOL-JOIN_ET%282012%29482692_EN.pdf
50 http://www.europarl.europa.eu/RegData/etudes/etudes/join/2013/513520/IPOL-JOIN_ET%282013%29513520_EN.pdf
51 http://urban-intergroup.eu/wp-content/files_mf/ipoljoin_et2014513551_en.pdf
19EUROPEAN UNION
European Parliamentary Technology Assessment
2016 – Ethical Aspects of Cyber-Physical Systems (CPS), covering autonomous vehicles52
Among other aspects, this report also describes how CPS are expected to revolutionise logistics and
transport systems sectors across Europe, with profound implications for safety, emissions and overall
efficiency in the transportation of goods and people. In the short term, this presupposes the continued
automation of automobiles. Current manufacturers are introducing Advanced Driver Assistance Systems
(ADAS), which help to make a car «smarter» through automated assistance for the driver. Logistics will
fundamentally change as robotic technologies are deployed to solve last-kilometre problems (traffic
congestion and lack of loading and unloading facilities in urban areas), while automation for storage
and retrieval systems in warehouses will further increase, with the first autonomous robotic material
handling systems currently being built.
In the long term, this means the deployment of fleets of fully autonomous vehicles in both
logistics and transportation sectors. Warehouses and shipping centres will automate their storage and
retrieval systems, while also automating the handling and manipulation of goods.
4.4 Experiences and outlook
Beside the legislative activities, the European Commission is also sharing the exchange of best practices
and experiences between actors across Europe, e. g. through a dedicated webpage on Urban Access
Regulations in Europe53, giving an overview over more than hundred urban access regulations imple-
mented across Europe.
The European Commission also promotes the dissemination of research results through a ded-
icated website54 and the publication of a structured guide to the results of relevant research projects
carried out at EU level55.
4.5 Other approaches to future mobility
There is a growing number of cities across Europe and around the world that provide free public trans-
port in an effort to promote more sustainable mobility56.
Fuel taxation policy can also be used to impact on mobility choices. The taxation of energy prod-
ucts and electricity in the European Union is governed by the provisions of Council Directive 2003/96/EC .
For fuels, the structure of excise duties is harmonised across the EU . The rates themselves still
differ from one Member State to the other.
The Commission is currently examining a possible review of the Directive in view of aligning it
to the energy and climate change goals of the Europe 2020 Strategy57.
The EU is also promoting the interoperability of public transport payment systems to render it
more attractive for cross-border customers58.
52 http://www.europarl.europa.eu/RegData/etudes/STUD/2016/563501/EPRS_STU%282016%29563501_EN.pdf
53 http://urbanaccessregulations.eu
54 http://www.transport-research.info/
55 http://www.transport-research.info/sites/default/files/thematic-analysis/20131119_114039_25650_TRS11.pdf
56 https://farefreepublictransport.com/city/
57 https://ec.europa.eu/transport/modes/road/road_charging/fuel_taxation_en
58 http://www.smart-ticketing.org/
20FINLAND
European Parliamentary Technology Assessment
5. FINLAND
Olli Hietanen
5.1 Mobility: Facts and Figures
An overall picture of Finnish passenger mobility and its background is provided by the National Travel
Survey, which is performed every six years. The new survey will be finalised by the early 2018 and the
latest results available are from the survey covering the years 2010 and 201159.
The Finns make an average of three domestic trips per day, travel a total of 41 kilometres tak-
ing an overall travel time of one hour and six minutes. The average duration of a trip is 23 minutes. The
amount of the long distance trips has grown as has the use of trains and planes rather than of passen-
ger cars for this kind of trips. Travel by foot and bicycle has declined in every age group. An increasing
number of households own a second car, and the demand for travel is greatest in sparsely populated
areas and in the outskirts of big city regions.
Communes are free to organize traffic in their own region. Public transport is supported by the
state. There is financial support to the sea cargo traffic, piloting, archipelago traffic and public transport
(bus, train, commune public traffic, flights). Currently, in Finland, there is a period of low national eco-
nomic performance, which also means massive cut backs in public expenditure. Consequently, there is
pressure for opening up transport markets for private actors in order to keep up high-quality services.
The monopoly of the state-owned railway company is ending in 2017 and new railway companies will
consequently be free to enter citizen transport markets.
In the 2016-20 strategy of the Ministry of Transport and Communications (MINTC) digital ser-
vices, platform economy, automation and robotisation are emphasized. Consumer pricing focuses on
intensifying the usage of the transport system and decreasing the negative external impacts of mobility.
Finding new pricing models and private financial sources is encouraged. There is critical consideration of
widening the ownership basis of state-owned companies.
5.2 Current implementation of mobility pricing
As far as the costs for a passenger car are concerned, road traffic taxation consists of the common car
tax, a vehicle tax and a fuel tax. CO2 emissions have an influence on traffic taxes. Annual traffic taxes
exceed State expenses for the maintenance and development of the traffic net. This means that a part
of the traffic income is allocated to cover other, not traffic-related expenses.
Currently, there are no road tolls or highway charges (vignettes) in Finland. Yet, there is a high-
way between the cities of Järvenpää and Lahti that was constructed and finalized in 1999 as the first –
and for now only – road utilizing a lifecycle model with a Public Private Partnership (PPP).
There is a systematic process of trying to get a comprehensive picture on how Finland should
proceed with charging road tolls in the long run60. Obtaining general acceptance of road tolls via careful
59 Finnish Transport Agency (2015): Public Transport Performance Statistics. Statistics of the Finnish Transport Agendy
3/2015, Helsinki, www2.liikennevirasto.fi/julkaisut/pdf8/lti_2015-03_public_transport_web.pdf
60 MINCT (2013): Tiemaksujen kansainvälinen tarkastelu, kansainväliset käytännöt sekä kehityssuuntien arviointi.
Liikenne- ja viestintäministeriön julkaisuja 42/2013, urn.fi/URN:ISBN:978-952-243-377-0
21FINLAND
European Parliamentary Technology Assessment
argumentation has been emphasized. In the report by HERMES61 the stated aim is to «… give orientation
for the upgrade of the mobility of people and goods in the transport ecosystem in Finland …» (pp. 1).
In the 2016 –17 period, the Minister of Transport and Communications Anne Berner started a
discussion about road tolls as a part of a more comprehensive renewal plan called the Act on Transport
Services62. The Act will bring changes to the current state of the transport market which is regulated
and guided by public measures. The Act is expected to promote fairness of competition in the passenger
transport market and competitiveness of the service providers of both passenger and goods transport.
The MINCT set up a parliamentary group for one year with the aim of recognizing targets for developing
traffic networks (connections, roads) including e. g. financing, investments, digitalization and decrease
of emissions. There is a financial deficit of 2,5 billion euros, which increases by 100 million euros annu-
ally, if no new financing solutions can be made available63.
The road toll initiative by Minister Berner was strongly rejected followed by a downward slope
of car sales. Now, the European Commission has a plan of launching uniform road tolls in all European
countries by 2030 at the latest64. The pricing is digital and based on kilometres and emissions. Tolls will
also be applied in countries that do not have road tolls yet, e.g. Finland.
Before selecting pricing models (public/ private) there is a major problem of fitting together
targets of economic balance and ecological sustainability. There are well-reasoned arguments for both
sides and no obvious answers available. The Act on Transport Services is currently in preparation and no
uniform pricing schemes can be identified at present. Once the Act will have come into effect in 2018
it should be possible to recognize different pricing models. In any case, new private and semi-private
actors will enter into the picture and the field of mobility will be more diversified.
The share of foreign freight transport has grown and reached 9,1 percent in June 2017. There
is a demand by Finnish Transport and Logistics SKAL (consisting of haulage entrepreneurs) to charge
vignettes from foreign transport rather than having Finnish taxpayers covering the costs of foreign com-
mercial transports65.
5.3 Societal and political debate
Mobility pricing is seen as a potential new policy tool to create and ensure sustainable mobility. There
are Key Performance Indicators (KPIs) with relevance to mobility and transport and an evaluation of the
relevance of selected fields to these KPIs: robot cars, mobility as a service (MaaS), mobility pricing, in-
novations in freight and logistics, transport, infrastructure, energy, environment, safety and health, ICT
and economy. Mobility pricing is seen as equally relevant to a variety of KPIs from value-adding services
and the number of accidents to the costs of the health care system. And it is seen as most relevant for
the tax subsidies of public transportation.
61 Healthy, Safe and Ecological Roar Transport, Mobility and Energy use for better Sustainability in Finland with ITS-
Intelligent Transportation Systems (2016) Moving Forward Consulting (HERMES). MINTC, April 2016, moving-forward-
consulting.com/wp-content/uploads/2016/06/20160411-HERMES-Study-for-MINTC-final.pdf
62 Good and flexible transport services through a new act (2017) Press release of MINCT. Date 24.05.2017, lvm.fi/en/home
63 Parlamentaarinen työryhmä selvittämään liikenneverkon tulevaisuutta (2017) MINCT:n tiedote 08.02.2017, lvm.fi/-/
parlamentaarinen-tyoryhman-selvittamaan-liikenneverkon-tulevaisuutta-921464
64 Komission suunnitelma: Tietullit koko Eurooppaan (2017). News of Kauppalehti –journal, date 27.3.2017, kauppa-
lehti.fi/uutiset/komission-suunnitelma-tietullit-koko-eurooppaan/pCbfRwd7
65 Kuljetuskalusto kansainvälistynyt Suomen tiestöllä 5 vuodessa – Raskaan liikenteen vinjettimaksu on otettava välit-
tömästi käyttöön (2017) SKAL:n tiedote 16.6.2017, skal.fi/ajankohtaista/skal_tiedottaa/kuljetuskalusto_kansainvalisty-
nyt_suomen_tiestolla_5_vuodessa_raskaan_liikenteen_vinjettimaksu_on_otettava_valittomasti_kayttoon.13443.news
22FINLAND
European Parliamentary Technology Assessment
One of the leading arguments pro road tolls is acquiring resources in order to decrease emis-
sions and enhance sustainability. However, researchers claim that road tolls have a marginal impact on
enhancing sustainability and that land use planning and infrastructure are the most effective means for
a radical decline of traffic emissions66. In HERMES, available road capacity and the amount of users of
public space are registered as relevant to infrastructure. Mobility pricing, environment, energy, economy
and MaaS are scored as relevant to the sustainability of transport. Economy and MaaS are highlighted
as most influential.
Sustainable transport and mobility are seen as key elements in gaining the UN goals of sustain-
able development and there are ambitious goals of decreasing traffic emissions. The key challenges con-
cerning Finland’s environmental policy for transport in the 2013 – 2020 period are: 1) mitigating climate
change, 2) improving the living environment and reducing the detrimental health effects associated with
transport (air quality, noise and groundwater issues) and 3) protecting the Baltic Sea. The work on envi-
ronmental matters in transport will also support opportunities for green growth67.
The Committee for the Future at the Finnish parliament points out that sustainable develop-
ment is not only a challenge, but also an opportunity: it is a source of new specialisations and job op-
portunities (e.g. clean technology) and green businesses68. In the international comparison of national
digital performances Finland scores second, after Norway69. Thus, Finland has excellent possibilities to
enhance a sustainable mobility by adopting and creating digital services (pricing, accessibility, educa-
tion, coordination etc.) e.g. in the vehicle production sector or with regard to route and timetable data
delivery and mobility systems.
There is demand for better and shorter traffic connections and visions about intensified work-
based travelling especially between Helsinki, Turku and Tampere in the future70. Government supports
work trips of over 3 hours per day since Jan. 2017, but there are few applications from the citizens. Only
2 percent of 2000 citizens would be willing to spend more than 3 hours commuting to work each day
and 70 percent would like to spend no more than 2 hours on commuting71.
By international comparison Finland scores high in mobility, but in order to reach the ambitious
targets of the government it should score even higher. The expected share of housing costs in the overall
income will increase by 2,8 percent in the 2016 – 18 period72. Finally, there is a contradiction between
increasing mobility and enhancing sustainability.
66 Tuominen A., Tapio P., Varho V., Järvi T. & Banister D. (2014) Pluralistic backcasting: Integrating multiple visions
with policy packages for transport climate policy. Futures 60 (2014) 41–58, Elsevier Ltd, dx.doi.org/10.1016/j.futu-
res.2014.04.0140016-3287
67 MINCT (2013): Environmental Strategy for Transport 2013–2020. 2013/2013, Date Nov 28, 2013,
urn.fi/URN:NBN:fi-fe2016110427996
68 Report of the Agenda 2030 Action Plan (2017). Eduskunnan tulevaisuusvaliokunta, TuVM 1/2017 vp – VNS 1/2017
vp, eduskunta.fi/FI/lakiensaataminen/valiokunnat/tulevaisuusvaliokunta/Sivut/default.aspx
69 MINCT, Tekes, Technology industries of Finland & Internet-based Industries of Finland (note. freely translated)
(2017). Digibarometri 2017, Helsinki: Taloustieto Oy, digibarometri.fi
70 Saario Kaisa (2017) Työvoiman alueellisen liikkuvuuden esteet identifioitava, date 8.5.2017, keskuskauppakamari,
date 8.5.2017, kauppakamari.fi/2017/05/08/tyovoiman-alueellisen-liikkuvuuden-esteet-identifioitava/
71 Kysely: Enemmistö ei halua käyttää työmatkaan tuntia enempää – selittää myös, miksi liikkuvuusavustus ei innosta
(2017), Talouselämä, date 16.5.2017, talouselama.fi/uutiset/kysely-enemmisto-ei-halua-kayttaa-tyomatkaan-tuntia-
enempaa-selittaa-myos-miksi-liikkuvuusavustus-ei-innosta-6649538
72 Asumismenojen osuus tuloista kasvaa edelleen (2016) PTT Pellervon taloustutkimuksen uutisia. Date 17.8.2016, ptt.
fi/ajankohtaista/uutiset/asumismenojen-osuus-tuloista-kasvaa-edelleen.html?p104=21
23You can also read