Sodium adduct formation efficiency in ESI source
←
→
Page content transcription
If your browser does not render page correctly, please read the page content below
Research article
Received: 5 February 2013               Revised: 19 March 2013         Accepted: 8 April 2013                    Published online in Wiley Online Library

(wileyonlinelibrary.com) DOI 10.1002/jms.3218

Sodium adduct formation efficiency in ESI source
Anneli Kruve,* Karl Kaupmees, Jaanus Liigand, Merit Oss and Ivo Leito
Formation of sodium adducts in electrospray (ESI) has been known for long time, but has not been used extensively in practice,
and several important aspects of Na+ adduct formation in ESI source have been almost unexplored: the ionization efficiency of
different molecules via Na+ adduct formation, its dependence on molecular structure and Na+ ion concentration in solution,
fragmentation behaviour of the adducts as well as the ruggedness (a prerequisite for wider practical use) of ionization via Na+
adduct formation. In this work, we have developed a parameter describing sodium adducts formation efficiency (SAFE) of neutral
molecules and have built a SAFE scale that ranges for over four orders of magnitude and contains 19 compounds. In general,
oxygen bases have higher efficiency of Na+ adducts formation than nitrogen bases because of the higher partial negative charge
on oxygen atoms and competition from protonation in the case of nitrogen bases. Chelating ability strongly increases the Na+
adduct formation efficiency. We show that not only protonation but also Na+ adduct formation is a quantitative and reproducible
process if relative measurements are performed. Copyright © 2013 John Wiley & Sons, Ltd.

Keywords: electrospray; sodium adducts; ionization efficiency; mass spectrometry

Introduction                                                           phase-basicity are highly responsive in ESI/MS only if compounds
                                                                       also have high basicity in the solvent phase.
Electrospray (ESI) is the most commonly used ionization mode to           As far as known to the authors, no models have been proposed
connect liquid chromatography to mass spectrometry.[1] Several         specifically for adduct formation via ESI. There is no universal way
types of ions may be formed depending on the compound,                 to decide to what extent a compound forms sodium adduct in
solvent and ESI parameters.[2] Most commonly singly or multiply        ESI and how this extent depends on molecular structure and ion-
protonated ions are observed in positive ionization mode and are       ization conditions. These questions are essential if quantitative
used in both qualitative and quantitative analysis. In addition to     analysis via adduct formation is desired. Still the cation and neu-
these, also adducts with cations and anions – depending on the         tral interactions have been studied in the gas phase. It has been
ionization mode used – may be observed,[2] e.g. in the case of         observed that interaction between sodium cation and a neutral
Na+ according to Eqn (1):                                              molecule in the gas phase are electrostatic by their nature.[13]
                                                                       Things are more complex for adducts response in ESI as has been
                                 ΔGNa                                  described by Schug et al.[14] In this paper, it was observed that
                        M þ Naþ ⇄ ½M þ Naþ                      (1)
                                                                       response of sodium adducts [2M-2H + Na]- in negative ionization
                                                                       mode are somewhat correlated (R2 = 0.51 calculated from the
   The most common cations forming adducts are sodium, potas-          data presented in[14]) to changes of the pKa value of the studied
sium and ammonium in positive ionization mode.[2] In some              halide-substituted benzoic acids. On the other hand, responses
cases, it has been observed that these adducts give significantly       for amino-substituted benzoic acids followed, similarly to
higher sensitivity compared to protonation (or deprotonation)          deprotonated ions, the order of hydrophobicity (expressed by
and can be used for quantitative analysis.[3,4] In case of sodium      octanol–water partitioning coefficient).
adducts besides the 1:1 adducts corresponding to Eqn (1), forma-          Recently, an ionization efficiency scale of small molecules via
tion of multimers, such as [2M + Na]+, [3M + Na]+, etc. in positive    protonation was introduced by our group.[15,16] Qualitative con-
ionization mode[5] but also adducts [2M-2H + Na]- in negative          clusions were drawn from that scale leading to the understand-
ionization mode[6] have been described. Generally adducts are          ing that for the group of these compounds, the size of the
not considered easy to work with – the reproducibility of their        molecule (though strongly correlated to the hydrophobicity)
signals is poor (adduct formation is sensitive to the ionization       and basicity (pKa) are the most important parameters describing
conditions and adducts are prone to decomposition), and the            ionization efficiency of the analytes via protonation. Only very
corresponding mass spectra are more complex to interpret.[7] In        limited information of the same type is available for ionization
addition, Crescenzi et al.[8] noticed that adducts mostly fragment     via sodium adduct formation.
yielding only sodium ion making quantitative analyses of                  In this paper, we demonstrate that the previously established
mixtures very difficult.                                                procedure[15] for measurement of the ionization efficiency of
   In order to better understand the ionization process, several       protonation-based ionization in the ESI source can also be used
empirical models have been proposed for describing the ESI             for studies of ionization via sodium adduct formation according
process.[9,10] Henriksen et al.[11] showed that ionization via pro-
tonation cannot be fully described neither by proton affinity
                                                                       * Correspondence to: Anneli Kruve, Institute of Chemistry, University of Tartu,
(pKa value) in solvent phase nor by analyte’s affinity for the drop-      Ravila 14a, Tartu 50411, Estonia. E-mail: anneli.kruve@ut.ee
let surface (described by octanol–water distribution coefficient).
                                                                                                                                                            695

Ehrmann et al.[12] also showed that compounds having high gas            Institute of Chemistry, University of Tartu, Ravila 14a, Tartu, 50411, Estonia

J. Mass Spectrom. 2013, 48, 695–702                                                                      Copyright © 2013 John Wiley & Sons, Ltd.
A. Kruve et al.
to Eqn (1). We present a scale of sodium adducts formation effi- oxamyl (m/z = 220; 242, analytical standard, Dr. Ehrenstorfer),
ciency (SAFE) based on relative measurements and containing methiocarb (m/z = 226, analytical standard, Dr. Ehrenstorfer),
19 compounds – 18 oxygen bases and 1 nitrogen base. The scale triphenylamine (m/z = 246, pure, recrystallized once from ethanol
spans over more than four orders of magnitude. It is demon- (96%), Reakhim), ((CH3)2N)3-P = N-C6H5 (m/z = 255,[18]), imidacloprid
strated that because of the relative nature of the measurements, (m/z = 256; 278, analytical standard, Dr. Ehrenstorfer), vamidothion
the scale is insensitive to varying sodium concentration. For all (m/z = 288, 310, 99.0%, Dr Ehrenstorfer GmbH), buprofezin
Na+ adducts, the most probable structure is proposed according (m/z = 306, analytical standard, Dr. Ehrenstorfer), epoxiconazole
to DFT/COSMO-RS computations. (m/z = 330, analytical standard, Dr. Ehrenstorfer), fluquinconazole
(m/z = 376, analytical standard, Dr. Ehrenstorfer), 2,6-(NO2)2 -
C6H3-P1(pyrr) (m/z = 423,[18]), 2,6-Cl2-4-NO2-C6H2-P1(pyrr) (m/z = 447,[18]),
Experimental N,N’-(CHPh2)2-bispidine (m/z = 459,[19]), 9-O-1,5-N,N’-(CHPh2)2-bispidine
(m/z = 473,[19]), EtP2(dma) (m/z = 494, Sigma Aldrich >98%), PhP2
Chemicals
(pyrr) (m/z = 518,[18]) and (C4H8N)3-P = N-(C4H9N)2-P = N-C6H4-2-Cl
The compounds included in the establishment of the scale were (m/z = 552,[18]).
glyceryl triacetate (99%, Sigma), ethylene glycol diacetate (99%,
Sigma Aldrich), glyceryl tributyrate (99%, Sigma Aldrich), dimethyl
phthalate (≥99% by GC, Merck), dimethylmaleate (> 90%, Merck),
MS studies of sodium adduct formation
dimethyl succinate (> 98%, Merck), dimethyl glutarate (>99%,
Merck), dimethylmalonate (>99%, Merck), vamidothion (99.0%, The measurements were carried out using an Agilent XCT ion
Dr Ehrenstorfer GmbH), thiamethoxam (99.0%, Dr. Ehrenstorfer trap mass spectrometer. The MS and ESI parameters were not op-
GmbH), m-methoxybenzoic acid (99%, Sigma-Aldirich), 2- timized (except for setting the TM, see below), but the factory
(trifluoromethanesulfonyl)benzoic acid (a kind gift from prof. L. M. defaults were used: nebulizer gas pressure 15 psi, drying gas flow
Yagupolskii, Institute of Organic Synthesis, Kiev), benzophenone rate 7 l/min, drying gas temperature 300 C. The capillary voltage
(pure, Reakhim), benzamide (pure, Reakhim), 2-cyanophenol between MS and nebulizer was 3500 V. All other ion transporta-
(99%, Sigma Aldrich), phenyl benzoate (pure, Reakhim), benzoic tion parameters were determined by the TM parameter. The ion
acid (pure, Reakhim), ethyl benzoate (98%, Sigma Aldrich) 1,10- trap parameters were: Smart Target (parameter characterizing
phenantroline (pure, Reakhim). the number of ions accumulated in the trap) was 100 000, and
Also, pyridine (>99.9%, Sigma-Aldrich), acridine (>97%, Fluka), Maximum Accumulation Time 300 ms. Each spectrum was
quinoline (>98%, Aldrich), 2,6-diamino pyridine (>98%, Aldrich), scanned from 30 to 1000 m/z; five spectra were averaged by
2,2’-bipyridine (a kind gift from Prof. M. Mishima, Kyushu Univer- MS data processing, and before calculations, the spectra were
sity), 2-methoxypyridine (the same as in ref 17), 4-methoxypyridine additionally averaged over 2 min collection time.
(the same as in ref 17), 2,6-dimethoxypyridine (>98%, Aldrich), 2- The compounds solutions were mixed together by t-piece so
chloropyridine (>99%, Aldrich), 1-methylimidazole (>99%, Sigma- that the overall solution flow rate was 8.3 ml/min (0.5 ml/h). Con-
Aldrich) and 2-methylpyridine (the same as in ref 17) were tested centrations of the studied compounds in the spray were in the
for adduct formation in both solvents used throughout the paper. range of 3 10-7 to 4 10-5 mol/l. Two different solvent composi-
Acetonitrile (J.T.Baker, Deventer, The Netherlands), ultra pure tions were used: (1) 80% (v/v) of acetonitrile and 20% of 0.1%
water (purified with Millipore Advantage A10 MILLIPORE GmbH, formic acid in ultra pure water (the same as in refs 15 and 16)
Molsheim, France), formic acid (Riedel-de Haёn) and sodium acetate and (2) 80% (v/v) of acetonitrile and 20% of 0.1 mol/l solution
(pure, Reakhim, Soviet Union) were used as solvent components. of sodium acetate in ultra pure water. When using solvent 1 then
The compounds included in the target mass (TM) (either providing according to ICP-MS measurements (made at Tallinn Water Ltd.
[M + H]+, [M + Na]+ or fragments) study were the following (m/z value Laboratories), the sodium content in the spray caused by the
refers to the ion formed in the ESI source): ethylamine hydrochloride trace impurities present in the solvent chemicals and glassware
(m/z = 46, 98%, Aldrich), guanidine (m/z = 60, pure, Reakhim), ranged from 9 10-6 to 1.3 10-4 mol/l.
pyrrolidine (m/z = 72, >98%, Fluka), tetramethylammonium chloride All measurements were carried out using three different TM
(m/z = 74, puriss. p.a., for ion pair chromatography, Fluka Analytical), values: m/z of [M1 + H]+ of the first compound, m/z of [M2 + H]+
pyridine (m/z = 80, >99,8 %, Fluka) piperidine (m/z = 86, >99.5%, of the second compound and 500; at each TM value, MS signals
Sigma-Aldrich), aniline (m/z = 94, 18), triethylamine (m/z = 102, 99%, of the investigated ions were recorded and averaged over
Aldrich), 1-ethyl-3-methylimidazolium trifluoromethanesulfonate 2 min. These TM values were kept the same as in the previous
(m/z = 111, high purity, Merck), 1,1,3,3-tetramethylguanidine ionization efficiency measurements via protonation[15,16] due to a
(m/z = 116, 99%, Aldrich), N,N-dimethylaniline (m/z = 122, pure, small difference between the masses of protonated molecules
Reakhim), tetraethylammonium perchlorate (m/z = 130, puriss., and sodium adducts (Δ m/z 22). For the second reason as doing
Fluka), 4-nitroaniline (m/z = 139, pure for analysis), 1-naphtylamine so same measurement procedure can be used to measure proton-
(m/z = 144, pure, Reakhim), 4-fluoro-3-nitroaniline (m/z = 157, 97%, ation and adduct formation at the same time. The discussion about
Sigma-Aldrich), dimethyl glutarate (m/z =161, ≥99% by GC, Merck), using different TM values is presented below.
1-hexyl-3-methylimidazolium bis(trifluoromethanesulfonyl)imide In calculations, only 1:1 adducts were taken into account
(m/z = 167, high purity, Merck), sulfanilamide (m/z = 173, for micro- according to Eqn (1). Similar to ionization efficiency via proton-
analysis, Carlo Erba), acridine (m/z = 180, ≥97% (HPLC), Fluka), ation, termed as IE (or logIE on logarithmic scale) established ear-
tetrapropylammonium chloride (m/z 186, purum; ≥98.0% (AT), lier[15], we define the absolute ionization efficiency for adducts as
Fluka Analytical), aldicarb (m/z = 191, analytical standard, R([Mi + Na]+) = Ri/Ci where Ri is the MS response of the adduct
Dr. Ehrenstorfer), dimethyl phthalate (m/z = 195, ≥99% by GC, [Mi + Na]+ at concentration Ci. As it is complicated to measure
Merck), imazalil (m/z = 201; 255; 297, analytical standard, absolute ionization efficiencies, we focus on measuring the SAFE
696
Dr. Ehrenstorfer), diphenylguanidine (m/z = 212, pure, Reakhim), of a compound M1 relative to M2:
wileyonlinelibrary.com/journal/jms Copyright © 2013 John Wiley & Sons, Ltd. J. Mass Spectrom. 2013, 48, 695–702Sodium adduct formation efficiency in ESI source
molecular surface segments using the polarization charge den-
R ½M1 þ Naþ R1 R2 R1 C2 sity maps of the species created in the first step taking into ac-
SAFE ðM1 =M2 Þ ¼ þ ¼ = ¼ (2)
R ½M2 þ Na C1 C2 R2 C1 count the concentrations of the respective species in the
solution.[21] Terms accounting for vibrational contributions to
the Gtot are also added in this step. This is done implicitly, as
In order to make the data easier to present and analyse, a these are represented through the experimental data used for
logarithmic scale was used. For one measurement, five different parametrization of the method. The energetics of these interac-
concentration ratios of two analytes were measured and logSAFE tions are calculated at 298 K using a statistical thermodynamics
values were averaged. In order to find absolute values, the scale procedure whereby also the conformers of all the interacting spe-
was anchored to dimethylglutarate – one of the most extensively cies are taken into account and statistically weighted based on
measured compound in this scale – taken arbitrarily as 0. The their relative stabilities.[21] This way the entropy effect of the
logSAFE values assigned for each compound were the result of same species present in multiple conformers is also accounted
least squares minimization procedure as described previously in for. As a result, a Gtot value is found for every species. From the
ref 17 The measurement uncertainty aspects of this approach Gtot values of the species, the ΔGNa is found.
have been addressed by Sooväli et al.[20]
Results
COSMO-RS/Turbomole computations
The results of the logSAFE measurements are presented in
The logP values (solvent (1)/vacuum) of the sodium adducts as Table 1. Altogether 66 relative measurements with 19 compounds
well as the Gibbs free energies of the species in Eqn (1) (needed were carried out during the period of 2006 to 2012 by four differ-
for the calculation of the Gibbs’ free energy of adduct formation ent persons. Every measurement was made at five concentration
ΔGNa) were calculated using the COSMO-RS method.[21] This ratios varying by a factor of at least 4. The resulting scale has
method, different from most others, can be used for computa- consistency standard deviation (see ref 17) of 0.19 log units, which
tions in solvent mixtures[21] and is able to handle preferential can be taken as a measure of reproducibility of the relative
solvation of the solutes by one of the mixture components.[22] measurements, and spans for 4.5 orders of magnitude. The
As the first step, full geometry optimization and energy average within-day repeatability within compound pairs was
calculation at DFT BP TZVP level with the RI approximation and below 0.19 log units. The good consistency of the scale refers to
applying the COSMO continuum solvation model was carried the possibility of obtaining good repeatability also for quantitative
out for all species of Eqn (1) and solvent molecules using the LC/ESI/MS analyses using sodium adducts for quantification,
Turbomole V 6.2 software package.[23] Different starting geome- although internal standards also ionizing by forming sodium
tries were used, based on common chemical knowledge of the adducts might be necessary to account for small changes of the
species involved. For most species, several conformers corre- concentration of available sodium cations in solvent.
sponding to different local energy minima were found (ranging In order to be able to use the same measuring system for both
from 1 to 23 conformers). These were all taken into account by protonated molecular ions and adducts, the same MS parameters
statistical weighting inherent in the COSMO-RS procedure (see were used as for the ionization efficiency scale measurements
below). The default convergence criteria of Turbomole were used described by Oss et al.[16] A key parameter for optimizing the
(wavefunction convergence: max difference 10-6 Hartree; geome- transmission efficiency of the ion optics of the used MS system
try convergence: max gradient |dE/dxyz| 10-3 Hartree/Bohr). This is TM (for more information please see ref 15). In simplified terms,
first computation step yields for every conformer the following the value of TM should be set to the m/z ratio of the ion of inter-
data: (1) the geometry of the conformer, (2) detailed data on est. In our studies, measuring the efficiency of ionization of the
the shape of the molecular cavity, (3) the polarization charge compounds in the ESI source is desired and not the ion transport
densities mapped onto the cavity surface and (4) the total elec- efficiency in the mass spectrometer. Therefore, the ionization
tronic energy of the species submerged into a virtual conductor transport efficiency should be adjusted to as similar as possible
(e = 1). level for all the measured ions that are used to calculate the logIE
As the second step, the COSMO-RS calculation was carried out as well as logSAFE values. It is not essential to have the highest
on all species using the above listed data as input data with the possible transmission efficiency for each of the ions but to
COSMOtherm software package Version C3.0, Release 12.01.[24] have as close as possible transmission efficiencies for the ions
COSMO-RS calculation takes into account the interactions formed from the different compounds. During measurements
between the species of Eqn (1) and the solvent/medium mole- we observed significant influence of the TM value on the overall
cules, as well as between the solvent molecules themselves (the ionization efficiency, especially for compound pairs having higher
implicit solvation model is used). The solvent composition is in- m/z values and larger m/z difference.
put as it was in the experiment (i.e. including the concentration Therefore, we studied the dependence of the MS response for
of water in the solvent). Zero concentrations of the species of compounds with different m/z values on TM. 45 compounds, either
Eqn (1) are used. This way, the interactions between the species protonated, adducts or fragments formed in source (named in
and the solvent components are taken into account, but not Experimental section) with m/z ranging from 46 to 552 were mea-
the interactions between the species themselves. This situation sured at 96 different TM values ranging from 50 to 1000 with the
corresponds well to the reality of very low concentrations used increment of 10 units. The TM values were changed in random or-
in the experiments. Both van der Waals interactions (electrostatic der. For each compound included in the study, all of the MS re-
interactions, such as dipole–dipole, ion–dipole, etc. and disper- sponses were normalized against the highest intensity observed
sion forces) and hydrogen bonds (in the implicit way) are taken over all TM values. As other parameters (e.g. concentration of
into account. The interactions are quantified via statistical analytes) were kept constant, the relative intensities reflect the ion
697
counting and averaging of energies of pair-wise interactions of transport efficiency. The obtained results are presented in Fig. 1.
J. Mass Spectrom. 2013, 48, 695–702 Copyright © 2013 John Wiley & Sons, Ltd. wileyonlinelibrary.com/journal/jms698
Table 1. The assigned logSAFE values, averaged ΔlogSAFE values for all 66 measurements, calculated partioning coeficient logP, NBO partial caharges and bond lenghts for sodium-heteroathom ‘bonds’
in adducts
Compound logSAFE ΔlogSAFEa logPsolv/vacuumb NBOc Bond lenghtd
Vamidothion 1.49 10.14 0.99; -0.59 2.24(C = O);
2.28(P = O)
Glyceryl tributyrate 1.29 6.35 0.55; -0.55 2.31; 2.31
1,10-phenantroline 1.17 8.97 0.34; -0.34 2.43; 2.43
Glyceryl triacetate 0.78 9.46 0.54; -0.54 2.32; 2.32
Dimethyl phthalate 0.51 10.21 0.54;-0.53 2.37; 2.39
Thiamethoxam 0.31 17.58 0.37; -0.43 2.47(O);
2.45(N)
wileyonlinelibrary.com/journal/jms
Dimethylglutarat 0.00 8.07 0.55; -0.54 2.32; 2.32
Dimethylmaleate 0.71 8.69 0.54; -0.52 2.31; 2.31
Dimethylsuccinate 0.78 8.86 0.56; -0.56 2.34; 2.35
Phenyl benzoate 0.93 10.22 0.52 2.32
Ethylene glycol diacetate 1.28 8.30 0.54; -0.54 2.32; 2.32
Dimethylmalonate 1.25 10.05 0.54; -0.53 2.35; 2.36
Benzophenone 1.38 13.09 0.49 2.32
2-(trifluoromethane) 1.49 14.09 0.52; -0.80 2.37(O);
sulfonylbenzoic acid 2.42(SO2)
Benzamide 1.66 15.48 0.56 2.26
Benzoic acid 2.40 16.53 0.54; -0.64 2.29
p-methoxybenzoic acid 2.64 16.58 0.55 2.28
Ethyl benzoate 2.82 12.34 0.55 2.26
2-cyanophenol 3.01 17.93 0.59; -0.28 2.47(O);
2.68(N)
Compounds not yielding MS signal for [M + Na]+
Pyridine NA 12.96 0.39 2.41
Acridine NA 13.18 0.36 2.43
Copyright © 2013 John Wiley & Sons, Ltd.
Quinoline NA 13.32 0.37 2.42
2,6-diamino pyridine NA 14.68 0.49; -0.75 2.47(N);
2.65(NH2)
2,2´-bipyridine NA 9.23 0.35; -0.35 2.43; 2.43
2-methoxy pyridine NA 10.33 0.40(N); 2.45
-0.40(O)
4-methoxy pyridine NA 13.13 0.40 2.40
2,6-dimethoxy pyridine NA 10.40 0.41(N); 2.44(N);
-0.40(O) 2.42(O)
2-chloropyridine NA 12.73 0.39 2.44
1-methylimidazole NA 12.69 0.42 2.38
2-methylpyridine NA 12.03 0.41 2.41
a
Every arrow represents the average of measurements using at least five concentration ratios. Values marked with a box are measured in Solvent 2, unmarked values were measured in Solvent 1.
b
Partioning coeficients calculated with COSMO-RS between solvent (1) and vacuum for the adducts.
c
NBO partial charges calculated with Turbomole
d
Bond lengths between the heteroatom and sodium of lowest energy conformer in solvent in Å. In brackets, the functional group is identified if heteroathoms from different functional groups bind to sodium.
A. Kruve et al.
J. Mass Spectrom. 2013, 48, 695–702Sodium adduct formation efficiency in ESI source
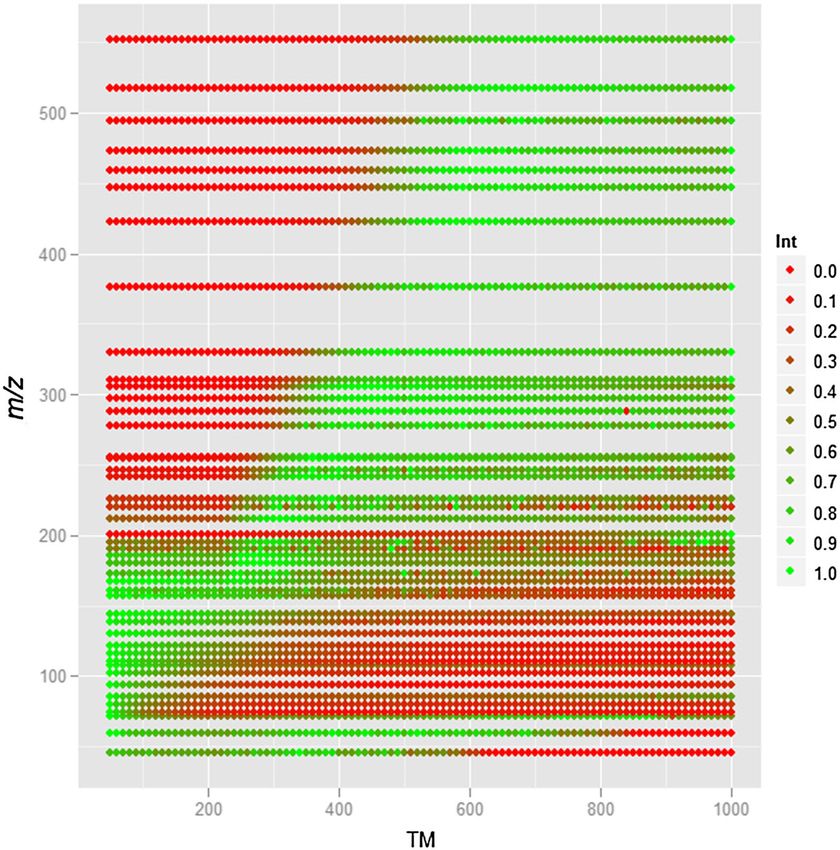
Figure 1. The relative intensities for peaks with m/z values ranging between 46 and 552 for Target Mass values between 50 and 1000 with increment of
10 units. Red dots indicate low intensity, green dots indicate high sensitivity.
As defined by Eqn (1), calculations carried out in this study are conclusions can be drawn. It can be seen that the ion transport
based only on adducts [M + Na]+. Higher aggregates such as efficiency is strongly but not linearly dependent on TM. More
[2M + Na]+ or [3M + Na]+ were not included in this study. As full precisely, two different regions can be seen in Fig. 1. One region
spectra in m/z from 50 to 1000 were registered, such aggregates is observed below m/z 200 and the second above m/z 200. In
could still be seen if formed in scanned spectra. Out of the the lower region, the optimal TM is somewhat independent of
compounds included in this study, only glyceryl tributyrate and the studied compounds m/z. For all compounds studied in this
glyceryl triacetate formed sodium-bound dimers [2M + Na]+. In region, the optimal TM was the lowest TM included in this study
the concentration range 10-5 to 10-6 M, both compounds – 50. For compounds with m/z above 200, the optimal TM is
formed both [M + Na]+ and [2M + Na]+ but at lower concentra- dependent on the m/z of the compound of interest. For exam-
tions (10-6 to 10-7 M) only [M + Na]+ were observed in the mass ple, for compound with m/z of 250, the optimal TM would be
spectra. This was found not to influence the SAFE. For example, between TM 400 and 500; at the same time for compound with
logSAFE measurement between vamidothion and glyceryl m/z of 450, the optimal TM would be between 600 and 700.
tributyrate using higher glyceryl tributyrate concentration was Therefore, different analytes need different TM values for opti-
0.20 0.08 and at lower concentration 0.15 0.11 (both values mal ion transport.
are averaged over five measurements within one day). These differences in ion transport efficiency strongly influ-
ence the results of logSAFE measurements. In this study,
analytes with m/z from 142 to 326 were included into the
logSAFE scale. It is seen from Fig. 1 that the only TM value
Discussion suitable for comparisons of compounds with different m/z
would be 500 (with some simplification). If even wider range
MS ion transport parameters
of analytes is desired to measure, then different TM values
From the ion transport efficiency graph (Fig. 1), the relative for different analytes have to be used and averaging
intensities (compared to the highest intensity observed) for ions within one TM value should not be used. Choosing the appro-
with different m/z values are presented as a function of the TM priate TM value for a specific m/z value is another issue. It can
values. In this study, a number of compounds were included, be seen from Fig. 1 that optimal TM value is not linearly
which were not forming sodium adducts (see the dependent on analytes m/z. Therefore, in case of measure-
Experimental section for details). Even though Fig. 1 reveals ments of compounds with wider m/z range, a more complex
some variation in results due to MS instability (some red dots function for finding optimal ion transport parameters has to
699
indicating low intensity inside the green regions), some general be established.
J. Mass Spectrom. 2013, 48, 695–702 Copyright © 2013 John Wiley & Sons, Ltd. wileyonlinelibrary.com/journal/jmsA. Kruve et al.
Fragments and sodium concentration adducts in solvent 1. The reason for this is that 1,10-phenanthroline
is significantly more basic than any other compound in the scale.
When calculating ionization efficiency from the MS data, it is very
The aqueous pKa value of protonated 1,10-phenanthroline in
important to know which ions observed in the spectrum result
water is 5.0,[25] while the pKa values of the protonated forms of
from the same ionization process. In previous measurements by
the oxygen bases in water are around or below zero (see ref 16
Leito et al.[15] and Oss et al.[16] of ionization via protonation, it
for the pKa values of some of them).
was assumed that fragments observed in the spectrum result
from the fragmentation of the protonated parent ion after it
has evaporated from the droplet. When building the ionization
Sodium adduct formation and molecular structure
efficiency scale via Na+ adduct formation and when fragment
ions are seen in the spectra, then it is important to determine With all the 19 compounds measured experimentally (and addi-
whether they come from sodium adducts (in which case their in- tional 11, which did not form sodium adducts), computations of
tensity has to be taken into account) or from protonated mole- the structures of the Na+ adducts were carried out, and some
cules (in which case their intensity must not be taken into general conclusions can be drawn from the data. The most likely
account). For this, the solvent 2 (0.1 M sodium acetate was used geometry types of the adducts obtained from computations are
instead of 0.1% formic acid) was introduced besides solvent 1. presented in Table 2. The partial charges on heteroatom(s) bond-
In this (mildly basic) solvent, only the sodium adducts (and not ing with sodium ion in the neutral molecules, the lengths of the
the protonated forms) form during ionization (because of the sodium–heteroatom bonds as well as the computed partitioning
very high sodium ion concentration compared to the quite low coefficients of the complex between solvent 1 and vacuum are
H+ concentration). Therefore, any fragments seen in spectra presented in Table 1.
obtained with solvent 2 are formed from [M + Na]+. Three com- Table 1 reveals that out of the 19 compounds yielding sodium
pounds (prone to fragmentation[15]) were tested – namely di- adducts in the mass spectra, 18 are oxygen bases. The only nitro-
methyl phthalate, dimethylmalonate, dimethylsuccinate and gen base, out of those included in this study, yielding a sodium
dimethylglutarate. No fragments were observed in the mass adduct, is 1,10-phenanthroline. The main reason could be that
spectra obtained with solvent 2; only adducts were observed. formation of Na+ adduct is governed largely by ion–dipole attrac-
Therefore, it was concluded that fragmentation occurred only tion, rather than formation of covalent bond[13] and the partial
with the protonated ions and building the logSAFE scale taking charges on oxygen atoms are as a rule more negative than on
into account only [M + Na]+ is valid. Other compounds studied the nitrogen atoms.
in this work did not give fragments neither in solvent 1 nor 2. However, close look at the partial charges on the oxygen
Also, as fixing the sodium concentration in the solvent was not atoms bound to Na+ in the complex in Table 1 reveals that there
desired, it was tested if sodium concentration influences the is no correlation between the partial charge and logSAFE value.
logSAFE scale on the example of the same compounds. Eight Looking at the partial charges on the nitrogen atoms in 1,10-
pairs of compounds (marked in Table 1 with boxes) were mea- phenanthroline and the remaining nitrogen bases, it can be seen
sured in solvent 2, and it was observed that these measurements that the charges on nitrogen atoms in 1,10-phenanthroline are by
are consistent with the ones observed in solvent 1 as shown in far not the most negative.
Table 1. One of the compounds – 1,10-phenanthroline – gave The adduct-forming ability of nitrogen bases is strongly
sodium adduct only in solvent 2. Most probably, this occurs suppressed by the competition from protonation. All of the nitro-
because of the competition between protonation and formation of gen bases used in this work are significantly stronger bases than
Table 2. Structure types of adducts
A B c d
Structure type
Compounds Vamidothion, Glyceryl Phenyl benzoate, Benzo-phenone, 2-cyanophenol 1,10-phenantroline
tributyrate, Glyceryl triacetate, Benzamide, Benzoic acid, Thiamethoxam
Dimethyl phthalate, Dimethylglutarate, p-methoxy-benzoic acid,
Dimethylmaleate, Dimethylsuccinate, Ethyl benzoate
Ethylene glycol diacetate, Dimethylmalonate
2-(trifluoromethane)-sulfonylbenzoic acid
700
wileyonlinelibrary.com/journal/jms Copyright © 2013 John Wiley & Sons, Ltd. J. Mass Spectrom. 2013, 48, 695–702Sodium adduct formation efficiency in ESI source
the oxygen bases, with aqueous pKa values of their conjugate tridentate adducts. The possible reason is that formation of the
acids in the range of 2–6[26] (except for 2,6-diaminopyridine with third coordinative bond, although possible, would result in
pKa value of its conjugate acid 7.3[27]). The conjugate acids of the strongly decreased solvation (as the polar surface area would
oxygen bases are expected to have close to zero or negative pKa decrease) and additional loss of conformational degrees of
values.[16] The nitrogen bases exist largely in the protonated form freedom (leading to entropy penalty). In the gas phase where
in solvent 1. In solvent 2, these bases exist mostly as neutral the solvation effect is missing, the tridentate adducts were found
molecules; however, it may well be that the small fraction of pro- by ca 2.4 kcal/mol more stable than the bidentate adducts.
tonated base present at higher pH is still more successful in being Similar to the previously established logIE scale for [M + H]+
ejected from the drop than the sodium adduct, because the latter ions, logSAFE was somewhat correlated (R2 = 0.38) with the loga-
is significantly more hydrophilic – the positive charge of the rithm of adducts partitioning coefficient between vacuum and
adduct is largely localized on Na+, while in the protonated base, solvent (the more negative the logP, the more intense is the
it is delocalized over the ion. adduct signal in MS). One of the compounds included in this
Looking at Table 1 reveals also that there is no correlation study – thiamethoxam – significantly deviates from the correla-
between the Na+–X distances (X - the coordinating atom) and tion. With the exclusion of this compound, the correlation would
the logSAFE values. It is also noticeable that neither partial be R2 = 0.58. The poor correlation most probably arises from the
charges on the hetero atoms bonding to sodium nor bond fact that partition coefficient describes complete solvation of
lengths in adducts correlate to the SAFE (according to the visual the analysed ion while for ion evaporation model, it is dependent
analyses). Although compounds giving quantifiable amount of on analyte surface activity. Also, multilinear regression (as
adduct in MS spectrum tend to have more negative partial described in[16]) between logSAFE and several parameters (such
charges on the heteroatom and shorter bond lengths. as equilibrium constants for reaction 1 also calculated by COSMO-
It is clear that one of the most important properties in deter- RS, sum of the partial charges on the heteroatom coordinating with
mining the ionization efficiency of the oxygen bases by Na+ sodium during adduct formation, logP) but no significant improve-
adduct formation is the chelating ability of the base. Most of ment compared to correlation with logP was observed.
the studied oxygen bases are able to chelate Na+, and the whole
upper half of the scale in Table 1 is composed of such
compounds. This is the case of the structure types a, c and d. Conclusions
Compounds corresponding to type a form stable six- to nine-
member rings via chelation. Stable chelated structures are also In this work, sodium adduct formation in ESI for small molecules
formed in the case of sample structure c, where coordinative has been studied, and a self-consistent scale describing ioniza-
bonds are given by different electronegative atoms. In addition, tion efficiency of 19 different compounds via sodium adduct for-
the only non-oxygen base, which was found to give a quantifi- mation has been compiled. The measurements of the scale are in
able adduct signal in mass spectra, 1,10-phenanthroline, shows a good agreement indicating good long-term reproducibility of
strong chelating properties. Nevertheless, the situation with ni- adduct formation if relative measurements are used. Also, relative
trogen bases is more complex: the 2- and/or 6 substituted measurements are shown to be independent of sodium ion
amino- and methoxypyridines do not give sodium adducts signal concentration in the solvent.
in MS spectra, in spite of their chelating abilities demonstrated by It is demonstrated that the adducts studied in this work do not
the COSMO-RS calculations. For 2,2-bipyridine, computational[28] fragment in the ion source and that their signal intensities in ESI/
and experimental evidence[29] from the literature as well as com- MS are somewhat correlated to their computational partitioning
putational evidence from this work suggest that trans conformer coefficients between vacuum and solvent.
is much more stable than the cis conformer. The difference of the
conformer stabilities in the solvent used in this work was found
to be 2.4 kcal mol-1 (calculated with COSMO-RS). On the other Acknowledgements
hand, stable adduct can only be formed from the cis conformer, This work has been supported by PUT 34 from Estonian Research
which means that there is around 2 kcal mol-1 penalty for sodium Council, Grant ETF8572 from Estonian Science Foundation and by
adduct formation in the case of 2,2-bipridine, as compared to the targeted financing project SF0180061s08 from the Estonian
1,10-phenanthroline, where the geometry corresponding to cis Ministry of Education and Science and carried out in part in the
conformation is fixed. High Performance Computing Centre of University of Tartu. We
For group b, no chelating upon sodium adduct formation is are grateful to Dr. Charly France Alexandre Mayeux for insightful
observed, and the sodium cation gives only one coordinative bond discussions.
with the carbonyl oxygen. There are other oxygen atoms with high
negative partial charge available in those molecules (except benzo-
phenone), but chelated structure would involve four-member
References
rings, which are sterically unfavorable. The only compound where [1] R. Aebersold, M. Mann. Mass spectrometry based proteomics.
a four-member ring was found is thiamethoxam. The probable rea- Nature. 2003, 422, 198–207.
son is the rather unusual spatial arrangement of the heteroatoms [2] N.B. Cech, C.G. Enke. Practical implications of some recent stud-
ies in electrospray ionization fundamentals. Mass Spectrom. Rev.
and charge distribution on them in this compound. 2001, 20, 362–387.
It should be noted that according to the computations, both [3] A. Leitner, J. Emmert, K. Boerner, W. Lindner. Influence of Solvent
triesters, glycerol tributyrate and glycerol triacetate, form in the Additive Composition on Chromatographic Separation and Sodium
solvent phase preferentially bidentate adducts, where Na+ inter- Adduct Formation of Peptides in HPLC–ESI MS. Chromatographia
2007, 65, 649–653.
acts with only two carbonyl oxygen atoms (linked to the oxygen [4] N. Jonkers, H. Goovers, P. De Voogt. Adduct formation in LC-ESI-MS
atoms in positions 1 and 3 of the glyceryl moiety). Bidentate of nonylphenol ethoxylates: mass spectrometrical, theoretical and
701
adducts were found to be ca 0.3 kcal mol-1 more stable than quantitative analytical aspects. Anal. Chim. Acta 2005, 531, 217–228.
J. Mass Spectrom. 2013, 48, 695–702 Copyright © 2013 John Wiley & Sons, Ltd. wileyonlinelibrary.com/journal/jmsA. Kruve et al.
[5] M. Stefansson, P.J.R. Sjoberg, K.E. Markides. Regulation of Multimer [17] I. Kaljurand, A. Kütt, L. Sooväli, T. Rodima, V. Mäemets, I. Leito, I.A.
Formation in Electrospray Mass Spectrometry. Anal. Chem. Koppel. Extension of the self-consistent spectrophotometric basicity
1996, 68, 1792–1797. scale in acetonitrile to a full span of 28 pK(a) units: Unification of
[6] K. Schug, H.M. McNair. Adduct formation in electrospray ionization. different basicity scales. J. Org. Chem. 2005, 70, 1019–1028.
Part 1: Common acidic pharmaceuticals. J. Sep. Sci. 2002, 25, 760–766. [18] T. Rodima, I. Kaljurand, A. Pihl, V. Mäemets, I. Leito, I.A. Koppel. Acid–
[7] X.J. Yang, Y. Qu, Q. Yuan, P. Wan, Z. Du, D. Chen, C. Wong. Effect of base equilibria in nonpolar media. 2. Self-consistent basicity scale in
ammonium on liquid- and gas-phase protonation and deproton- THF solution ranging from 2-methoxypyridine to EtP1(pyrr)
ation in electrospray ionization mass spectrometry. Analyst phosphazene. J. Org. Chem. 2002, 67, 1873–1881.
2013, 138, 659–665. [19] L. Toom, A. Kütt, I. Kaljurand, I. Leito, H. Ottosson, H. Grennberg. A.
[8] C. Crescenzi, A. Di Corcia, E. Guerriero, R. Samperi. Development of a Gogoll. Substituent effects on the basicity of 3,7-diazabicyclo[3.3.1]
Multiresidue Method for Analyzing Pesticide Traces in Water Based nonanes. J. Org. Chem. 2006, 71, 7155–7164.
on Solid-Phase Extraction and Electrospray Liquid Chromatography [20] L. Sooväli, I. Kaljurand, A. Kütt, I. Leito. Uncertainty estimation in
Mass Spectrometry. Environ. Sci. Technol. 1997, 31, 479–488. measurement of pK(a) values in nonaqueous media: A case study
[9] P. Kebrale, L. Tang. From ions in solution to ions in gas phase – the on basicity scale in acetonitrile medium. Anal. Chim. Acta
mechanism of electrospray mass-spectrometry. Anal. Chem. 2006, 566, 290–303.
1993, 65, 972–985. [21] A. Klamt. COSMO-RS: From Quantum Chemistry to Fluid Phase
[10] C.G. Enke. A Predictive Model for Matrix and Analyte Effects in Thermodynamics and Drug Design, Elsevier Science Ltd: Amsterdam,
Electrospray Ionization of Singly-Charged Ionic Analytes. Anal. Chem. The Netherlands, 2005.
1997, 69,4885–4893. [22] K. Kaupmees, I. Kaljurand, I. Leito. Influence of water content on the
[11] T. Henriksen, R.K. Juhler, B. Svensmark, N.B. Cech. The Relative acidities in acetonitrile Quantifying charge delocalization in anions.
Influences of Acidity and Polarity on Responsiveness of Small J. Phys. Chem. A 2010, 114, 11788–11793.
Organic Molecules to Analysis with Negative Ion Electrospray [23] R. Ahlrichs, M. Bär, H.-P. Baron, R. Bauernschmitt, S. Böcker, M. Ehrig,
Ionization Mass Spectrometry (ESI-MS). J. Am. Soc. Mass Spectrom. K. Eichkorn, S. Elliott, F. Furche, F. Haase, M. Häser, H. Horn, C. Hattig,
2005, 16, 446–455. C. Huber, U. Huniar, M. Kattannek, M. Köhn, C. Kölmel, M. Kollwitz, K. May,
[12] B.M. Ehrmann, T. Henriksen, N.B. Cech. Relative Importance of Basic- C. Ochsenfeld, H. Öhm, A. Schäfer, U. Schneider, O. Treutler, M. von
ity in the Gas Phase and in Solution for Determining Selectivity in Arnim, F. Weigend, P. Weis, H. Weiss, TURBOMOLE V 6.2, 2010.
Electrospray Ionization Mass Spectrometry. J. Am. Soc. Mass [24] F. Eckert, A. Klamt, COSMOtherm, Version C3.0, Release 12.01,
Spectrom. 2008, 19, 719–728. COSMOlogic GmbH&CoKG, Leverkusen, Germany, 2011; Available
[13] B.C. Gou, B.J. Conklin, A.W. Jur Castleman. Thermochemical Proper- at http://www.cosmologic.de/
ties of Ion Complexes Na + ( M), in the Gas Phase. J. Am. Chem. Soc. [25] T.S. Lee, I.M. Kolthoff, D.L. Leussing. Reaction of ferrous and ferric ions
1989, 111, 6506–6510. with 1,10-phenanthroline; kinetics of formation and dissociation of
[14] K. Schug, H.M. McNair. A dduct formation in electrospray ionization ferrous phenanthroline. J. Am. Chem. Soc. 1948, 70, 3596–3600.
mass spectrometry II Benzoic acid derivatives. J. Chromatogr. A [26] A. Albert, E.P. Serjeant. Ionization Constants of Acids and Bases,
2003, 985, 531. A Laboratory Manual. Methuen: London, 1962.
[15] I. Leito, K. Herodes, M. Huopolainen, K. Virro, A. Künnapas, A. Kruve, [27] W.L.F. Armarego, C.L.L. Chai. Purification of Laboratory Chemicals.
R. Tanner. Towards the electrospray ionization mass spectrometry 7th ed, Elsevier, Oxford, 2013, p 427.
ionization efficiency scale of organic compounds. Rapid Commun. [28] J. Kalenik, Z. Pawelka. Solvent influence on the conformational
Mass Spectrom. 2008, 22, 379. equilibrium of 2,2 ’-bipyridine. J. Mol. Liq. 2005, 121, 63–68.
[16] M. Oss, A. Kruve, K. Herodes, I. Leito. Electrospray Ionization Effi- [29] L.L. Merritt, E.D. Schroeder. The Crystal Structure of 2,2’-Bipyridine.
ciency Scale of Organic Compounds. Anal. Chem. 2010, 82, 2865. Acta Cryst 1956, 9, 801–804.
702
wileyonlinelibrary.com/journal/jms Copyright © 2013 John Wiley & Sons, Ltd. J. Mass Spectrom. 2013, 48, 695–702You can also read