STATE OF THE POLAR BEAR REPORT 2019 - Susan J. Crockford - The Global Warming Policy Foundation Report 39 - GWPF
←
→
Page content transcription
If your browser does not render page correctly, please read the page content below
asdf

STATE OF THE POLAR BEAR REPORT 2019
Susan J. Crockford

  The Global Warming Policy Foundation
  Report 39
The State of the Polar Bear 2019
Susan J. Crockford

Cite as: Crockford SJ (2020) The State of the Polar Bear 2019. Report 39, The Global Warming Policy
Foundation.

ISBN 978-1-9160700-6-6
© Copyright 2020, The Global Warming Policy Foundation

                                              ii
Contents
Foreword	                                      v
About the author	                              v
Executive summary 	                           vii
1.    Introduction	                            1
2.    Conservation status	                     2
3.    Population size	                         2
4.    Population trends	                      12
5.    Habitat status 	                        15
6.    Prey base	                              20
7.    Health and survival 	                   23
8.    Evidence of flexibility 	               28
9.    Human/bear interactions	                30
10.   Discussion	                             40
References	                                   43
Notes	                                        67
About the Global Warming Policy Foundation	   80

                                    iii
iv
Foreword
From 1972 until 2010,1 The Polar Bear Specialist Group
(PBSG) of the International Union for the Conservation of
Nature (IUCN) published comprehensive status reports
every four years or so, as proceedings of their official meet-
ings, making them available in electronic format. Until
2018 – a full eight years after its last report – the PBSG had
disseminated information only on its website, updated
(without announcement) at its discretion. In April 2018,
the PBSG finally produced a standalone proceedings docu-
ment from its 2016 meeting,2 although most people would
have been unaware that this document existed unless they
visited the PBSG website.
      This State of the Polar Bear Report is intended to pro-
vide a yearly update of the kind of content available in
those occasional PBSG meeting reports, albeit with more
critical commentary regarding some of the inconsistencies
and sources of bias present in the corpus of reports and
papers. It is a summary of the state of polar bears in the
Arctic since 2014, relative to historical records, based on a
review of the recent and historical scientific literature. It is
intended for a wide audience, including scientists, teach-
ers, students, decision-makers and the general public in-
terested in polar bears and Arctic ecology.

About the author
Dr Susan Crockford is an evolutionary biologist and has
been working for 35 years in archaeozoology, paleozool-
ogy and forensic zoology.3 She is a former adjunct profes-
sor at the University of Victoria, British Columbia and works
full time for a private consulting company she co-owns
(Pacific Identifications Inc). She is the author of Rhythms
of Life: Thyroid Hormone and the Origin of Species, Eaten:
A Novel (a polar bear attack thriller), Polar Bear Facts and
Myths (for ages seven and up, also available in French, Ger-
man, Dutch, and Norwegian), Polar Bears Have Big Feet (for
preschoolers), and the fully referenced Polar Bears: Out-
standing Survivors of Climate Change and The Polar Bear Ca-
tastrophe That Never Happened,4 as well as a scientific paper
on polar bear conservation status.5 She has authored sev-
eral earlier briefing papers, reports, and videos for GWPF
on polar bear and walrus ecology and conservation.6 Susan
Crockford blogs at www.polarbearscience.com.

         v
Reports have yet to be published for
five Canadian polar bear population
surveys that were promised for 2019
or sooner.
                 vi
Executive summary
•       Reports have yet to be published for polar bear population sur-
veys of M’Clintock Channel and Viscount Melville (completed 2016),
Southern Beaufort and Gulf of Boothia (completed 2017) and Davis
Strait (completed 2018), yet all were promised for 2019 or sooner.
These may show increases in polar bear numbers or they may show
stable or even declining numbers – but we won’t know until we see
the results.
•       At present, the official IUCN Red List global population esti-
mate for the polar bear (2015) is 22,000–31,000 (about 26,000) but sur-
veys conducted since then would raise that average to about 29,500.
•       Despite having to deal with the greatest change in summer sea
ice habitat since 1979 of all Arctic regions, according to Norwegian
biologists polar bears in the Svalbard area of the Barents Sea showed
few negative impacts from the low sea ice years of 2016 through 2019.
•       Despite repeated claims that the Southern Beaufort subpopu-
lation is declining and nutritionally stressed, a summer survey of the
coast of Alaska in 2019 documented 31 fat healthy polar bears on-
shore in July, compared to only three in 2017, when sea ice retreat had
been similarly early.
•       Contrary to expectations, in 2019 freeze-up of sea ice in West-
ern Hudson Bay came as early in the autumn as it did in the 1980s
(for the third year in a row) and sea ice breakup in spring was like the
1980s as well, with the result that polar bears onshore were in excel-
lent condition.
•       If the public are to take seriously repeated claims of harm to
polar bear health and survival due to climate change, data collected
since 2004 on cub survival and weights of female polar bears in West-
ern Hudson Bay must be made available: it has now been more than
25 years since the last publication of such data, and polar bear special-
ists continue to cite decades-old figures to support their statements
that lack of sea ice is causing declines in body condition and popula-
tion size.
•       Since polar bear researchers acknowledge that there has been
no negative trend in either freeze-up or breakup dates for sea ice in
Western Hudson Bay since at least 2001, the failure to report current
data on cub survival and weights of female bears suggests that body
condition and cub survival have not declined over the last two dec-
ades as claimed.
•       Two separate incidents at opposite ends of the Russian Arctic
at the beginning and the end of 2019 made this the year of the po-
lar bear ‘invasion’. Belushya Guba in the Barents Sea over the winter
of 2018/2019 and Ryrkaypiy, Chukotka in December 2019 were each
besieged by more than 50 bears, which terrified local residents. Al-
though tragedy was ultimately averted, this is likely to be an on-going
problem for Arctic settlements in the future: not because there is not
enough sea ice but because there are now so many polar bears roam-
ing Arctic coastlines.

                    vii
1.     Introduction
The US Geological Survey estimated the global population of polar bears at 24,500 in 2005.7 In
2015, the IUCN Polar Bear Specialist Group estimated the population at 26,000 (range 22,000–
31,000)8 but additional surveys published in 2015–2017 brought the total to near 28,500.9 How-
ever, data published in 2018 brought that number to almost 29,500,10 with a relatively wide margin
of error, and arguably as high as 39,000.11 This is the highest global estimate since the bears were
protected by international treaty in 1973.12 While potential measurement error, lack of recent sur-
veys, conflicting methodologies, and unpublished data mean it can only be said that the global
population has likely been stable since 2005 (but may have increased slightly to moderately), it is
far from the precipitous decline polar bear experts expected given summer sea ice levels as low as
they have been in recent years.13
      Between 2007 and 2015, summer sea ice on average dropped about 38% from 1979 levels,
an abrupt decline to within measurement error of the reduced coverage expected to occur by
mid-century (Figure 1).14 Christine Hunter and colleagues15 proclaimed in 2007 that such reduced
summer sea ice by 2050, if present for eight out of ten years (or 4 out of 5 years), would generate
a massive drop in polar bear numbers: ten vulnerable subpopulations out of 19 would be extir-
pated, leaving fewer than 10,000 animals worldwide (a 67% decline). Even though summer sea
ice from 2016–2019 has continued this pattern, recent research shows such a decline in polar bear
abundance has not occurred. This indicates summer sea ice levels are not as critical to polar bear

                      Predicted sea ice levels at:

                           2020
                           2030                                   As at September 2012
                           2050

                          Figure 1: Predicted sea ice changes versus observations.
      Sea ice predictions, based on 2004 data,438 were used in 2007 to predict a 67% decline in global polar
     bear numbers. The brown line indicates the approximate situation at 10 September 2012, an example of
                                    sea ice extent experienced since 2007.439

                                                       1
survival as USGS biologists assumed.16
      Despite marked declines in summer sea ice, Chukchi Sea polar bears continue to thrive, and
reports from a survey of Wrangel Island bears in the fall of 2019 showed bears were abundant,
healthy and reproducing well, as bears in the US portion were in 2016.17 Similarly, according to Jon
Aars, a senior Norwegian biologist, polar bears in the Svalbard area show no impact of the particu-
larly low sea ice years of 2016–2018, and 2019 has proven no different.18

2.     Conservation status
The International Union for the Conservation of Nature (IUCN), in their 2015 Red List assessment,
again listed the polar bear as ‘vulnerable’ to extinction, just as it did in 2006.19 Similarly, in 2016,
the US Fish and Wildlife Service upheld its 2008 conclusion that polar bears were ‘threatened’ with
extinction under the US Endangered Species Act (ESA).20 In both of these instances, polar bear
conservation status is based on computer-modelled future declines predicted to exceed standard
threshold levels (i.e. a population decline of 30% or more expected within three generations), not
observed declines.
      Polar bears currently have a relatively large population size, and their historical range has
not diminished due to habitat loss since 1979. If assessed on current observations, the polar bear
would qualify for a status of ‘least concern’ in the IUCN Red List in 2015 (as they would have done
in 2006) and the ESA would not have included polar bears on its list of threatened and endangered
species in 2008.21 Thus, concerns about the conservation status of polar bears are all about ‘the
potential response of the global population of polar bears to projected sea ice declines’22, not their
current population size.
      The polar bear was the first species assessed by the IUCN and the ESA to use predicted popu-
lation declines based on climate models, although all other species (with only a few recent excep-
tions) are assessed based on population declines already observed. As a consequence, the public
and the media often logically assume that polar bear numbers must be currently declining because
they have been listed as ‘threatened’ or ‘vulnerable’: this would be true for all other species listed by
the IUCN or the ESA, with only a few exceptions. This confusion is understandable because it ap-
pears contradictory. But the peculiar way in which polar bear conservation status has been defined
by these organizations means it is entirely correct to state that polar bears are currently thriving,
and to insist that such a statement is not at odds with a conservation status based on possible fu-
ture declines in population size.
      In contrast to the IUCN and the ESA, in 2018 the Committee on the Status of Endangered Wild-
life in Canada (COSEWIC) decided to continue to list the polar bear as a species of ‘special concern’,
as it has done since 1991, rather than upgrade the status to ‘threatened.’23 Since roughly two thirds
of the world’s thriving polar bear population lives in Canada, the recent COSEWIC decision (full re-
port published June 2019) means that most of the species is still managed with an overall attitude
of cautious optimism. This is a refreshing spark of rationality in the world of polar bear conserva-
tion assessment.

3.     Population size
Global
Despite the fact that one of the primary objectives of the PBSG, when appointed in 1973, was to
generate a global population estimate24, this portion of their mandate has proven particularly dif-
ficult to attain. Despite more than 50 years of dedicated research, several subpopulations have
never been comprehensively surveyed for population abundance (East Greenland, the Canadian
portion of the Arctic Basin, Laptev Sea) and several others have had only one survey conducted
over that time period (Chukchi Sea, Kara Sea, the eastern portion of the Barents Sea, Viscount Mel-

                                                2
ville, Lancaster Sound, M’Clintock Channel, and Norwegian Bay).
In 1993, the PBSG estimated polar bear abundance as about 21,470–28,370 (rounded to
22,000–27,000 in 1997). This number was ‘adjusted’ to 21,000–25,000 in 2001 and ‘further simpli-
fied’ to 20,000–25,000 in 2005; the apparent decline since 1993 comes from the fact that some
estimates used prior to 2001 were deemed to be not scientific enough and were dropped from the
totals.25 In contrast, in 2005 the US Geological Survey put the global population of polar bears at
24,500, a mid-point estimate used to support the US Fish and Wildlife Service Endangered Species
Act listing in 2008.26
In 2014, the PBSG mid-point estimate was listed as ‘approximately 25,000’ (no range given),
which was still the figure listed on their website at 15 January 2020.27 This is rather odd, since the
2015 IUCN Red List assessment, written by PBSG members,28 used a mid-point estimate of 26,000
(but not 26,500, the true mid-point of the stated 22,000–31,000 range, apparently due to potential
estimate errors). In September 2019 a new status assessment was added to the PBSG website as
a downloadable document (along with a new status table) and that document gives the 22,000–
31,000 global estimate. However, the PBSG webpage that discusses ‘global polar bear population
estimates’ still has the very much out-of-date information provided in 2014: readers would not find
the updated material unless they clicked the link to the polar bear status tables.29
That said, additional survey results published since the 2015 Red List assessment was pre-
pared brought the mid-point total at 2015 to near 28,500, with a similar wide margin of error (see
Section 4 for more detail). However, in 2018, new estimates for Southern Hudson Bay and the
Chukchi Sea, based on surveys completed in 2016, added about 1,000 to that total. Moreover, sur-
veys of the Gulf of Boothia, Viscount Melville, M’Clintock Channel, the Southern Beaufort and Davis
Strait were completed by 2019 and although the results have not yet been published, their up-
dated counts would likely put that global mid-point estimate above 30,000. While there is a wide
margin of error attached to the most recent mid-point estimate of 29,500, this is a far cry from the
7,493 (6,660–8,325) bears we were assured would be all that would remain30 given the sea ice lev-
els that have prevailed since 2007.31 It has been argued that a plausible and scientifically defensible
‘best-guess’ estimate at 2018, extrapolated from ‘known’ to ‘unknowns’ subpopulations within sea
ice ecoregions (see next section), would be about 39,000 (range 26,000–58,000), although a more
pessimistic best-guess based on a greater variety of ecosystem traits (including prey diversity and
sea ice cover) came out much lower, at 23,315 (range 15,972–31,212).32
Subpopulations by ecoregion
In 2007, the US Geological Survey defined four Arctic sea-ice ‘ecoregions’ as part of their current
and future assessments of polar bear population size and health (Figure 2).
• The ‘Seasonal’ ecoregion represents all the subpopulation regions where sea ice melts
completely during the summer, stranding polar bears onshore.
• The ‘Divergent’ ecoregion includes all subpopulation regions where sea ice recedes from
the coast into the Arctic Basin during the summer, leaving bears the option of staying
onshore or remaining with the sea ice.
• The ‘Convergent’ ecoregion is the subpopulation regions where ice formed elsewhere
drifts towards shore all year long.
• The ‘Archipelago’ ecoregion represents subpopulations in the Canadian Arctic archipel-
ago.
The ecoregion concept now appears to have been accepted as a useful assessment methodolo-
gy.33 However, it is important to note that the inclusion of the Southern Beaufort (SB) in the ‘Diver-
gent’ ecoregion is potentially misleading. Thick sea ice conditions occur in the SB every ten years
or so and persist for 2–3 years. They have a severe impact on polar bear health and survival, and
thus population size. The most devastating and well-documented thick spring ice events occurred
in 1974–1976 and 2004–2006,34 with evidence of perhaps less severe events in the early 1960s,
3KS
LV BS
AB
CS EG
Con
NW
NB NW KB
SB
VM LS BB
GB MC
FB DS
WH SH
AB Arctic Basin FB Foxe Basin MC M'Clintock Channel
Seasonal
BB Baffin Bay GB Gulf of Boothia NB Northern Beaufort
BS Barents Sea KB Kane Basin NW Norwegian Bay Archipelago
CS Chukchi Sea KS Kara Sea SB Southern Beaufort Convergent
DS Davis Strait LV Laptev Sea SH Southern Hudson Bay
Divergent
EG East Greenland LS Lancaster Sound VM Viscount Melville
WH Western Hudson Bay
Figure 2: The four Arctic sea ice ecoregions.
The Arctic Basin (AB) is not considered to be a sea ice ecoregion. The Convergent region ‘NWCon’ (also known
as ‘Queen Elizabeth – Convergent’) is not a recognized polar bear subpopulation.
mid-1980s, early 1990s, and the mid-2010s.35 This makes the SB region almost unique, although
something similar happens on a less regular basis off Greenland and in Hudson Bay due to thick ice
and/or changes in snow depth over ice.36 SB might therefore be better thought of as an ecoregion
of its own.
It should also be noted that Canadian polar bear authorities (i.e. COSEWIC) have recently
changed the boundary between the Southern and Northern Beaufort regions. This is meant to
make management easier, but if the changes are adopted by the PBSG (and proceedings from
their 2016 meeting indicated this has been only provisionally done),37 accurately tracking long-
term changes in population size and the effects of thick spring ice events could become extremely
difficult. It has been proposed (and accepted by COSEWIC) to resolve this by taking about 20% of
bear numbers (at 2006) away from SB and adding them to the NB subpopulation.38
4Baffin Bay – Seasonal
A comprehensive survey of Baffin Bay (BB) polar bears undertaken in 1993–199739 generated an
estimate of 2,074±226. The government report for the latest survey, completed in 2013, confirmed
what local Inuit and some biologists had been saying for years: contrary to the assertions of PBSG
scientists that bear numbers have been affected by over-hunting, the subpopulation has not de-
clined since 1997.40 BB bear abundance in 2013 was found to be ‘considerably larger’ than the pre-
vious estimate, but the authors assert that differences in sampling design preclude direct compar-
ison between the two. Still, the polar bear subpopulation estimate at 2013 for BB was 2,826±767
(95% CI = 2,059–3,593), a 36% increase over 1997 (2,074; 95% CI = 1,553–2,595). While all other
metrics of life history and habitat were subject to statistical significance testing,41 the abundance
estimate was not, because of the claimed methodological issues (a position refuted by Mitchell
Taylor, the author of the 1997 report).42 In 2019, the PBSG considered the BB trend ‘data deficient’
despite the recent survey, but aboriginal traditional knowledge assessed the population in 2018
as ‘stable’.43
Davis Strait – Seasonal
The Davis Strait (DS) subpopulation include those bears that visit Newfoundland and southern
Labrador in the spring. The first population count was completed in the late 1970s, and generated
a figure of 726 bears. That figure has been subject to repeated post-hoc adjustments. The first was
upwards, to 900.44 That estimate was then subjectively increased by the PBSG to 1,400 bears and
then, at the turn of the millennium, to 1,650 (without additional field surveys) to account for certain
biases and assumptions in the original estimate as well as more sightings of bears and an increase
in their harp seal prey.45 A comprehensive survey completed in 2007 generated a new estimate of
2,158 (range 1,833–2,542), a substantial increase over the previous estimates.46
The density of Davis Strait bears in 2007 (5.1 bears/1,000 km2) was found to be higher than
other seasonal sea-ice subpopulations, such as Hudson Bay. Karyn Rode and colleagues recorded
a slight decline in body condition of DS polar bears between 1977 and 2010, but there was no in-
dication this had affected survival or reproduction.47 By 2012, the harp seal population had grown
even further,48 providing the potential for a further increase in polar bear numbers; this is probably
reflected in the 2018 Environment Canada status assessment as ‘likely increasing’.49 As a conse-
quence, it is highly likely that the actual population size at 2018 (eleven years after the last survey)
is well above 2,500. However, the results of recent surveys of both polar bears and harp seals have
yet to be made public50 and the PBSG in 2019 listed DS bears as ‘likely stable’ rather than increas-
ing.51
Foxe Basin – Seasonal
The first survey of Foxe Basin (FB), conducted in 1994, generated an estimate of 2,197 bears (1,677–
2,717), but in 2004 this was adjusted by the PBSG to 2,300 bears (1,780–2,820).52 An aerial survey in
2009–2010 – the first aerial surveys performed in Canada after mark-recapture studies were effec-
tively banned by the Nunavut government – generated an estimate of around 2,580 bears.53 While
the two methods (aerial survey and mark-recapture) are not directly comparable, the population
was considered ‘stable’ by Environment Canada in 2014, as well as by the PBSG in 2014 and 2019,
while traditional knowledge considered numbers to be increasing.54
Western Hudson Bay – Seasonal
The first comprehensive survey of Western Hudson Bay (WH) for the period 1978–1992 generated
a population estimate of 1,000±51, which was adjusted by the PBSG in 1993 to 1,200 to account
for areas not surveyed.55 Regehr and colleagues estimated the abundance in 2004 as 935 (range
794–1,076), a statistically significant decline of 22% from the 1987 count of bears in the same core
area of 1,194 (range 1,020–1,368).56 This result was used as persuasive evidence that polar bears
should be listed as ‘vulnerable’ and ‘threatened’ (by the IUCN Red List in 2006, and the US Fish and
Wildlife Service in 2008, respectively). A mark-recapture study in 2011, again of the core region
5only because this was assumed to include all WH bears, generated an estimate of 806 (653–984).
This looked like a further decline, but the same year an aerial survey that encompassed the entire
subpopulation area generated an estimate of 1,030 (range 754–1,406). This was the figure used by
the PBSG in 2016 and 2017, when they concluded that this subpopulation was ‘stable.’57
Another aerial survey in 2016 generated an estimate of 842 (range 562–1,121).58 However, be-
cause the 2011 and 2016 WH aerial surveys used rather different methods and covered different
portions of the region, the authors of the 2016 report emphasized that only two estimates can be
reliably compared: for 2011, the partial estimate of 949 (range 618–1280) and for 2016, the esti-
mate of 842 (range 562–1121). This decline between the 2011 and 2016 partial estimates of 11%
was not statistically significant.59 Therefore, it is not scientifically supportable to suggest that the
estimate for 2016 of 842 bears represents an 18% decline from the 2011 estimate of 1,030 bears.
Moreover, neither of these estimates is statistically different from the estimate of 935 calculated
in 2004, which means there is no scientific justification for suggesting the WH population has de-
clined since 2004. Although it continues to be done, it is similarly unsupportable to suggest there
has been a 30% decline from the 1987 estimate: the differences in method between the 2016 aerial
survey and the 1987 mark-recapture study are simply too great to allow valid comparison.60
Claims by polar bear specialists that the body mass of females, survival rates of cubs, and the
frequency of triplet litters in fall have all declined since 2004 due to sea ice changes have not been
substantiated because no data of this nature have been published.61 In a late-2018 interview with
UK journalist David Rose, WH polar bear researcher Andrew Derocher would only concede that
there has been ‘a recent period of stability’.62 But WH polar bears may be doing even better than
just holding their own: the Nunavut Government insisted in late 2018 that several indicators point
to the conclusion that the WH population has increased in size.63 However, in 2019 the PBSG listed
the WH subpopulation as ‘likely decreased’.64
Southern Hudson Bay – Seasonal
The first population size assessment for Southern Hudson Bay (SH) was made during 1984–1986,
and generated an estimate of 763±323 bears.65 Some adjustments, re-analyses and new surveys
indicated that by 2005 the subpopulation had been stable since the mid-1980s at about 1,000
animals.66 A subsequent aerial survey in 2011–2012 generated an estimate of 943 bears (range
658–1350), a non-significant change from 2005. It also indicated that the body condition of SH
bears had changed very little since the 1980s.67 The small decline in body condition index found
by SH researchers (no raw data provided) correlated only with very late freeze-up dates. Results
of a more recent aerial survey, completed in 2016, showed a 17% decline in population size, from
943 to 780 (range 590–1,029), which was not statistically significant.68 However, something called a
‘Monte Carlo simulation’ (a technique never used before in polar bear population size estimates, as
far as can be determined) was applied ‘to better inform managers about the status of the subpopula-
tion’ and since this test determined that the decline could be real, the authors reported an actual
drop in abundance for the first time in SH. However, Martyn Obbard and colleagues also conceded
that the decline in the percentage of yearling cubs they documented (from 12% in 2011 to 5% in
2016), which indicated low survival of cubs born in 2015, did not correlate with adverse fall or sum-
mer sea ice conditions because freeze-up was relatively early in 2015 and breakup was relatively
late. They offered no alternative explanation for the poor survival of yearlings, which they noted
was similar to that seen for Western Hudson Bay bears the same year. Furthermore, in contrast to
their 2011/2012 survey, as of 31 December 2019 they have released no additional information on
the body condition of bears they documented in 2016, nor have they reported sea ice conditions
up to 2016.69 Traditional knowledge indicates an increase in SH bear numbers, while the PBSG in
2019 considered it ‘likely decreased’.70
Barents Sea – Divergent
The first count of Barents Sea (BS) polar bears was undertaken in August 2004, using a combination
6of mark-recapture and aerial survey over both Norwegian and Russian territories. This survey gen-
erated an initial estimate of 2,997, which was later amended to 2,650 (range 1,900–3,600) for the
entire region.71 Researchers found 2.87 times as many bears in the Russian sector of the Barents Sea
as in the Norwegian sector in 2004.72 In August 2015, a planned recount of the entire subpopula-
tion had to be restricted to the Norwegian sector because Russian authorities refused to issue the
necessary permits. However, while the published paper that reported the results of the Svalbard
survey confirmed that a 42% increase in abundance had occurred (from 685 bears in 2004 to 973
bears in 2015), due to the large uncertainty (broad error ranges) in the estimates involved, that 42%
increase was not statistically significant.73 Authors Jon Aars and colleagues had this to say about
the Svalbard survey:
There is no evidence that the fast reduction of sea-ice habitat in the area has yet led to a reduction
in population size. The carrying capacity is likely reduced significantly, but recovery from earlier
depletion up to 1973 may still be ongoing.74
The same authors also concluded that only a few hundred bears now use Svalbard routinely as a
denning area or summer refuge, and that most individuals seen around the area live in the pack ice
offshore. This confirmed their previous finding that most Barents Sea polar bears live in the Russian
sector of the region, around the archipelago of Franz Josef Land.*
Zoologist Susan Crockford pointed out in 201775 that if the results of the 2015 survey were
extrapolated to the entire region using the ratio for the Russian and Norwegian sectors taken from
the 2004 survey, the 2015 population size for the Barents Sea would be about 3,749 (an increase
of about 1,109 bears). This extrapolated size increase might not be statistically significant but it
accounts for the high probability that the polar bear population in the Russian sector increased
between 2004 and 2015 by at least as much as the Norwegian sector (and perhaps by even more,
because sea-ice conditions there have been less seasonally volatile).76 However, the researchers
who undertook the 2015 Svalbard survey did not extrapolate their estimate to the entire region,
in contrast to Chukchi Sea researchers, who based their estimate on a survey of only two portions
of the entire region.77 The proceedings document from the 2016 PBSG meeting published in July
2019 also did not extrapolate the Svalbard result and argued that because there was no statisti-
cally significant increase between 2004 and 2015, it could not conclude that the population had
grown.78 As a consequence, the official BS population size remains at 2,650 (range 1900–3600); in
2019 the PBSG considered it ‘likely stable’.79
Kara Sea – Divergent
A first-ever Kara Sea (KS) population estimate, completed in late 2014, potentially added another
3,200 or so bears to the global total.80 This estimate (range 2,700–3,500), derived by Russian biolo-
gists from ship counts, was included in the official global count published in 2015 by the IUCN Red
List.81 An earlier estimate, of about 2,000 bears at 2005, was used by American biologists to sup-
port the 2008 ESA status assessment, but this was an unofficial figure and does not appear in any
document.82 However, if it was accurate at the time, it may indicate a population increase has taken
place. Despite this, the PBSG in 2016 and 2019 still listed the Kara Sea status as ‘unknown’ and did
not mention the 2014 Russian estimate.83
Laptev Sea – Divergent
The Laptev Sea (LS) was given a population size of about 1,000 (range 800–1,200) based on den
counts between the 1960s and 1980s.84 The PBSG included this estimate in its 2005 assessment,85
but the LS status was changed to ‘data deficient’ in 2013 and ‘unknown’ in 2014 due to the esti-
mate being out of date.86 ‘Unknown’ was also the LS status issued by the PBSG in 2016 and 2019.87
* Note that a frequent claim made by the media, that ‘polar bears outnumber people in Svalbard’, is
quite wrong. It seems to have originated from a statement on the website of the Svalbard Tourism Board
(‘Visit Svalbard’), and resulted from a mistaken equating of the Barents Sea subpopulation region with the
Svalbard study area.
8In contrast, the 2015 IUCN Red List assessment required population size numbers for its models
projecting future status and used the out-of-date estimate of 1,000 for LS.88 However, there has not
been legal hunting in the region since 1957, and sea ice declines in all seasons have been less than
in the neighbouring Kara and Barents Seas,89 which suggests the population size for LS is almost
certainly three or more times as large as the estimate used for the latest Red List assessment.90
Despite this, the PBSG in 2019 listed this subpopulation as ‘data deficient’ and the population size
as ‘unknown’.91
Chukchi Sea – Divergent
An existing Russian estimate of 3,000–5,000 bears for the Chukchi Sea (CS) subpopulation, based
on den counts and estimated numbers of females in the population, became 2,000–5,000 in the
1993 PBSG report and 2,000 in the 2005 report.92 Considered ‘declining’ by the PBSG in 2009, based
on existing and projected sea ice losses,93 that changed to ‘data deficient’ in 2013 and ‘unknown’ in
2014–17.94 However, because a number was required for predictive models, the long out-of-date
estimate of 2,000 was used for the 2015 Red List assessment.95
However, a capture-recapture survey was conducted by US researchers over a small portion of
the sea ice west of Alaska from 2008–2016 (during mid-March to early May). The numbers of bears
captured –166 males and 135 females – were then extrapolated to provide a population estimate
for the whole.96 Even though the critical Wrangel Island denning region was not surveyed for the
study, litter sizes of family groups on the sea ice off Alaska in spring were found to be much higher
than average for both cubs of the year (2.18) and yearling cubs (1.61). These large litter sizes were
seemingly driven by an incidence of triplet litters (3/39 of yearling litters or 7.7%)97 formerly seen
only in Western and Southern Hudson Bay in the 1970s and 1980s.98 This 2016 estimate supports
evidence reported up to 2016 that suggested CS bears were in good condition and reproducing
well.99 For example, research conducted from 2008–2013 showed that CS polar bears were doing
better than they were in the 1980s, and body condition was better than any other subpopulation
except the bears of Foxe Basin (who were doing exceptionally well).
It was also reported that bears spending the summer on Wrangel Island, the region’s main
terrestrial denning area, had increased dramatically, from about 200–300 individuals in 2012 and
2013 to 589 in the fall of 2017,100 although about 550–600 were counted in 2007.101 Preliminary
reports from a 2019 fall survey of the northern part of the island counted 367 bears, and while it
is unknown how many were counted in the south, the bears seen in the north were reported to
be in good condition, with at least one litter of four cubs photographed.102 All indicators suggest
this subpopulation is productive and healthy despite recent changes in summer sea ice that led to
bears coming ashore for the summer about 20 days earlier than they did in the 1980s.103 Poaching
is no longer considered an issue, and in 2019 the PBSG listed the subpopulation as ‘likely stable’.104
Even though the Bering Sea is considered part of the range for CS bears, few individuals ven-
ture further south than St Lawrence Island while hunting for seals in winter and early spring, which
means that year-to-year variations in Bering Sea ice cover in winter and spring has little impact on
Chukchi Sea bears.105
Southern Beaufort Sea – Divergent
As noted above, although officially categorised as a subpopulation in the Divergent ecoregion,
there are good reasons to believe that the sea ice conditions in the Southern Beaufort Sea (SB) are
unique. The first survey of the region took place in 1986, and generated an estimate of about 1,800
individuals. The survey attempted to take into account known movements of bears to and from
the Chukchi Sea to the west and the Northern Beaufort Sea to the east.106 Such movements were
what prompted a change in the SB/NB boundary in 2014 by Canadian wildlife managers; a similar
change in the western boundary (near Barrow, Alaska) has been discussed but not implemented.107
Mark-recapture studies in 2001–2006 generated a statistically insignificant decline, to about 1,526
bears (range 1,211–1,841), which was subsequently blamed on reduced summer ice.108 However,
9it was clear from other studies that a series of thick spring sea ice episodes from 2004–2006, as se-
vere as had occurred in 1974–1976, was ultimately responsible for the poor survival of cubs, poorer
body condition of adults and subadults, increased spring fasting, reduced abundance of ringed
seals, and movement of bears into NB.109
Additional mark-recapture survey data from 2007–2010 were added to previously collected
data from 2001–2006 and analysed using a new statistical method. This showed that survival
picked up in 2007 (just as overall summer sea ice hit a record low) and increased through 2009,
resulting in a revised estimate of 907 (range 548–1,270) at 2010, a statistically significant decline
of roughly 25–50% (often wrongly cited as ‘40%’) over the 1980s count.110 The PBSG pointed out
in 2016 that the latest survey may not have sampled the entire geographic range adequately, and
that this may have negatively skewed the 2010 population estimate; they did not, however, make
an adjustment to the population estimate as they had previously done for other subpopulations
when such problems with estimates later became evident (e.g. Davis Strait).111
The COSEWIC report on polar bears published in June 2019 acknowledges concerns that the
2010 estimate was lower due to ‘annual variability in ice conditions’ (see Section 5) resulting in
bears shifting to the NB.112 It therefore proposed an ‘equally valid’ estimate for SB of 1,215 bears at
2006 (arrived at by taking 311 bears away from the 2006 SB estimate of 1,526 and adding it to NB
subpopulation estimate).113 This figure is currently the one used by the joint Inuvialuit/government
body charged with managing SB and NB subpopulations in Canada.114 For management purposes
in Canada, the SB subpopulation is considered ‘likely decline’ and the PBSG considers it to be ‘likely
decreased’.115 However, many Inuit in the Canadian portion of the region feel that polar bear num-
bers have been stable or increased within living memory.116
Northern Beaufort Sea – Convergent
The last population count for the Northern Beaufort Sea (NB) was made in 2006, so is now more
than ten years out of date. It generated an estimate of 980 (range 825–1,135), although the lead
author of the study suggested a more accurate estimate would be 1,200–1,300 due to non-sam-
pling of northern areas.117 At that time, the population appeared to have been relatively stable over
the previous three decades. The boundary with SB has been moved east, to near Tuktoyaktuk, for
Canadian management purposes, a change provisionally accepted by the IUCN PBSG in 2017.118
Updated maps from Environment Canada now incorporate this boundary change.119 The current
population estimate suggested to account for the boundary change with SB is 1,291 (980 plus
311, see discussion in SB above), but the estimate used for management purposes is 1,710 (an ad-
justment for unsampled areas of the region during the 2006 count); the population is considered
stable or ‘likely stable’ by Inuit and Canadian government authorities; it is listed as ‘likely decreased’
by the PBSG.120
East Greenland – Convergent
Although there has been no comprehensive survey of the East Greenland (EG) subpopulation, in
2001 the PBSG gave it an estimate of 2,000 bears (in part based on harvest records that indicated
a fairly substantial population must exist).121 However, in 2013 the group credited the region with
only about 650 bears, with no reason given for the change in opinion,122 and by 2014 EG numbers
were simply said to be ‘very low.’ It is simply not true that the PBSG has never provided an estimate
for EG, as they now claim on their website.123 In fact, the 2001 estimate of 2,000 bears was con-
sidered adequate for the 2015 IUCN Red List assessment.124 The first comprehensive population
survey should be completed by 2022.125 Traditional ecological knowledge gathered from hunters
in northeast Greenland in 2014 and 2015 suggested an increase in numbers of bears coming into
communities compared to the 1990s,126 and in southeastern Greenland, one representative of the
local hunters’ association said that there are more healthy bears causing trouble in the area be-
cause abundant seals have meant abundant bears.127 In 2019, the PBSG listed EG as ‘data deficient’
with an ‘unknown’ population size.128
10Arctic Basin – a designated subpopulation but not an ecoregion
In the original classification of the sea-ice ecoregions, a narrow portion of the Arctic Basin (AB)
north of Greenland and Ellesmere Island was at first called ‘Queen Elizabeth – Convergent’ and
later ‘Northwest – Convergent’ (NWCon; Figure 2), but that nomenclature now seems to have been
abandoned, probably because it is not a distinct subpopulation region for polar bears.129 The PBSG
treats AB as a ‘catch-all’ region because it contains bears moving between regions and those from
peripheral seas (such as the Southern Beaufort and Barents Sea) who use it as a summer refuge
during the ice-free season. Both single bears and family groups have been seen feeding on ringed
seals during the summer, and both ringed seals and their fish prey have been documented as be-
ing present.130 AB is given a population size estimate of zero, but there is some evidence that the
productivity in some areas of this region is higher than previously assumed and it is thus possible
that a small number of polar bears may live there year-round.131
Kane Basin – Archipelago
A 2013 survey of Kane Basin (KB) polar bears confirmed what local Inuit and some biologists have
been saying for years: that contrary to the assertions of PBSG scientists, KB polar bear numbers
have not been declining.132 Until recently, the KB polar bear subpopulation, located between north-
west Greenland and Ellesmere Island, was assessed with confidence by the PBSG to be declining
due to suspected over-hunting. In 2014, Environment Canada’s assessments were ‘data deficient’
for the area. But the 2013 survey generated an estimate of 357 (range 221–493), a 118% increase
over the 1997 estimate of 164 (range 94–234) and a 59% increase over the estimate recalculated in
2016 as 224 (range 145–303), indicating a ‘stable to increasing’ population.133 However, the survey
authors expressed concerns with sampling methodology and differences in the areas surveyed,
and suggested ‘some caution in interpretation of population growth’ was necessary.134 While all
other metrics of life history and habitat were subject to statistical significance testing, the authors
did not state conclusively whether the 59% increase was statistically significant or not. However,
traditional knowledge says numbers have increased, and the PBSG assessment for 2019 concluded
that the population had ‘likely increased’.135
M’Clintock Channel – Archipelago
The first population size estimate generated for M’Clintock Channel (MC) was about 900 bears
in the mid-1970s. A mark-recapture study in 2000 generated an estimate of 284±59 bears, a sig-
nificant decline, which was blamed on over-hunting.136 Hunting was subsequently halted but later
resumed at a much-reduced level, after which the population was presumed to be increasing. Re-
sults of a three-year genetic mark-recapture study that began in 2014 were still not available at the
end of 2019, but traditional knowledge in 2018 considered this subpopulation had declined in re-
cent years, probably due to overhunting. Surprisingly, the PBSG assessed it as ‘very likely increased’
in 2019.137
Viscount Melville – Archipelago
The first survey to determine the population size of the Viscount Melville (VM) subpopulation was
completed in 1992 and generated an estimate of 161±40.138 This estimate is now over 25 years
old; while a new genetic mark-recapture survey was completed in 2014, the results had still not
been made public by the end of 2019; traditional knowledge indicates the population is stable or
increasing, while the PBSG in 2019 considered it ‘data deficient’.139
Gulf of Boothia – Archipelago
The Gulf of Boothia (GB) is in the middle of the Canadian Arctic. In terms of geographic area, it is
one of the smallest of all 19 subpopulations worldwide, covering an area of only 170,000 km2; only
the Norwegian Bay and Kane Basin regions are smaller, at 150,000 and 155,000 km2 respectively.140
The first population survey was done in 1986 and generated an estimate of about 900 bears. This
was updated in 2000 with an estimate of 1,592±361 bears, a significant increase.141 The new density
11was calculated as 18.3 bears per 1000 km2, well above the 5.1 bears per 1000 km2 found in Davis Strait, the 1.9 bears per 1000 km2 in M’Clintock Channel, and the 6.5 bears per 1000 km2 found in the Northern Beaufort Sea.142 A new estimate for the area has been completed based on genetic mark-recapture but, as of the end of 2019, the results have not been made public. However, the last preliminary report stated that ‘polar bears remain relatively abundant and in good condition’; the PBSG in 2019 list this subpopulation as ‘likely stable’, while traditional knowledge considers it to have increased.143 Lancaster Sound – Archipelago The Lancaster Sound (LS) subpopulation, in the middle of the Canadian Arctic archipelago, has one of the highest population counts of polar bears anywhere, although it is one of the smaller regions. The latest population surveys were conducted from 1995 to 1997, and in 1998 an estimate of 2,541±391 bears was generated, a significant increase over the previous estimate (from 1977) of 1,675 bears.144 The eastern portion of LS is generally clear of ice by late summer (hence the North- west Passage), but the western third of the region not only retains pack ice later in the season, but some multiyear ice remains throughout the year. The proximity of LS to Baffin Bay and the eastern Northwest Passage undoubtedly exposed polar bears there to hunting by European whal- ers during the 1800s and early 1900s,145 but the population appears to have recovered since then. Traditional knowledge says numbers in the region have increased while the Polar Bear Technical Committee assessed it as ‘likely stable’ in 2018.146 In 2017, the PBSG considered the population to be stable but changed this to ‘data deficient’ in 2019.147 Norwegian Bay – Archipelago The last population count for Norwegian Bay (NB) was done in 1993–1997 in conjunction with the Lancaster Sound survey, and is therefore well out of date.148 It generated a population estimate of 203±44.149 Several studies suggest this may be a genetically distinct subpopulation.150 Norwegian Bay is either part of, or adjacent to, what has been called the ‘Last Ice’: a refugium of sea ice over shallow continental shelf waters expected to remain even if summer sea ice drops to near-zero lev- els (
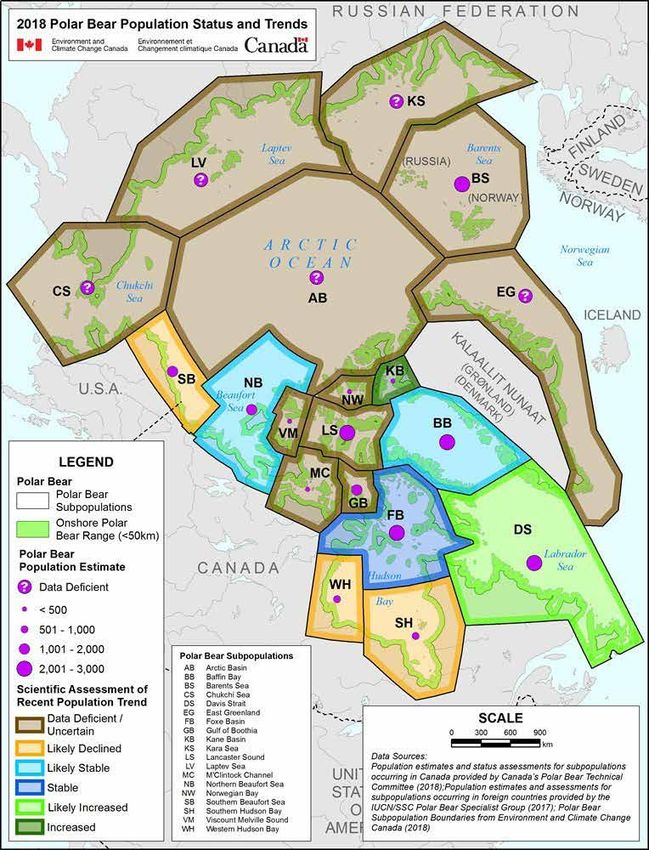
Figure 3: Trends in polar bear subpopulations at 2018, according to the Government of Canada.
The Canadian government considers the polar bear a species of ‘Special Concern.’ Note KB is ‘increased’ which is diffi-
cult to discern from ‘data deficient’ because of the color scheme chosen. The ‘likely declined’ status for WH and SH is
                            not supported by statistically significant population declines.

population count, but, as noted above, this region has special circumstances that make it an out-
lier: the proximate cause of the apparent decline was thick sea ice, which temporarily drove seals
and therefore bears out of the region.154 A more realistic assessment of the SB nine years after the
last population survey would therefore be ‘likely stable.’
      Although the PBSG listed population trends in their population status table in 2014 (when
they considered four populations to be declining), by early 2017 they no longer included these
                                                         13
hitherto important numbers. However, by mid-2019 they had added them back in.155 Nevertheless,
their 2019 assessments show the same pessimistic bias as found in their 2014 status tables and in
the Environment and Climate Change Canada status trend map.
Accordingly, Figure 4 shows a more realistic representation of current polar bear population
trends, which gives the following classification totals at 2018 (not changed in 2019): 156
• two ‘increased’ or ‘likely increased’ [KB, DS]
• three 'stable or likely stable' [WH, SH, AB]
• fourteen 'presumed stable or increasing' [EG, LS, AB, VM, NB, GB, MC, LS, BB, BS, KS, CS,
NB, FB]
Kara Sea
Laptev Sea
Barents
Sea
Norwegian Bay
Arctic Basin
Chukchi Sea
Kane Basin
S. N.
Beaufort Beaufort Lancaster Sound
Sea Sea
Baffin Bay
Viscount Melville Foxe Bay Davis
Strait
M'Clintock Channel
S.
Gulf of Boothia Hudson
Western Hudson Bay Bay
Subpopulation size
Unknown Population trendThe problem of statistical confidence
Virtually all recent population size estimates for polar bear subpopulations have such wide mar-
gins of error (statistical confidence intervals) that even quite large changes in size are unlikely to
be statistically significant. For example, in its most recent population count in 2015, the Svalbard
portion of the Barents Sea saw an increase of 42%, but this was not statistically significant.157 The
authors, Jon Aars and colleagues, could conclude only that recent large declines in sea ice habitat
in the Svalbard area had not yet led to a reduction in population size and that recovery from previ-
ous overhunting might still be ongoing.
In addition, differences in survey methodology have led to numbers that are not considered
comparable, so a trend cannot be established. Such problems have recently been claimed for the
2012–2013 estimate for Baffin Bay bears compared to one conducted in 1997, even though the
more recent estimate was 36% larger.158 Similarly, the most recent Western Hudson Bay surveys,
conducted in 2016, generated an estimate about 30% smaller than the one for 1987, but differenc-
es in methodology and areas surveyed mean the two figures cannot be used to derive a trend.159
Two estimates for WH, for 2004 and 2016, could be compared, and these suggested a statistically
insignificant decline of about 11%.
In short, changes in survey methods and/or mathematical formulae used to derive population
estimates over time have generally increased statistical confidence intervals to such an extent that
a decline or increase in abundance would likely need to be 50% or more to be considered real and
valid. This means that the ESA and Red List definitions of ‘threatened’ or ‘vulnerable’ to extinction
– based as they are on the likelihood of a population decline of 30% or more over the next three
generations160 – are using a mathematical threshold that is very likely statistically invalid for polar
bears.161 The IUCN Red List assessment for 2015 apparently dealt with this issue by concluding that
there was a reduced probability (only 70%) that a decline of 30% or more would occur by 2050,
which is a rarely discussed but significant caveat to their prediction.162
I have dealt with this issue in this report by replacing old subpopulation sizes with new ones
generated since the 2015 Red List assessment was published (for Barents Sea, Baffin Bay, Kane
Basin, Western Hudson Bay),163 but acknowledge that the margin of error remains large and note
the apparent increase in global population size is likely not statistically significant. The rationale for
this approach is to emphasize that the anticipated decline in global numbers since 2005 has not
taken place.
5. Habitat status
Global sea ice
Summer sea ice (at September) has declined markedly since 1979 but winter ice levels (at March)
have declined very little and have been essentially flat since 2004 (Figure 5).164 March extent in
2019, when atmospheric CO2 levels were about 411 parts per million (ppm), was tied with 2007,
when CO2 was about 387 ppm, as the seventh lowest extent since 1979.165 There has been no re-
search done on what effects, if any, the slight decline in winter ice extent has had on polar bears
overall, but a cursory examination suggests that since 1979 there has been enough sea ice in win-
ter to meet the needs of polar bears and their prey. In part, this is because most of the change in
winter ice extent has occurred in the Sea of Okhotsk and the Gulf of St. Lawrence (where polar
bears do not live) as well as in the southern Bering and southern Labrador Seas (where few polar
bears venture in winter and early spring).166 This was especially relevant in 2018 and 2019 for the
Bering Sea because of reports that the low extent of winter ice cover had broken historic records:167
Bering Sea ice has been extraordinarily variable since 1979, and in 2012 – the year the summer
extent hit its lowest level – reached by far the highest level since 1979 and broke the record at the
other end of the range.168
As far as is known, record low extents of sea ice in March 2015, 2017 and 2018,169 which were
1520
0
Anomaly (%)
-20
-40
1978 1986 1994 2002 2010 2018
September March
Figure 5: Sea ice extents, 1979–2019.
Anomalies against mean for 1981–2010. From NOAA’s Arctic Report Card 2019.440 A recent paper tracking sea
ice levels back to 1850 shows a similar pattern.441
so similar to 2006, had no impact on polar bear health or survival (Figure 6a), and ice cover at March
2019 was higher than all three of those years. For example, adult male bears captured around Sval-
bard, Norway in spring showed no statistically significant change in body condition from 2015
through 2019, compared to those captured since 1993; however, in 2019, the condition of males
was the best it had been since 1995 and average litter size (2.0) reached a level not seen since
1993.170
The most pessimistic predictions of March sea ice extent at the end of the 21st century is
about 12.0 mkm2, equal to the average extent of ice for May 2019 and May 2016 (Figure 6b). 171 Po-
lar bears and their prey could survive without a precipitous decline in population size if March sea
ice dropped this low, even before 2100, because there would be enough ice in all regions where
these animals reside to meet their minimum spring requirements.
Sea ice extent in June has declined, on average, from just over 12 mkm2 in the 1980s to just
over 11 mkm2 from 2004–2018.172 By late May to early June, there has therefore been lots of sea
ice throughout the Arctic to act as a feeding and mating platform for polar bears (Figure 6c): even
the 10.5 mkm2 available in June 2019 was ample habitat for late spring (Figure 6d).173 In part, this is
because the young seals that form the bulk of polar bear diets in spring take to the water to feed
and are no longer available on the ice, leaving only predator-savvy adults and subadults hauled
out as potential prey.174 This means few seals are actually caught and consumed by polar bears
after about mid-June in Seasonal and Divergent sea ice ecoregions, or by mid-July in Convergent
and Archipelago regions (see Section 6).
Sea ice thickness has declined in some regions of the Arctic, and this has been especially pro-
nounced in the Arctic Basin. In March 2019, it was reported that just 1.2% of the mobile pack ice
in this region was ‘old’, thick ice (> 4 years and 4–5 m thick), compared to 33% for the same month
in 1985.175 However, by and large, this has been a net benefit for polar bears and their prey, whose
preferred habitat is first-year ice less than 2 m thick, which was always the dominant ice type in the
Divergent and Seasonal ecoregions but is now increasingly common in the Archipelago and Con-
vergent regions as well.176 For example, during the 1980s, sea ice in Kane Basin, west of Northern
Greenland, was predominantly permanent, multi-year ice, even in summer, and this poor seal habi-
tat supported few polar bears. But now that the ice is mostly seasonal first-year ice, the population
16(a) March 2018 (b) May 2016
(c) June 2012 (d) June 2019
Figure 6: Average sea ice extents.
The brown lines indicate the median extent for 1981–2010. Courtesy US National Snow and Ice
Data Center.
of bears has grown remarkably.177
In contrast, a 2016 report of Southern Beaufort Sea bears having difficulty finding prey in
2014–2016178 indicated that the thick spring ice events that have temporarily impacted the region
every ten years or so since the 1960s – when multi-year ice compresses first year ice along the
shore until it becomes a mass so thick and buckled that it forces Arctic seal species to leave – have
continued despite reduced summer sea ice, although authors Anthony Pagano and colleagues did
not draw that conclusion.179 The scientific literature has many papers and reports that show what
past episodes of thick spring sea ice have done to polar bears, ringed seals, and bearded seals that
live in the Southern Beaufort Sea.180 The Pagano study is evidence that the phenomenon occurred
again in 2014–2016, right on schedule, ten years after the 2004–2006 episodes, although research-
ers and the media181 blamed the effects on reduced summer sea ice.182 Fortunately, as happened
following all previous episodes of thick spring ice, polar bear numbers and their physical condition
appear to have improved since 2016, something which was especially evident in 2019, when doz-
17You can also read