Stress drop-magnitude dependence of acoustic emissions during laboratory stick-slip - Refubium
←
→
Page content transcription
If your browser does not render page correctly, please read the page content below
Geophys. J. Int. (2021) 224, 1371–1380                                                                                           doi: 10.1093/gji/ggaa524
Advance Access publication 2020 November 05
GJI Seismology

Stress drop–magnitude dependence of acoustic emissions during
laboratory stick-slip

Aglaja Blanke ,1 Grzegorz Kwiatek,1,2 Thomas H. W. Goebel,3 Marco Bohnhoff1,2 and
Georg Dresen1,4

                                                                                                                                                            Downloaded from https://academic.oup.com/gji/article/224/2/1371/5956490 by Freie Universitaet Berlin user on 26 February 2021
1 GFZ German Research Centre for Geosciences, Geomechanics and Scientific Drilling, Telegrafenberg, D-14473 Potsdam, Germany. E-mail:

a blanke@gfz-potsdam.de
2 Department of Earth Sciences, Free University Berlin, Malteserstraße 74–100, D-12249 Berlin, Germany
3 Center for Earthquake Research and Information, University of Memphis, 3890 Central Avenue, Memphis, TN 38152, USA
4 Institute of Geosciences, University of Potsdam, Karl-Liebknecht-Str. 24–25, D-14476 Potsdam-Golm, Germany

Accepted 2020 November 2. Received 2020 October 27; in original form 2020 May 19

                                       SUMMARY
                                       Earthquake source parameters such as seismic stress drop and corner frequency are observed
                                       to vary widely, leading to persistent discussion on potential scaling of stress drop and event
                                       size. Physical mechanisms that govern stress drop variations are difficult to evaluate in nature
                                       and are more readily studied in controlled laboratory experiments. We perform two stick-slip
                                       experiments on fractured (rough) and cut (smooth) Westerly granite samples to explore fault
                                       roughness effects on acoustic emission (AE) source parameters. We separate large stick-slip
                                       events that generally saturate the seismic recording system from populations of smaller AE
                                       events which are sensitive to fault stresses prior to slip. AE event populations show many
                                       similarities to natural seismicity and may be interpreted as laboratory equivalent of natural
                                       microseismic events. We then compare the temporal evolution of mechanical data such as
                                       measured stress release during slip to temporal changes in stress drops derived from AEs
                                       using the spectral ratio technique. We report on two primary observations: (1) In contrast to
                                       most case studies for natural earthquakes, we observe a strong increase in seismic stress drop
                                       with AE size. (2) The scaling of stress drop with magnitude is governed by fault roughness,
                                       whereby the rough fault shows a more rapid increase of the stress drop–magnitude relation
                                       with progressing large stick-slip events than the smooth fault. The overall range of AE sizes
                                       on the rough surface is influenced by both the average grain size and the width of the fault
                                       core. The magnitudes of the smallest AE events on smooth faults may also be governed
                                       by grain size. However, AEs significantly grow beyond peak roughness and the width of
                                       the fault core. Our laboratory tests highlight that source parameters vary substantially in
                                       the presence of fault zone heterogeneity (i.e. roughness and narrow grain size distribution),
                                       which may affect seismic energy partitioning and static stress drops of small and large AE
                                       events.

                                       Key words: Acoustic properties; Body waves; Earthquake dynamics; Earthquake source
                                       observations; Dynamics and mechanics of faulting.

                                                                                Cocco et al. 2016). The static stress drop is the difference between
1 I N T RO D U C T I O N
                                                                                initial and final shear stress spatially averaged over the rupture sur-
Since the late 1960s, there is a debate on whether earthquake source            face (e.g. Aki 1967; Brune 1970; Candela et al. 2011; Cotton et al.
parameters, and thus rupture processes, are self-similar across mag-            2013). A constant stress drop indicates a self-similar source process
nitude scales or show a scale dependence. A plethora of stud-                   irrespective of the event magnitude.
ies exists that analysed stress drop across a range of earthquake                  The static stress drop is an important source parameter that
magnitudes (e.g. Aki 1967; Ide & Beroza 2001, Ide et al. 2003;                  relates to the energy budget of seismic events (e.g. Kanamori
Allmann & Shearer 2009; Baltay et al. 2011; Abercrombie 2013;                   & Rivera 2006) and also affects near-field ground motions (e.g.


C The Author(s) 2020. Published by Oxford University Press on behalf of The Royal Astronomical Society. This is an Open Access

article distributed under the terms of the Creative Commons Attribution License (http://creativecommons.org/licenses/by/4.0/), which
permits unrestricted reuse, distribution, and reproduction in any medium, provided the original work is properly cited.
                                                                                                                                                    1371
1372 A. Blanke et al.
Spottiswoode 1993). Hence, it is an important parameter in seismic source characteristics. In general, Westerly granite is chosen for lab-
hazard and risk assessment and it is commonly used to establish oratory experiments because it represents abundant crystalline rocks
ground motion prediction equations (e.g. Cotton et al. 2013; Huang of the continental upper crust. Its isotropic texture (e.g. Goebel et al.
et al. 2017, Baltay et al. 2019). 2012) facilitates the analysis of seismic AE data. The recorded AEs
It is difficult to estimate stress drop accurately from seismic cover a large moment magnitude range (−9 < MW < −5.6) com-
data mainly due to uncertainties in the assessment of corner fre- pared to previous AE studies mentioned above. Both seismic and
quency, model-dependence and error propagations. Many studies mechanical data were measured throughout the experiments. The
discuss potential stress drop dependence on seismic moment or mechanical data provide a direct estimate of the differential stress
rupture dimension (e.g. Aki 1967; Abercrombie 1995; Ide et al. released during stick-slip, that is, the mechanical stress drop (σ m )
2003, Kwiatek et al. 2011; Cocco et al. 2016). Indeed, stress drop (we distinguish mechanical (σ m ) and seismic (σ AE ) stress drop,
estimates averaged across the entire bandwidth of earthquake mag- based on how the measurement was made, that is, force cell for
Downloaded from https://academic.oup.com/gji/article/224/2/1371/5956490 by Freie Universitaet Berlin user on 26 February 2021
nitudes (−9 < M < 8) suggest a global average value of a few σ m vs AE sensors for σ AE . The seismic waveform recordings
MPa (e.g. Cocco et al. 2016). However, the individual data sets dis- were clipped during the large slip events, preventing detailed source
play varying average stress drops spanning over some decades (e.g. parameter studies of the associated largest AEs. However, unclipped
Kanamori & Brodsky 2004; Allmann & Shearer 2009; Kwiatek waveforms were recorded for smaller AE events during the interslip
et al. 2011; Cotton et al. 2013; Cocco et al. 2016; Huang et al. periods. These are thought to represent the analogue of earthquakes
2016). In some cases, observed deviations from constant stress during the interseismic period between two large tectonic earth-
drop may be related to non-physical factors including site-, path- quakes. We used these waveforms to determine corner frequencies
and/or sensor-related effects, limited recording bandwidth, insuffi- and seismic moments of AE populations prior to larger slip events
cient station coverage, inadequate sensor-rock coupling, incorrect within the rock specimen by applying the spectral ratio method (e.g.
or specific source model assumptions, and error propagation in Ide et al. 2003; Abercrombie & Rice 2005; Kwiatek et al. 2011; Har-
parameter estimates (e.g. Ide & Beroza 2001; Ide et al. 2003). rington et al. 2015). Changes in source characteristics of these AE
In general, stress drop estimates can be improved by using high- populations are thought to image changes in fault stress state as de-
quality seismic data recorded over a wide frequency band and tailed below. It should be noted that the seismic stress drop (σ AE )
appropriate waveform processing techniques (e.g. Shearer et al. estimates for AE events are not directly connected to mechanical
2019). However, studies clearly indicate a scatter of estimated stress stress drop σ m . Furthermore, σ AE is primarily a measure of the
drops ranging from 0.01 to 100 MPa, thus significantly exceeding proportion of high-frequency energy radiation for events of a given
internal uncertainties originating from non-physical factors. This magnitude that reflects stress release on the microscale using sev-
suggests stress drop varies possibly also due to different physical eral assumptions about rupture velocity and aspect ratio (e.g. Aki
processes in the earthquake source (e.g. Cocco et al. 2016). Fault 1967; Brune 1970).
properties (e.g. composition, roughness and geometry) and hetero-
geneous stress conditions may cause stress drops to vary (e.g. Sagy
et al. 2007; Candela et al. 2011; Cocco et al. 2016; Baltay et al.
2 E X P E R I M E N TA L S E T U P A N D D ATA
2019).
Current data quality of natural and induced seismic waveforms AE waveform data was recorded during laboratory triaxial stick-
likely limits the resolution of the derived physical parameters gov- slip experiments performed at room temperature on two cylindri-
erning source mechanics. Since the pioneering work of Brace & cal oven-dried Westerly granite samples (cf. Goebel et al. 2012;
Byerlee (1966), laboratory experiments are known to contribute to Kwiatek et al. 2014a). Westerly granite exhibits grain sizes be-
a better understanding of the physics of natural earthquakes (Beeler tween 0.05 and 2.2 mm with an average grain size of 0.75 mm (e.g.
2006). That is, because the boundary conditions in the laboratory Tullis & Yund 1977; Goebel et al. 2014a). The experiments were
can be controlled and experiments can be repeated. Recent studies, performed in a servo-controlled loading frame (MTS-815, Mate-
analysing source and statistical properties of natural and laboratory rial Testing Systems) equipped with a pressure vessel and samples
seismic activity (e.g. McGarr & Fletcher 2003; Thompson et al. were placed in a rubber jacket to prevent intrusion of hydraulic
2009; Goebel et al. 2013; Yoshimitsu et al. 2014), indicate sim- confining oil. To monitor AE activity, 16 piezoceramic transduc-
ilarity of physical earthquake processes across a broad range of ers with a resonance frequency of about 2 MHz were placed in
scales. Thus, seismic rupture processes down to the submillimetre brass casings, which were attached directly to the sample sur-
scale can be studied by analysing high-frequency acoustic emission face and in top and bottom pistons, respectively. Full waveform
events (AEs, e.g. Bohnhoff et al. 2009). data were recorded using a transient recording system (DAX-Box,
Only few laboratory studies exist that analyse stress drops of AEs Prökel, Germany) in triggered mode at a sampling frequency of
in detail (e.g. G31; McLaskey et al. 2014; Yoshimitsu et al. 2014). 10 MHz and an amplitude resolution of 16 bits. In addition, hori-
An exact sensor calibration to determine absolute event magnitudes zontal and vertical P-wave velocities were measured at regular 30
for AEs is complicated, because sensor response is affected by con- s intervals during the experiments, using active ultrasonic pulse
fining pressure, sensor coupling and orientation (e.g. Plenkers et al. transmissions. Time-dependent velocity measurements were used
2011). Consequently, a comparison of absolute AE stress drops in to locate AE events and assess the evolution of damage in the
the laboratory with stress drops of natural tectonic earthquakes can sample.
be difficult. Nevertheless, stress drop differences between exper- We report on two different experiments (cf. Fig. 1): (1) experiment
iments with similar sensors can be compared with much higher S12 was done on a saw-cut sample of 105 mm height and 50 mm
confidence. Such a comparison is the main focus of the present diameter, cut at 30◦ to the vertical axis across. The saw-cut surface
study. was roughened with a coarse silicon carbide powder (60 grit). Prior
We analysed AE events of two laboratory stick-slip experiments to loading, sample S12 was subjected to a constant confining pres-
on Westerly granite samples to resolve the impact of fault surface sure (Pc ) of 133 MPa and then loaded in axial compression (σ 1 )
roughness and fault core width (cf. Goebel et al. 2014b) on seismic using a strain rate of 3 × 10⁻⁴ mm s−1 .Laboratory AE stress drop-magnitude relation 1373
Downloaded from https://academic.oup.com/gji/article/224/2/1371/5956490 by Freie Universitaet Berlin user on 26 February 2021
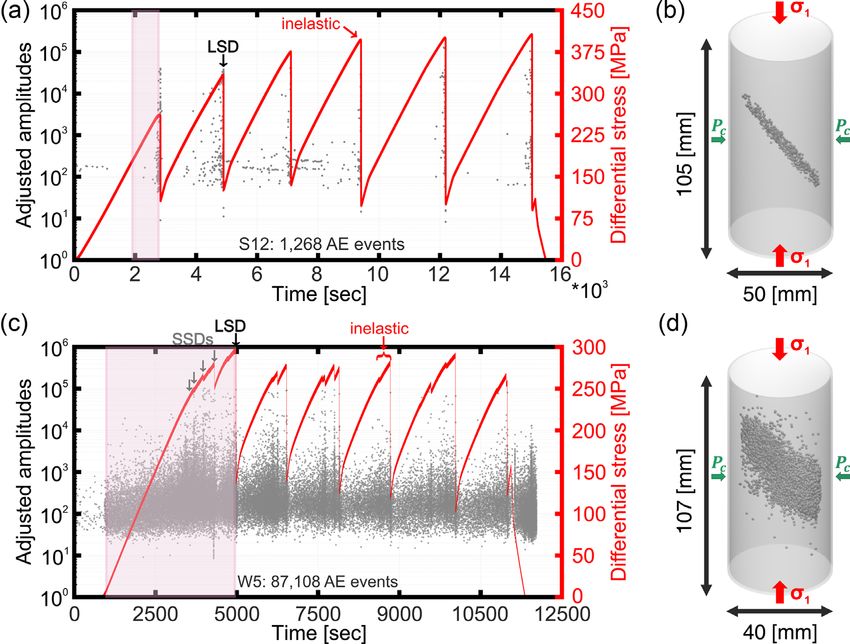
Figure 1. Differential stress (red curve) and AE amplitude (grey dots) as a function of time from start of experiments (a) S12 and (c) W5. Examples of inelastic
deformation phases are marked and labelled in red. Grey arrows indicate examples of SSDs (small mechanical stress drops) and black arrows indicate examples
of LSDs (large mechanical stress drops). Shaded rectangles exemplify event populations used for demonstrating the regression analysis in Figs 2(a) and (b).
(b) and (d) Spatial distribution of AEs (dots) within samples S12 and W5, respectively. Locations of AEs reflect a simple fault zone for S12 and a complex
fault zone for W5. Bold arrows indicate axial stress (σ 1 ) and confining pressure (Pc ).
(2) Experiment W5 was conducted on a cylinder (107 mm x 3.2 Data preparation
40 mm) with Teflon-filled saw-cut notches of 1.9 cm length at 30◦
We analysed AE waveform data from 10 laboratory stick-slip fail-
inclination to the vertical axis. Sample W5 was then fractured at
ures that occurred during testing of samples W5 and S12. To es-
75 MPa resulting in a complex rough fault. The fault was locked by
timate AE static stress drops (σ AE ), we applied a variant of the
increasing Pc to 150 MPa and subsequently activated in a series of
spectral ratio technique (e.g. Ide et al. 2003; Abercrombie & Rice
stick-slip events at an axial strain rate of 3 × 10⁻⁶ mm s−1 .
2005) developed and tested for different seismic data sets including
volcanic and induced seismicity (e.g. Kwiatek et al. 2011, 2014c,
2015; Harrington et al. 2015). The estimated corner frequencies (f0 )
3 METHOD and seismic moments (MW ) were used to calculate relative static
stress drops of AEs recorded in both experiments.
3.1 Data pre-processing We selected a window of 256 (25.6 μs) samples from the AE
P-wave onsets of AEs and first P-wave amplitudes were automat- waveforms starting shortly before the P-onset, removed the linear
ically picked using the Akaike information criterion (e.g. Stan- trend, and applied a two-sided von Hann’s taper. Signal and noise
chits et al. 2006). AE hypocentres were estimated using a hy- windows were transferred to the Fourier domain using the multitaper
brid grid search-simplex algorithm assuming a time-dependent method of Percival & Walden (1993). To meet the quality criteria,
anisotropic velocity model derived from ultrasonic transmission we selected spectra with a signal-to-noise ratio of at least 3 within a
data (G43). The estimated location accuracy of AE hypocentres is frequency band (fmin , fmax ), with a maximum range between f min ≈
about ± 2 mm (e.g. Stanchits et al. 2006; Goebel et al. 2014a,b). 7.8 × 10⁴ and f max ≈ 5.0 × 10⁶ Hz. For further analysis, we only
P-wave amplitudes were corrected for sensor coupling quality us- considered AE events with at least six available spectra that met the
ing ultrasonic transmission measurements (Kwiatek et al. 2014b). criteria given above.
Relative AE magnitudes were estimated as AE events with a sufficient number of spectra were further quality
constrained. First, we selected events with a maximum location ac-
1 n curacy residuum ≤ 0.2 (± 2 mm hypocentre location accuracy)
MAE = log10 (Ai Ri )2 , (1) and for which a seismic moment tensor solution was available
n i−1
(e.g. Kwiatek et al. 2014a). Considering the location uncertain-
where Ai and Ri are wave amplitude and source-to-receiver distance ties, we restricted the catalogue to AE events occurring inside of
to the sensor i, respectively (e.g. Zang et al. 1998). Following Dresen the sample to exclude mislocated events. For sample W5, we also
et al. (2020), we converted MAE into the seismic moment and from restricted AE locations close to the specimen main fault surface
that we calculated the moment magnitude MW . In the following, to better compare results with sample S12. Finally, we grouped
the P-wave amplitudes were used to derive full moment tensors of AEs to large AE event populations according to stick-slip cycles
selected events of highest quality (Kwiatek et al. 2014a, Goebel and discarded AEs associated with large slip events (cf. Figs 1a
et al. 2015, 2017). and c).1374 A. Blanke et al.
3.3 Spectral ratio technique with C = 1.32. The S-wave velocity Vß was obtained from measured
For each grouped AE event population we computed spectral ratios P-wave velocity Vα using:
based on linked AE event pairs (e.g. Kwiatek et al. 2011; Har- Vα
rington et al. 2015). The event linkage was based on three criteria: Vß = √ . (7)
(1) maximum allowed interevent distance d (i.e. colocated events), 3
(2) minimum accepted magnitude difference M between pairs of
events and (3) minimum number of AE neighbours (number of
links), Nmin . These quality parameters were coordinated carefully to 4 R E S U LT S
maximize the empirical Green’s function (eGf) criteria (e.g. Shearer
et al. 2019). Due to the linking of several AE events, each AE could 4.1 Mechanical stress drop and AE activity relations
have numerous eGfs. Such multi-eGf links yielded more stable in-
version results. The low AE activity per stick-slip in sample S12 Each experiment resulted in six stick-slip events clearly indicated by
large measured stress drops (LSDs) in the differential stress curve
Downloaded from https://academic.oup.com/gji/article/224/2/1371/5956490 by Freie Universitaet Berlin user on 26 February 2021
restricted d to 15 mm. The high AE number in sample W5 allowed
using d ≤ 3.7 mm. The minimum magnitude difference for event (Figs 1a and c). The LSDs observed in sample S12 first increase
pairs was M ≥ 0.3 for S12 and M ≥ 0.4 for W5. Finally, the progressively with multiple slips but then remain constant. The post-
AE events were linked by connecting each AE to at least five events slip minimum stress varies. Peak differential stresses of 400 MPa
within d and M, which ensured inversion stability at moderate with maximum LSDs of approx. σ m ≈ 300 MPa are reached for
computational cost. The inversion problem relied on optimizing the
cost function in the form (e.g. Kwiatek et al. 2015) stick-slips four and five. In contrast, maximum peak stress level
for sample W5 stays roughly constant at about 290 MPa (∼25 per
jk jk
Cost (th , obs ) = wi jk ( f ) th ( f ) − obs ( f ) L1 = min, (2) cent lower than in S12). Here, the LSDs increase progressively
i ( j,k) as the post-slip minimum decreases. A maximum stress drop of
with σ m ≈ 190 MPa (∼35 per cent less compared to S12) is reached
for stick-slip number 5.
⎛ 4 ⎞ 12
j j
f ; M0 , f 0
We observe differences in the AE event occurrence in relation
M0 ⎜ 1 +
f
Sj j
jk j j f 0k ⎟
th f ; M0 , M0k , f 0 , f 0k = = ⎝ 4 ⎠ , with differential stress and time between both experiments. Sample
S k f ; M0k , f 0k M0k
1+ f
j W5 features a broader damage zone (cf. Goebel et al. 2014b) com-
f0
(3) pared to specimen S12 (Figs 1b and d). Beyond yield stress, small
mechanical stress drops (SSDs) are frequently observed prior to
to find relative seismic moment M0 and corner frequency f0 for each LSDs of the rough fault (Fig. 1c), clearly reflecting the larger fault
event in a population. We used the Boatwright (1978) source model complexity. Sample W5 shows continuously occurring AEs during
in equation (3). Here, cubed measured velocities and spectral levels the entire stick-slip cycle with an increased AE event rate related to
were used to estimate initial seismic moments. Differences between large and small mechanical stress drops and reduced AE activity in
theoretical and observed spectral ratios, th and obs , of two linked the aftershock sequences (cf. Goebel et al. 2015). For this sample,
AE event pairs (j, k) at sensor i, were weighted equally over all fre- we located a total number of 87 108 AEs. In contrast, sample S12
quencies, using the coefficient wijk , as the original Fourier spectra shows an increased AE activity only close to peak stress and LSDs
S(·) in eq. (3) were interpolated to logarithmic domain beforehand. without prominent aftershock sequences (cf. Kwiatek et al. 2014a).
The weights were set to 0 whenever the signal-to-noise ratio from In total, 1268 AEs were located along the simple saw-cut fault plane
any observed spectra forming the pair (j, k) at station i was below 3 (Fig. 1b). The stress–time curve (Fig. 1a) shows higher yield points,
and therefore outside of the common frequency interval (fmin1 , fmax1 ) higher peak stress and no precursory SSDs as found in sample W5.
∩ (fmin2 , fmax2 ). The multidimensional inversion problem expressed
by eq. (2) was solved using a simulated annealing approach based on
non-stationary Metropolis–Hastings Random Walk (MHRW) algo- 4.2 AE stress drops
rithm (e.g. Sen & Stoffa 1995). The application of MHRW algorithm We obtained source parameters (see also Blanke et al. 2020) of
separately allowed calculating AE stress drop uncertainties. Repre- 688 AEs for sample S12 and 1882 AEs for sample W5 from the
sentative samples of displacement spectra uncertainties are shown first five stick-slip cycles. The determined range of AE stress drops
as heat maps for small, medium and large AE events in Fig. S1 (see is between 0.01 and 100 MPa, which is comparable to the range
Supporting Information). in other studies (Fig. 2a). For sample S12, the estimated MW and
To obtain results comparable to seismological studies at larger σ AE are slightly larger (−9 < MW < −5.6 and 0.01 < σ AE
scales, we followed Kanamori (1977) to calculate the seismic mo- < 100 MPa) than for W5 (−9.1 < MW < −6.6 and 0.01 < σ AE
ment magnitude: < 10 MPa). However, in contrast to induced and natural seismicity
log10 (M0 ) − 9.1 shown in Fig. 2(a), we observe a systematic increase in σ AE with
MW = . (4) magnitude (Fig. 2a, inset). This dependence of σ AE on MW is very
1.5
pronounced in both lab data sets. Our data extend the magnitude
AE stress drop estimates (σ AE ) were obtained following Es- ranges analysed in previous laboratory studies usually spanning
helby (1957) only 1–2 orders of magnitude (see Fig. S2, Supporting Information).
7 M0 Noteworthy are the comparable stress drop estimates between this
σAE = . (5) and previous studies for respective comparable magnitude ranges
16 r 3
(Fig. S2, Supporting Information). We find that the observed MW –
The source radius (rupture dimension) r was estimated from cor- σ AE relation is not affected by bandwidth limitation problems. The
ner frequency measurements assuming the dynamic circular source resolved corner frequencies are below 50 per cent of the maximum
model of Madariaga (1976): fitting frequency (fmax ≈ 2 × 10⁶ Hz), which is typically assumed to
be 80 per cent of the Nyquist frequency (fNy ≈ 5 × 10⁶ Hz) (e.g. Ruhl
C Vß
r = , (6) et al. 2017). In addition, even by excluding the smallest events, the
2π f 0Laboratory AE stress drop-magnitude relation 1375
Downloaded from https://academic.oup.com/gji/article/224/2/1371/5956490 by Freie Universitaet Berlin user on 26 February 2021
Figure 2. (a) Stress drop and source parameter relations, modified after Kwiatek et al. (2011), using the Madariaga (1976) source model. Colours separate
23 different studies of natural-, mining induced- and fracking induced seismicity, and laboratory AE events. This study results (green triangles and circles)
are magnified in the inset. Dashed lines indicate constant stress drops of 0.01–100 MPa. (b) and (c) Regression analysis for interslip periods before the first
stick-slip events (cf. highlighted rectangles in Figs 1a and c) of S12 and W5, respectively. Regression line (solid) is shown with 95 per cent CI of slope variance
(dotted) and considered estimates used to calculate the slope (dashed). (d) and (e) MW –σ AE slope changes per stick-slip cycle (circles). Diamonds represent
mechanical stress drops for each stick-slip event (cf. Figs 1a and c).
observed dependency between MW and σ AE remains (cf. Figs 2b indicates a saturation of slope growth in the latest stick-slip cycles,
and c). analogous to the trend in mechanical stress drop σ m (Fig. 2d).
We performed a least-squares linear regression analysis for both Experiment W5 also shows similar behaviour between σ m and
experiments on each individual interslip period (Figs 2b and c). Data σ AE estimates but does not indicate saturation.
points within a 95 per cent confidence interval (CI) were considered The overall size distribution of AEs can be linked to dominant
for the regression analysis and lower and upper bounds of the 95 length scales in the experiments. Minimum AE source radii, esti-
per cent CI of the regression slope variation were calculated to mated from eq. (6), are approximately limited by the average grain
visualize its possible variance. The sensitivity of σ AE to changes sizes of Westerly granite (see Fig. 3). Differences in surface rough-
in Mw increases with consecutive stick-slip cycles, leading to an ness expressed as rms of vertical topography (cf. Goebel et al.
increase in slope (b) from 1.12 to 1.31 between the first and the last 2014a) in Fig. 3 seem to only play a secondary role in controlling
interslip period for S12 and an increase from b = 0.82 to 1.26 for minimum AE size.
sample W5 (Figs 2d and e). Consequently, while the average value The maximum size of events on the rough surface in sample W5
of b is substantially larger for the smooth fault, the change in b with is similar to the width of the core deformation zone (maximum
slip events is a factor of 2 larger for the rough fault. Sample S12 fault core width = 1.5–3 mm), providing here a plausible upper1376 A. Blanke et al.
Downloaded from https://academic.oup.com/gji/article/224/2/1371/5956490 by Freie Universitaet Berlin user on 26 February 2021
Figure 3. Source radii and static stress drop relation of (a) S12 and (b) W5. Red solid line indicates average grain size of Westerly granite. Dashed line shows
rms of roughness from 2-D white-light interferometry measurement and black horizontal bar indicates maximum width of the fault core along the slip direction
for sample W5.
bound for AE event growth. However, AEs on the smooth fault in Prieto et al. 2004). In the following, we discuss potential effects,
sample S12 also grow to similar sizes, which are clearly beyond non-physical and physical, that may control the presented MW –
peak roughness wavelength and fault core width on S12. Such large σ AE relation.
events on S12 also result in substantially higher σ AE and show
a dominance of earthquake-like double couple source mechanisms
(Fig. S3, Supporting Information). Thus, while minimum event 5.1 Non-physical effects
sizes in both experiments can potentially be linked to grain size
distribution, the maximum seismic event size appears more sensitive Non-physical parameters, related to data quality and analysis, may
to fault roughness with smoother faults producing large magnitude cause apparent dependence of stress drop on magnitude and errors
events with higher σ AE . in source parameter calculations (e.g. Ide & Beroza 2001; Aber-
crombie 2013). The list of potential factors includes large azimuthal
gaps, inaccurate estimates of attenuation (Q), propagation effects,
a limited magnitude range, bandwidth limitations or an inaccurate
5 DISCUSSION
source model.
Whether seismic stress drop of natural and induced seismicity varies To minimize the error-term, we followed several instrumenta-
with earthquake magnitude or remains constant is still a matter of tional and analytical steps: (1) the laboratory setup allows us to
debate. Although, stress drop estimates fall within a similar range design a seismic network that prevents large azimuthal gaps. This
of 0.01–100 MPa for events between MW −9 and MW 4 (Fig. 2), is accomplished by placing sensors all around the sample and the
individual well-resolved data sets show variability potentially due to expected source region and not just along the surface, which is a
differences in underlying source processes. The present laboratory common limitation for natural events. (2) We use the spectral ratio
study clearly highlights a MW –σ AE dependence (Figs 2d and e) method that, if applied carefully, eliminates path and site effects.
beyond the commonly observed range of static stress drop variation In addition, we explore the effect of using several eGfs for each
(e.g. Abercrombie 2015) in individual data sets. This is in contrast event, which adds to the robustness of source spectra inversions.
to a majority of field studies that found a constant static stress (3) Furthermore, our data cover a reasonably large magnitude range
drop independent of event magnitude (e.g. Ide & Beroza 2001; (−9.1 < MW < −5.6), substantially expanding the magnitude spanLaboratory AE stress drop-magnitude relation 1377
of comparable previous AE studies (e.g. McLaskey et al. 2014; With large stick-slip events, asperities may be reduced as the slip
Yoshimitsu et al. 2014). (4) Lower and upper frequency bounds fmin planes become progressively smoother.
and fmax define the range of resolvable frequencies of the AE spectra. Interestingly, in both experiments the source radii of AEs are
Considering the careful selection of analysed AE events including roughly bounded by the average grain size (Fig. 3). This suggests
a good signal-to-noise level, a large number of available recorded that σ AE is slip-controlled and may not scale with grain size
waveforms and estimated spectra, and the application of multi-eGf or source radius. We discuss this hypothesis in more detail in the
links for each analysed event, we consider a potential bandwidth following section.
problem unlikely. Even by excluding the smallest recorded events
with magnitudes MW < −8.4, the clear stress drop–magnitude de-
pendence remains. (5) We use the commonly accepted circular shear
5.2.2 Structural heterogeneity and grain size effects
source model of Boatwright (1978) to make our study comparable
Downloaded from https://academic.oup.com/gji/article/224/2/1371/5956490 by Freie Universitaet Berlin user on 26 February 2021
to previous work. However, we obtain stress drop estimates clearly Grain scale structural heterogeneities may affect AE source radii
exceeding the general observed variability. that in turn affect static stress drops as expressed in eqs (5) and
(6). In general, initial crack size in undeformed rock samples scales
with grain size (e.g. Dresen & Evans 1993). The source radii of AEs
5.2 Physical effects observed in both samples range between 0.4 and 3.5 mm, which is
on the order of grain size variation (Fig. 3). We do not observe
Stress drop may be affected by changes in seismic source processes.
a significant dependence of stress drop on source radius, with the
Suggested factors influencing these processes address a strongly
exception of a weak trend for specimen S12. In contrast, the change
heterogeneous stress field (e.g. Candela et al. 2011; Wang et al.
in σ AE is large compared to the change in source radius. Therefore,
2019), for example, induced by a complex fault geometry (rough-
we posit that observed σ AE variations may be mainly attributed to
ness), and changes in rupture velocity (e.g. Kanamori & Rivera
increasing slip over fracture surfaces correlated to grain size along
2004). Rupture and also slip velocity may be affected by structural
grain boundaries for small events or across multiple grains for larger
and material heterogeneities in the fault zone. However, potential
events (e.g. Candela et al. 2011). This is supported by the observed
effects from these factors have not yet been sufficiently investigated.
increase in complexity of source processes for smaller AE events
(cf. Kwiatek et al. 2014a) displaying a significant contribution of
non-double couple components of AE moment tensors (Fig. S3,
5.2.1 Impact of fault surface roughness
Supporting Information). This again suggests that an increase of
The main macroscopic difference between the experiments analysed the mechanical stress drop, related to progressively increasing slip
in this study is the degree of fault roughness, which in turn leads to over the fault surface, translates to microscale fracture propagation
notable differences in AE rates, peak stresses, yield point and the and AE source characteristics (cf. Figs 2d and e, and 3).
extent of the work-hardening (inelastic) phase (Figs 1a and c). The
smooth fault S12 (Fig. 1b), characterized by a simple homogeneous
fault zone, indicates strong coupling of the saw-cut blocks. The fault
5.2.3 Rupture velocity
remained fully locked up to almost peak stress, which is reflected
by the extended linear mechanical stress increase (Figs 1a and b). Coalescence of cracks during rupture propagation may also result
During the elastic loading phase, AE activity remained very low in higher rupture velocities as ruptures accelerate. For example,
with precursory activity only occurring after differential stresses double-couple (simple shear motion) events occurring in sample
exceeded the yield point (Fig. 1a). The resulting high peak stresses S12 show high stress drops (Fig. S3, Supporting Information). In
were released in slip events with LSDs. contrast, smaller events caused by crack propagation along grain
In contrast, the rough fault W5 (Fig. 1d) exhibits a broader dam- boundaries and kinks may display only limited slip and are charac-
age zone and an anastomosing network of slip surfaces (Goebel et al. terized by larger non-double-couple components. It is conceivable
2012). The higher roughness likely results in relatively poor cou- that during complex crack growth more energy is spent in crack sur-
pling of the fault blocks. The yield point occurred at lower stresses face energy and heat at the expense of radiated energy (Kanamori
within the interslip periods and AE activity was high during loading & Brodsky 2004). This could cause spatially variable seismic slips
and SSDs (Fig. 1c). Peak stresses at LSDs were 25 per cent lower (e.g. Mai & Beroza 2002) independent of source radius but depen-
than on the smooth surface. Similarly, σ m was about 35 per cent dent on roughness (cf. Candela et al. 2011).
smaller. To test whether changes in rupture velocity (Vr ) significantly
The differences due to fault roughness are also reflected in AE affect our stress drop observations, we reduced Vr with decreasing
source parameters. On the rough surface the maximum AE moment MW , using correction factors provided by Sato & Hirasawa (1973).
magnitudes (MWmax ∼ −6.6) and stress drops (σ AEmax ∼ 10 MPa) We first adjusted source radii and stress drops using eqs (6) and
are about one order smaller than on the smooth surface (MWmax (5), respectively. We then calculated a mean MW –σ AE regression
∼ −5.6, σ AEmax ∼ 100 MPa). The smooth fault S12 shows a slope for each experiment by gathering AEs from all analysed AE
weak slope increase of MW –σ AE regression lines as peak stress populations. We reduced Vr to 50 per cent for the smallest AEs.
and σ m increase for the first four slip events (Fig. 2d). This may By reducing AE rupture velocities from 90 per cent to 50 per cent,
be related to conditioning of the saw-cut in combination with in- Vr shows only a small effect on MW –σ AE regression slopes for
creasing formation of fault gouge. That likely causes the larger AE sample S12 (Fig. S4, Supporting Information). The effect is slightly
stress drops and greater moment magnitudes. The increase of σ m more visible for sample W5, due to an increase of stress drop for
and MW –σ AE regression slopes may saturate once a thin but sta- small events (cf. Kanamori & Rivera 2004). The still existing scaling
ble gouge layer covers the slip surface. The rough fault W5 shows clearly shows only a limited effect of Vr changes on the MW –σ AE
an increase of σ m and MW –σ AE regression slopes possibly in scaling relation. This suggests that the observed changes in stress
response to a continuous destruction and smoothing of asperities. drop may be related to complex rupture along a rough slip plane,1378 A. Blanke et al.
possibly leading to varying radiated energy and energy partitioning stress drops require mature, smooth faults, whereas rougher faults
during slip. promote lower stress drop events. Similarly, crustal heterogeneity
may be an important factor that governs earthquake stress drop vari-
ations in nature. This needs to be further investigated, in particular
5.3 Implications for tectonic earthquakes along fault for hazard-prone plate-bounding earthquakes, given the large im-
zones plications for the resulting risk to near-fault population centres and
infrastructure.
Few field studies have investigated the effect of fault maturity and
related roughness evolution on earthquake source parameters (e.g.
Ben-Zion & Sammis 2003; Şengör et al. 2005; Sagy et al. 2007;
AC K N OW L E D G E M E N T S
Brodsky et al. 2011; Bohnhoff et al. 2016). Geometric complexity
is thought to decrease with increasing fault length of fault seg- We would like to thank the Editor Andrea Morelli and the Reviewers
Downloaded from https://academic.oup.com/gji/article/224/2/1371/5956490 by Freie Universitaet Berlin user on 26 February 2021
ments, finite displacement and age. Martı́nez-Garzón et al. (2015) Art McGarr and Yihe Huang for helpful comments and suggestions.
showed that for strike-slip faults maximum observed earthquake The experiments were conducted at GFZ German Research Centre
magnitudes generally scale with total slip and fault length. Dynamic for Geosciences. Data can be accessed via the GFZ Data Services
rupture models indicate that geometric complexity and associated (see Blanke et al. 2020) and by contacting the first author. This study
stress field heterogeneity affect the entire source process from nucle- has been partially funded by the H2020 project SERA (Seismology
ation to rupture arrest and therefore also affect stress drop, rupture and Earthquake Engineering Research Infrastructure Alliance for
velocity and radiated energy (e.g. Ripperger et al. 2007). Europe, grant agreement no. 730900). GK acknowledges support
Comparing our tests to field observations, a fresh fractured sur- from the Deutsche Forschungsgemeinschaft (DFG), grant KW 84/4-
face in the laboratory may be a good proxy for an ‘immature’ and 1. The processing of data and generation of figures were done using
complex natural fault zone (e.g. Kwiatek et al. 2014a; Goebel et al. MATLAB R2017a (https://www.mathworks.com/products/matlab.
2017). A smooth saw-cut fault may serve as a laboratory analogue of html, last accessed December 2019) and POV-RAY v3.7 (http://ww
a ‘mature’ fault that experienced extensive surface smoothing due w.povray.org/, last accessed December 2019).
to multiple seismic events over a long time-span. Nevertheless, up-
scaling laboratory observations to natural earthquakes remains chal-
lenging, not least due to the fact that characteristic length scales are REFERENCES
very different between field and laboratory tests. Upscaling not only Abercrombie, R.E., 1995. Earthquake source scaling relationship from -1 to
involves formulating appropriate constitutive laws for key physical 5 ML using seismograms recorded at 2.5 km depth, J. geophys. Res., 100,
processes observed in experiments but also some renormalization 24 015–24 036.
procedure allowing to formulate, for example, an effective friction Abercrombie, R.E. & Rice, J.R., 2005. Can observations of earthquake
scaling constrain slip weakening?, Geophys. J. Int., 162, 406–424.
law (Campillo et al. 2001). Furthermore, the actual roughness of
Abercrombie, R.E., 2013. Comparison of direct and coda wave stress drop
natural faults at seismogenic depth is yet to be determined, which measurements for the Wells, Nevada, earthquake sequence, J. geophys.
is an extremely challenging task. Thus, laboratory experiments that Res. Solid Earth, 118, 1458–1470.
focus on key parameters related to seismic slip and stress drop varia- Abercrombie, R.E., 2015. Investigating uncertainties in empirical Green’s
tions will remain the only analogue of hazardous earthquakes along function analysis of earthquake source parameters, J. geophys. Res. Solid
tectonic faults. Earth, 120, 4263–4277.
Aki, K., 1967. Scaling law of seismic spectra, J. geophys. Res., 72(4), 1217–
1231.
6 C O N C LU S I O N Allmann, B.P. & Shearer, P.M., 2009. Global variations of stress drop
for moderate to large earthquakes, J. geophys. Res., 114, B01310,
We investigated seismic and mechanical stress drop variations dur- doi:10.1029/2008JB005821.
ing triaxial stick-slip experiments on two faulted Westerly granite Baltay, A., Ide, S., Prieto, G. & Beroza, G., 2011. Variability in earth-
samples with different roughness. We cover a broad magnitude quake stress drop and apparent stress, Geophys. Res. Lett., 38, L06303,
range of −9 < MW < −5.6, which is substantially larger than in doi:10.1029/2011GL046698.
previous related AE studies. Using the spectral ratio method, we Baltay, A.S., Hanks, T.C. & Abrahamson, N.A., 2019. Earthquake stress
drop and arias intensity, J. geophys. Res., 124(4), 3838–3852.
calculated AE stress drops which are within a comparable range of
Beeler, N., 2006. Inferring earthquake source properties from laboratory
observations from induced and natural earthquakes up to MW = 4. A
observations and the scope of lab contributions to source physics, in
key observation is the strong increase of AE static stress drop with Earthquakes: Radiated Energy and the Physics of Faulting, pp. 99–119,
AE magnitude, which differs from most source studies analysing eds. Abercrombie, R., McGarr, A., Di Toro, G. & Kanamori, H., AGU,
natural seismicity and seems to be much more pronounced for AE Washington, DC.
events. This increase is most pronounced for AEs on smooth sur- Ben-Zion, Y. & Sammis, C.G., 2003. Characterization of fault zones, Pure
faces. The slope of the corresponding relationship between σ AE appl. Geophys., 160, 677–715.
and MW increases with consecutive stick-slips on rough surfaces. Blanke, A., Goebel, T. & Kwiatek, G., 2020. Acoustic emission source
Mechanical stress drops also increase with successive slip events on parameters of laboratory triaxial stick-slip experiments on two Westerly
rough and smooth surfaces potentially due to progressive surface granite samples, GFZ Data Services, https://doi.org/10.5880/GFZ.4.2.20
20.008.
smoothing. Average grain size and the width of the fault core provide
Boatwright, J., 1978. Detailed spectral analysis of two small New York State
approximate lower and upper bounds of AE sizes on rough surfaces.
earthquakes, Bull. seism. Soc. Am., 68, 1131–1177.
Large AE events on smooth fault surfaces exhibit the highest stress Bohnhoff, M., Dresen, G., Ellsworth, W.L. & Ito, H., 2009. Passive seismic
drops and are dominated by double-couple moment tensors. Our monitoring of natural and induced earthquakes: case studies, future direc-
results indicate a direct coupling between the scale of heterogeneity tions and socio-economic relevance, in New Frontiers in Integrated Solid
(grain size, roughness and damage zone width) and seismic event Earth Sci., pp. 261–285, eds. Cloetingh, S. & Negendank, J., Springer,
characteristics in the laboratory. The experiments suggest that larger Dordrecht.Laboratory AE stress drop-magnitude relation 1379
Bohnhoff, M., Martı́nez-Garzón, P., Bulut, F., Stierle, E. & Ben-Zion, Y., Kanamori, H., 1977. The energy released in great earthquakes, J. geophys.
2016. Maximum earthquake magnitudes along different sections of the Res., 82(20), 2981–2987.
North Anatolian fault zone, Tectonophysics, 674, 147–165. Kanamori, H. & Brodsky, E.E., 2004. The physics of earthquakes, Rep.
Brace, W.F. & Byerlee, J.D., 1966. Stick-slip as a mechanism for earthquakes, Prog. Phys., 67, 1429–1496.
Science, 153(3739), 990–992. Kanamori, H. & Rivera, L., 2004. Static and dynamic scaling relations for
Brodsky, E.E., Gilchrist, J.J., Sagy, A. & Collettini, C., 2011. Faults smooth earthquakes and their implications for rupture speed and stress drop, Bull.
gradually as a function of slip, Earth planet. Sci. Lett, 302, 185–193. seism. Soc. Am., 94(1), 314–319.
Brune, J.N., 1970. Tectonic stress and the spectra of seismic shear waves Kanamori, H. & Rivera, L., 2006. Energy partitioning during an earthquake,
from earthquakes, J. geophys. Res., 75(26), 4997–5009. In Earthquakes: Radiated Energy and the Physics of Faulting (eds R.
Campillo, M., Favreau, P., Ionescu, I.R. & Voisin, C., 2001. On the effective Abercrombie, A. McGarr, G. Di Toro & H. Kanamori), Geophys. Monogr.
friction law of a heterogeneous fault, J. geophys. Res., 106(B8), 16 307– Ser., Vol. 170, pp. 3–13, Washington, DC: AGU.
16 322. Kwiatek, G., Plenkers, K., Dresen, G. &JAGUARS Research Group, 2011.
Downloaded from https://academic.oup.com/gji/article/224/2/1371/5956490 by Freie Universitaet Berlin user on 26 February 2021
Candela, T., Renard, F., Bouchon, M., Schmittbuhl, J. & Brodsky, E.E., 2011. Source parameters of picoseismicity recorded at Mponeng Deep Gold
Stress drop during earthquakes: Effect of fault roughness scaling, Bull. Mine, South Africa: implications for scaling relations, Bull. seism. Soc.
seism. Soc. Am., 101(5), 2369–2387. Am., 101(6), 2592–2608.
Cocco, M., Tinti, E. & Antonella, C., 2016. On the scale dependence of Kwiatek, G., Goebel, T.H.W. & Dresen, G., 2014a. Seismic moment tensor
earthquake stress drop, J. Seismol., 20(4), 1151–1170. and b value variations over successive seismic cycles in laboratory stick-
Cotton, F., Archuleta, R. & Causse, M., 2013. What is sigma of the stress slip experiments, Geophys. Res. Lett., 41, 5838–5846.
drop?, Seismol. Res. Lett., 84(1), 42–48. Kwiatek, G., Charalampidou, E.-M., Dresen, G. & Stanchits, S., 2014b. An
Dresen, G. & Evans, B., 1993. Brittle and semibrittle deformation of syn- improved method for seismic moment tensor inversion of acoustic emis-
thetic marbles composed of two phases, J. geophys. Res., 98(B7), 11 921– sions through assessment of sensor coupling and sensitivity to incidence
11 933. angle, Int. J. Rock Mech. Min. Sci., 65, 153–161.
Dresen, G., Kwiatek, G., Goebel, T.H.W. & Ben-Zion, Y., 2020. Partitioning Kwiatek, G., Bulut, F., Bohnhoff, M. & Dresen, G., 2014c. High-resolution
of seismic and aseismic preparatory processes before stick-slip failure, analysis of seismicity induced at Berlı́n geothermal field, El Salvador,
Pure appl. Geophys., https://doi.org/10.1007/s00024-020-02605-x. Geothermics, 52, 98–111.
Eshelby, J.D., 1957. The determination of the elastic field of an ellipsoidal Kwiatek, G., Martı́nez-Garzón, P., Dresen, G., Bohnhoff, M., Sone, H. &
inclusion, and related problems, Proc. R. Soc. Lond. A., 241, 376–396. Hartline, C., 2015. Effects of long-term fluid injection on induced seis-
Goebel, T.H.W., Becker, T.W., Schorlemmer, D., Stanchits, S., Sammis, C., micity parameters and maximum magnitude in northwestern part of The
Rybacki, E. & Dresen, G., 2012. Identifying fault heterogeneity through Geysers geothermal field, J. geophys. Res. Solid Earth, 120, 7085–7101.
mapping spatial anomalies in acoustic emission statistics, J. geophys. Res., Madariaga, R., 1976. Dynamics of an expanding circular fault, Bull. seism.
117, B03310, doi:10.1029/2011JB008763. Soc. Am., 66(3), 639–666.
Goebel, T.H.W., Schorlemmer, D., Becker, T.W., Dresen, G. & Sammis, C.G., Mai, P.M. & Beroza, G.C., 2002. A spatial random field model to characterize
2013. Acoustic emission document stress changes over many seismic complexity in earthquake slip, J. geophys. Res., 107(B11), ESE 10–11-
cycles in stick-slip experiments, Geophys. Res. Lett., 40, 2049–2054. ESE 10-21.
Goebel, T.H.W., Candela, T., Sammis, C.G., Becker, T.W., Dresen, G. & Martı́nez-Garzón, P., Bohnhoff, M., Ben-Zion, Y. & Dresen, G., 2015. Scal-
Schorlemmer, D., 2014a. Seismic event distributions and off-fault damage ing of maximum observed magnitudes with geometrical and stress prop-
during frictional sliding of saw-cut surfaces with pre-defined roughness, erties of strike-slip faults, Geophys. Res. Lett., 42, 10,230–210,238.
Geophys. J. Int., 196, 612–625. McGarr, A. & Fletcher, J.B., 2003. Maximum slip in earthquake fault zones,
Goebel, T.H.W., Becker, T.W., Sammis, C.G., Dresen, G. & Schorlemmer, apparent stress, and stick-slip friction, Bull. seism. Soc. Am., 93(6), 2355–
D., 2014b. Off-fault damage and acoustic emission distribution during the 2362.
evolution of structurally complex faults over series of stick-slip events, McLaskey, G.C., Kilgore, B.D., Lockner, D.A. & Beeler, N.M., 2014. Labo-
Geophys. J. Int., 197, 1705–1718. ratory generated M -6 earthquakes, Pure appl. Geophys., 171, 2601–2615.
Goebel, T.H.W., Sammis, C.G., Becker, T.W., Dresen, G. & Schorlemmer, Percival, D.B. & Walden, A.T., 1993. Spectral Analysis for Physical Appli-
D., 2015. A comparison of seismicity characteristics and fault structure cations: Multitaper and Conventional Univariate Techniques, Cambridge
between stick-slip experiments and nature, Pure appl. Geophys., 172, University Press, doi:10.1017/CB09780511622762.
2247–2264. Plenkers, K., Schorlemmer, D. & Kwiatek, G. the JAGUARS Research
Goebel, T.H.W., Kwiatek, G., Becker, T.W., Brodsky, E.E. & Dresen, G., Group, 2011. On the probability of detecting picoseismicity, Bull. seism.
2017. What allows seismic events to grow big?: insights from b-value and Soc. Am., 101(6), 2579–2591.
fault roughness analysis in laboratory stick-slip experiments, Geology, Prieto, G., Shearer, P.M., Vernon, F.L. & Kilb, D., 2004. Earthquake source
45(9), 815–818. scaling and self-similarity estimation from stacking P and S spectra, J.
Goodfellow, S.D. & Young, R.P., 2014. A laboratory acoustic emission geophys. Res., 109, B08310, doi: 10.1029/2004JB003084.
experiment under in situ conditions, Geophys. Res. Lett., 41, 3422–3430. Ripperger, J., Ampuero, J.-P., Mai, P.M. & Giardini, D., 2007. Earthquake
Harrington, R.M., Kwiatek, G. & Moran, S.C., 2015. Self-similar rupture source characteristics from dynamic rupture with constrained stochastic
implied by scaling properties of volcanic earthquakes occurring during fault stress, J. geophys. Res., 112, B04311, doi:10.1029/2006JB004515.
the 2004–2008 eruption of Mount St. Helens, Washington, J. geophys. Ruhl, C.J., Abercrombie, R.E. & Smith, K.D., 2017. Spatiotemporal varia-
Res. Solid Earth, 120, doi:10.1002/2014JB011744. tion of stress drop during the 2008 Mogul, Nevada, earthquake swarm, J.
Huang, Y., Beroza, G.C. & Ellsworth, W.L., 2016. Stress drop estimates geophys. Res. Solid Earth, 122, 8163–8180.
of potentially induced earthquakes in the Guy-Greenbrier sequence, J. Sagy, A., Brodsky, E.E. & Axen, G.J., 2007. Evolution of fault-surface
geophys. Res. Solid Earth, 121, 65597–66607. roughness with slip, Geology, 35(3), 283–286.
Huang, Y., Ellsworth, W.L. & Beroza, G.C., 2017. Stress drops of induced Sato, T. & Hirasawa, T., 1973. Body wave spectra from propagating shear
and tectonic earthquakes in the central United States are indistinguishable, cracks, J. Phys. Earth, 21, 415–431.
Sci. Adv., 3(8), doi:10.1126/sciadv.1700772. Sen, P. & Stoffa, L., 1995. Global Optimization Methods in Geophysical In-
Ide, S. & Beroza, G.C., 2001. Does apparent stress vary with earthquake version, Advances in Exploration Geophysics, vol. 4, 1st edition, Elsevier
size?, Geophys. Res. Lett., 28(17), 3349–3352. Science, Amsterdam.
Ide, S., Beroza, G.C., Prejean, S.G. & Ellsworth, W.L., 2003. Apparent Şengör, A.M.C., Tuysuz, O., Imren, C., Sakinc, M., Eyidogan, H., Gorur,
break in earthquake scaling due to path and site effects on deep borehole G., Le Pichon, X. & Rangin, C., 2005. The North Anatolian fault: a new
recordings, J. geophys. Res., 108(B5), 2271, doi:10.1029/2001JB001617. look, Annu. Rev. Earth planet. Sci., 33, 37–112.1380 A. Blanke et al.
Shearer, P.M., Abercrombie, R.E., Trugman, D.T. & Wang, W., 2019. Com- parameters. Pink solid vertical and horizontal lines indicate max-
paring EGF methods for estimating corner frequency and stress drop from imum likelihood solution. Black thick solid line shows the corre-
P wave spectra, J. geophys. Res. Solid Earth, 124, 3966–3986. sponding optimum spectral fit. Dark and light shaded parts indicate
Spottiswoode, S.M., 1993. Seismic attenuation in deep-level mines, in: Pro- heat map of spectral fits showing optimal and non-optimal fitting ar-
ceedings of the 3rd International Symposium on Rockbursts and Seismic-
eas, respectively. Black dashed lines constrain the area of acceptable
ity in Mines, pp. 409–414, ed. Young, R.P., Kingston, Canada, Balkema,
spectral fittings (95 per cent CI).
Rotterdam.
Stanchits, S., Vinciguerra, S. & Dresen, G., 2006. Ultrasonic velocities, Figure S2: Magnification of laboratory AE study results from
acoustic emission characteristics and crack damage of basalt and granite, Fig. 2(a). Seismic source parameter relations from (a) this study
Pure appl. Geophys., 163(5-6), 975–994. with circles indicating results of W5 and triangles showing results
Thompson, B.D., Young, R.P. & Lockner, D.A., 2009. Premonitory acoustic of S12, (b) Yoshimitsu et al. (2014), (c) McLaskey et al. (2014)
emissions and stick-slip in natural and smooth-faulted Westerly granite, and (d) Goodfellow & Young (2014). Dashed lines indicate con-
Downloaded from https://academic.oup.com/gji/article/224/2/1371/5956490 by Freie Universitaet Berlin user on 26 February 2021
J. geophys. Res., 114, B02205, doi:10.1029/2008JB005753. stant stress drops (σ AE ) of 0.01–100 MPa. Note this study (Fig.
Tullis, J. & Yund, R.A., 1977. Experimental deformation of dry Westerly S2a) shows a broader span of magnitudes and corner frequencies
granite, J. geophys. Res., 82(36), 5705–5718. and a larger number of AE events. A static stress drop dependence
Wang, H., Ren, Y., Wen, R. & Xu, P., 2019. Breakdown of earthquake self-
on event size is visible. This study covers the magnitude ranges of
similar scaling and source rupture directivity in the 2016–2017 central
the other shown laboratory studies. Comparable static stress drop
Italy seismic sequence, J. geophys. Res. Solid Earth, 124, 3898–3917.
Yoshimitsu, N., Kawakata, H. & Takahashi, N., 2014. Magnitude –7 level estimates for same magnitude ranges are obtained.
earthquakes: a new lower limit of self-similarity in seismic scaling rela- Figure S3: Relation of estimated AE moment magnitudes and ISO
tionships, Geophys. Res. Lett., 41, 4495–4502. component percentages of full moment tensor solutions of experi-
Zang, A.F., Wagner, F.C., Stanchits, S., Dresen, G., Andersen, R. & ment S12 (modified after Kwiatek et al. 2014a). Data shown here,
Haidekker, M.A., 1998. Source analysis of acoustic emissions in Aue are gathered from all stick-slip cycles and colour-coded by their
granite cores under symmetric and asymmetric compressive loads, stress drop estimates (σ AE ). Solid line indicates median ISO com-
Geophys. J. Int., 135(3), 1113–1130. ponent estimated per 0.1 magnitude bin. Note the relationship be-
tween low stress drop estimates, small AE magnitudes and larger
negative amount of ISO component and vice versa.
S U P P O RT I N G I N F O R M AT I O N Figure S4: Regression slope changes caused by a rupture velocity
reduction for small AEs. AE events of all AE populations were
Supplementary data are available at GJ I online.
gathered to show the mean slope for (a) S12 and (b) W5. Solid lines
Figure S1: AE waveforms of (a) a large (MW = −5.7), (b) a medium are calculated using Sato & Hirasawa (1973) constants for 0.9 Vr
(MW = −7.5) and (c) a small (MW = −8.7) AE event. Highlighted rupture velocity. Dashed lines show the changed slope for 0.5 Vr .
are the P-onset pick (red), the selected waveform window (blue) and Arrows indicate a shift (increase) in static stress drop (σ AE ).
the reference noise signal (grey) used for the inversion. Subfigures
(d)–(f) visualize the corresponding average observed spectra (blue Please note: Oxford University Press is not responsible for the con-
line) with average noise level (grey line) and the source parame- tent or functionality of any supporting materials supplied by the
ter fitting. Grey dots show the MHRW-sampled corner frequency– authors. Any queries (other than missing material) should be di-
seismic moment pairs representing uncertainties of estimated source rected to the corresponding author for the paper.You can also read