Stress loading history of earthquake faults influenced by fault/shear zone geometry and coulomb pre stress - Nature
←
→
Page content transcription
If your browser does not render page correctly, please read the page content below
www.nature.com/scientificreports
OPEN Stress loading history
of earthquake faults influenced
by fault/shear zone geometry
and Coulomb pre‑stress
Claudia Sgambato1*, Joanna Phoebe Faure Walker1, Zoë Keiki Mildon2 &
Gerald Patrick Roberts3
Whether the stress-loading of faults to failure in earthquakes appears to be random or to an extent
explainable, given constraints on fault/shear-zone interaction and the build-up and release of stress
over many earthquake cycles, is a key question for seismic hazard assessment. Here we investigate
earthquake recurrence for a system of 25 active normal faults arranged predominantly along strike
from each other, allowing us to isolate the effects of stress-loading due to regional strain versus
across- and along-strike fault interaction. We calculate stress changes over 6 centuries due to
interseismic loading and 25 > Mw 5.5 earthquakes. Where only one fault exists across strike, stress-
loading is dominated by the regional tectonics through slip on underlying shear zones and fault planes
have spatially smooth stress with predominantly time-dependent stress increase. Conversely, where
faults are stress-loaded by across-strike fault interactions, fault planes have more irregular stress
patterns and interaction-influenced stress loading histories. Stress-loading to failure in earthquakes is
not the same for all faults and is dependent on the geometry of the fault/shear-zone system.
The stress-loading of faults to failure in earthquakes is driven by regional tectonics, but is also influenced by fault
interaction during earthquakes, evidenced by calculations of Coulomb stress transfer (CST) and corresponding
changes in the rate of seismicity1–3. Faults also interact over longer time periods evidenced by fault displace-
ment profiles that show steep displacement gradients and enhanced displacements on adjacent fault t ips4,5, and
observations of finite fault displacement profiles that adhere to global scaling relationships between fault length
and fault displacement, both for isolated faults and for closely-spaced fault networks (d = γL, where γ = 0.03 for
both isolated faults and summed across the strike of fault n etworks6,7). However, despite the above evidence for
organisation of both the stress-loading to failure process and long-term displacement accumulation, earthquake
recurrence is often considered to be a random Poisson process for some seismic hazard p urposes8,9. The link
between fault interaction during single earthquakes and over multiple seismic cycles described above argues that
the recurrence of earthquakes must sum to produce the long-term displacement profiles. Hence displacement
accumulation during earthquakes over the long-term is not random, and must be influenced by interaction,
which is in turn governed by fault system geometry. However, study of geometry-controlled interaction is com-
plicated by the fact that fault systems are complex, commonly exhibiting multiple overlapping faults, and it is
difficult to isolate the effects of earthquake-inducing stress accumulation caused by tectonic loading as opposed
to loading due to rupture of neighbouring faults both along and across strike10. Without isolation of these effects
it is challenging to assess what aspects of the stress-loading to failure, and hence seismicity, might be in some
way explainable given observations of fault system geometries. Furthermore, stress-loading due to slip on shear
zones in the lower crust, which have been observed in metamorphic rocks, and inferred to exist beneath active
faults in the brittle crust, are rarely included in studies of interaction for brittle faults in the upper crust10. Hence,
the effect of stress loading from shear-zones slip in the interaction process merits further study.
1
Institute for Risk and Disaster Reduction, University College London, Gower Street, London WC1E 6BT,
UK. 2School of Geography, Earth and Environmental Sciences, University of Plymouth, Drake Circus, Plymouth PL4
8AA, UK. 3Department of Earth and Planetary Sciences, Birkbeck, University of London, Malet Street,
London WC1E 7HX, UK. *email: claudia.sgambato.17@ucl.ac.uk
Scientific Reports | (2020) 10:12724 | https://doi.org/10.1038/s41598-020-69681-w 1
Vol.:(0123456789)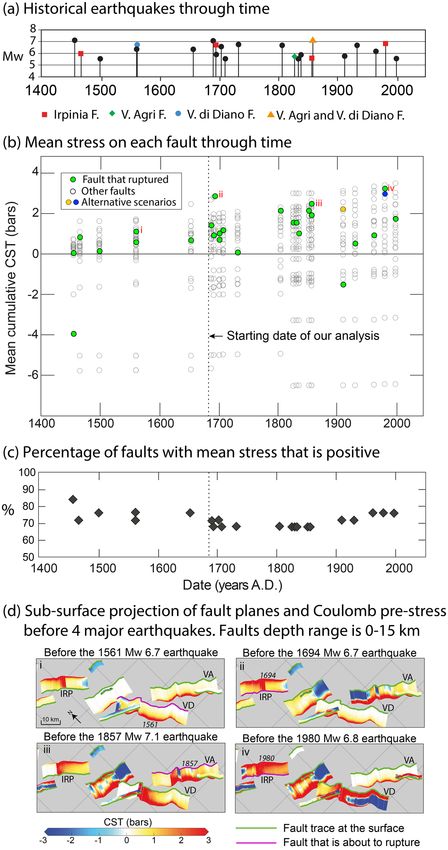
www.nature.com/scientificreports/
In this paper we examine a fault system in southern Italy where we can isolate the effects of regional tectonic
loading from across strike fault interaction, because in places only a single fault accommodates all of the regional
deformation, whereas elsewhere several faults exist across strike and interact to share the tectonic strain (Fig. 1).
Furthermore, for this area the existence and behaviour of shear-zones is constrained by a study of the link
between the topographic drive for extension and strain-rates measured over multiple m illennia11. Viscous shear-
zones in the lower crust drive slip on the overlying brittle faults, evidenced by a power-law relationship between
slip-rates on upper crustal faults and topographic driving stresses, with an exponent 3.3 (range of 2.7–3.4 across
at the 95% confidence level for length scales 5–60 km)11, that is reminiscent of that for viscous flow laws12. With
the role of shear zones relatively-well constrained, we conduct an analysis of CST in the southern Apennines,
Italy, that includes coseismic stress loading due to interactions between faults during earthquakes (25 > Mw 5.5
earthquakes since 1349 A.D.), plus interseismic loading from shear zone slip that includes postseismic afterslip.
We search for aspects of the stress loading history that can be linked to fault system geometry and show that
some aspects of the stress-loading to failure in earthquakes appears not to be random, but explainable given
quantitative constraints on the fault interaction.
Earthquake deformation in the southern Apennines and model set‑up
The Southern Apennines are characterised by extension since 2–3 Ma13–15, associated with damaging earthquakes
of Mw 5.5–7.1, occurring on active normal faults orientated NW–SE, such as the 1980 Irpinia earthquake, Mw
6.8, that caused 3,000 deaths, and the 1857 Val d’Agri earthquake, Mw 7.1, that caused upwards of 10,000 d eaths16
(Fig. 1). Decadal extension rates measured with GPS and those implied by the measured offsets of slopes formed
during the demise of the Last Glacial Maximum (15 ± 3 kyrs B.P.) across fault scarps are in reasonable agree-
ment (~ 1–2 mm/year)17–19. This suggests that active normal faulting in this region is localised across a narrow
fault system that in places has only a single fault accommodating the regional extension (Fig. 1b). The narrow
zone in which extension occurs is confirmed by GPS data that show SW–NE velocities increase by ~ 1–2 mm/
year across a zone only 10–20 km wide coincident with the position of the mapped active faults17. Throw across
the faults has been measured from geological cross-sections, with individual faults having throw/length ratios
of 0.03–0.06, with a value of 0.02 for the summed throw profile, similar to global v alues18 (Fig. 1a). The Italian
historical earthquake catalogue for this region is considered to be complete for events with Mw > 5.8 after 1349
A.D.16,20. Attempts have been made to explain the historical sequence of earthquakes in the Southern Apennines
through CST, which shows that most of the ruptures occurred in areas of high static stress increase produced
by coseismic stress changes21. Since then, approaches to modelling Coulomb stress have improved, allowing
inclusion of information on variable fault g eometry22 and interseismic stress loading from underlying shear
zones10,23,24. Thus, we have included these in our calculations.
We input the strike-variable geometry of the faults using published code22, modelled CST for each historical
earthquake, and added interseismic loading from creep on underlying shear zones10 (Fig. 1c,d). Creep rates were
assumed to be identical to slip-rates measured at the surface since 15 ± 3 k a11, with values from published sources
and our own mapping10,14,18,19,25–27. Any postseismic afterslip on surface scarps would be included in surface slip
values so the interseismic creep modelled includes postseismic afterslip, so we do not model postseismic stress
changes due to viscoelastic afterslip s eparately28. Based on other studies, we hypothesise that the magnitude
of stress changes due to distributed postseismic relaxation would be relatively small (typically ± ~ 0.01 bars in
100 years)29, and thus overwhelmed by the ± ~ 0.01 bars annual interseismic loading rate (Fig. 1c), given that
the earthquakes we study are tens to hundreds of years apart in time. With the fault spacing we examine (typi-
cally ~ 15 km), post-seismic relaxation after earthquakes raises the stress both in the hangingwall and footwall
of a Mw 6.9 earthquake by < 0.1–0.5 bars over tens of years at hypocentral depths, and along-strike post-seismic
stress changes are also positive, but with even lower values30. Thus, post-seismic relaxation would, if included,
modify coseismic CST changes bywww.nature.com/scientificreports/
Figure 1. Characterisation of the study area. (a) Map of active faults in the Southern Apennines: fault traces
are in red; faults rupturing in historical time with date of earthquakes are in yellow. Main towns are shown.
Inset shows scaling relationships for the fault system in the area (data from r eference47). (b) Plot showing the
number of active faults across strike along the Southern Apennines. (c) 3D strike-variable active faults in the
Southern Apennines, stress represents one year of interseismic loading rate transferred from shear zones to the
brittle portion; both stress-loading onto the brittle portion of the fault and the annual slip distribution on the
underlying shear zones we used is shown. (d) Map of cumulative coseismic, postseismic and interseismic CST
for the timeframe considered in this study (from 1349 A.D. to 1998 A.D.). Dashed box includes the location of
the area shown in detail in Fig. 2d. UTM coordinates are indicated in thousands of meters.
Scientific Reports | (2020) 10:12724 | https://doi.org/10.1038/s41598-020-69681-w 3
Vol.:(0123456789)www.nature.com/scientificreports/
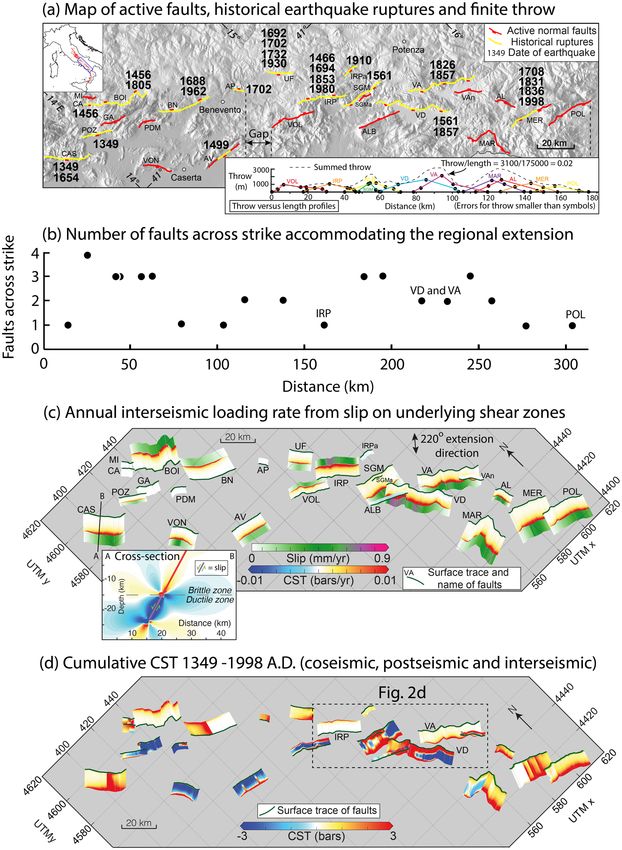
Figure 2. Analysis of cumulative CST and pre-stress heterogeneities prior to historical ruptures. (a) Historical
earthquakes occurring since 1349 A.D., with coloured dots showing earthquakes occurring on the Irpinia
fault, Val d’Agri fault and Vallo di Diano fault. (b) Mean cumulative CST calculated for all the faults prior to
each historical earthquake. The faults that rupture (green circles) show positive mean cumulative CST since
1692 A.D., except for the 1910 earthquake, that occurred on the Irpinia Antithetic fault; yellow and blue circles
represent alternative scenarios. (c) Plot showing the percentage of faults in the Southern Apennines that have
mean Coulomb stress that is positive. (d) Panels showing the pattern of Coulomb pre-stress before some of the
strongest earthquakes in the Southern Apennines. Location of the area is shown in the dashed box in Fig. 1d.
The fault that ruptures next is indicated by purple lines. The figure highlights how the stress on the Irpinia fault
before the events in 1694 and 1980 is relatively uniform (ii, iv), compared to the stress on the Vallo di Diano and
Val d’Agri faults prior to the earthquakes in 1561 and 1857 (i, iii).
Scientific Reports | (2020) 10:12724 | https://doi.org/10.1038/s41598-020-69681-w 4
Vol:.(1234567890)www.nature.com/scientificreports/
Figure 3. Comparison of Coulomb pre-stress over time. (a) Mean Coulomb pre-stress across the whole fault
surface; (b) mean pre-stress calculated at 7 km depth; (c) mean pre-stress calculated at 15 km depth. Orange
diamonds indicate partial ruptures, red diamonds are total ruptures of the whole fault surface; blue diamonds
represent the imposed condition of zero stress on fault, immediately after a total rupture. (i) Coulomb pre-
stress on the Irpinia fault. No stress changes due to ruptures on neighbouring faults are observed. (ii) Coulomb
pre-stress on the Val d’Agri fault. Dashed boxes highlight stress changes due to rupture occurring on the Vallo
di Diano fault, located across strike; at 15 km depth, the stress changes due to across-strike interaction are
overwhelmed by the stress changes due to interseismic loading produced by slip on shear zones at depth; (iii)
Coulomb pre-stress on the Vallo di Diano fault. Events marked as I–II refer to two events occurring in the same
year, two events in July and August 1561, and two events separated by a few minutes in 1857. Dashed boxes
highlight stress changes due to rupture occurring across strike on the Val d’Agri fault. (iv) Coulomb pre-stress
for the Pollino fault. No known M > 5.5 earthquake is attributed to the fault in historical time.
Firstly, since 1692 A.D., 16 out of 17 of the earthquakes occurred on faults that had positive CST values before
each earthquake (23 out of 25 earthquakes when considering the whole sequence, since 1456 A.D.; Supplementary
Data 1c). The mean CST value on faults that ruptured was > 0.5 bars in 81% of the cases (Supplementary Video
1; Supplementary Data 1c), higher than the hypothesised CST triggering threshold of 0.1–0.5 bars1,33,34. A nega-
tive CST value is present only for the Mw 5.76 earthquake in 1910 A.D. that we have modelled on the Irpinia
Antithetic fault, but there is uncertainty relating to the source responsible for this event; if the rupture occurred
instead on the southern section of the Irpinia main fault, the mean CST is positive (2.19 bars, this alternative
is shown with a yellow circle in Fig. 2b). Consequently, the pre-stress on the Irpinia fault prior to the Mw 6.8
earthquake in 1980 would be 2.92 bars (blue dot in Fig. 2b), 0.3 bar lower than it would be in the alternative sce-
nario. Thus, after 1692 A.D., using the cumulative CST values produced by summed coseismic, postseismic and
interseismic CST, all the earthquakes may have occurred on faults with positive mean CST values, even though
up to ~ 30% of the faults had negative mean CST values. Note that if only coseismic stresses are considered,
Coulomb stress values are − 4.0 to 1.5 bars, with 8 of the earthquakes occurring on faults with negative values,
and with no obvious spatial pattern to the earthquake recurrence (Supplementary Video 2; Supplementary Data
1b). Hence studying the cumulative CST appears to provide a better explanation of the historical sequence than
studying coseismic CST alone, in agreement with previous work in the central Apennines10.
Secondly, the 1694 A.D. Mw 6.73 earthquake occurred on the Irpinia fault which had the highest mean CST
pre-stress (2.83 bars) of all the faults at that time (Fig. 2b,ii), with second highest value of 3.22 bars for the 1980
Mw 6.81 earthquake on the Irpinia fault (Fig. 2b,iv), exceeded at that time only by the value for the Monte Alpi
fault (3.38 bars). The Irpinia fault is notable because it has no other known active faults across strike (Fig. 1b).
Other earthquakes occurred on faults that were not the most positively-stressed at those times (Fig. 2b), and all
those occurred on faults that have active faults across strike (Fig. 1b), or the earthquakes were < Mw 5.86 (e.g.
the Mercure fault; Supplementary Data 1a).
Thus, to investigate if the presence or absence of another active fault(s) across strike has an effect on stress
build-up and release we examine the progressive accumulation of pre-stress CST values before other major
earthquakes (Mw > 5.86) for a variety of fault location geometries (e.g. 2 faults across strike; 1561, Mw 6.72, Vallo
di Diano fault; 1857, Mw 7.12, Val d’Agri fault; 1 fault across strike; 1980, Mw 6.81, Irpinia fault; no historical
earthquake, Pollino fault). We have excluded other large magnitude earthquakes if they occurred early in the
time considered (e.g. 1456, Mw 7.1, Boiano fault), or if there is scarce information on the location and geometry
of the fault that ruptured (e.g. 1688, Mw 7.06, possibly on the Benevento fault). In particular, we have compiled
results that constrain the history of cumulative CST through time across the entire fault surfaces (Fig. 3ai–iv),
Scientific Reports | (2020) 10:12724 | https://doi.org/10.1038/s41598-020-69681-w 5
Vol.:(0123456789)www.nature.com/scientificreports/
Figure 4. Analysis of Coulomb pre-stress heterogeneity on faults. (a) Magnitudes and timings of the historical
earthquakes occurring since 1349 A.D.; coloured dots show earthquakes occurring on Irpinia fault, Val d’Agri
fault and Vallo di Diano fault (note there were no known M > 5.5 earthquakes on the Pollino fault during the
shown time period). (b) Percentage of positively stressed elements across the whole fault surface, calculated
prior to each historical earthquake. (c) Percentage of positively stressed elements calculated at 7 km depth. (d)
Percentage of positively stressed elements calculated at 15 km depth. Black lines represent the mean percentage
over time; the grey area is one standard deviation. Orange circles indicate partial ruptures; red circles represent
total ruptures of the whole fault surface. Where more than one fault exists across strike, the range of values for
the percentage of positively stressed elements is wider.
and at different depths on the faults (Fig. 3bi–iv and Fig. 3ci–iv), and also the spatial distribution and percentage
of positively and negatively stressed elements of the faults through time (Figs. 2d and 4). Since there is uncer-
tainty relating to the depth of the seismogenic layer, alternate scenarios were explored (e.g. shear zone depth of
12–24 km rather than 15–24 km), but these showed no impact on the patterns of variations through time in the
stress loading, except for a general increase in the mean stress across the faults.
The spatial distribution of positively and negatively stressed elements across faults at the time they rupture in
earthquakes with Mw > 6.7 is complex, with patches of positive and negative stress concentrated at corrugations
on the fault surfaces (evidenced by a change in strike at the surface scarp), and also in locations where there are
neighbouring faults in close proximity (Fig. 2d).
In general, mean CST values across entire fault surfaces increase over time until they rupture in earthquakes
(Fig. 3a). However, where only one fault exists across strike, the increase in Coulomb stress over time occurs at
a relatively steady rate (Fig. 3ai,iv), dominated by the steady rate of loading from underlying shear zones, that
mimics the steady rate of loading from tectonics and body forces11. In contrast, where more than one fault exists
across strike, the increase through time is less steady, with decreases and increases in mean CST produced by
earthquakes on neighbouring faults that enhance or counteract the effect of loading from underlying shear zones
(see dashed boxes in Fig. 3aii,iii). A similar pattern emerges if the mean CST value is sampled only from narrow
depth ranges (Fig. 3b,c).
In terms of the spatial variation in CST values across faults, earthquakes on the Irpinia, Val d’Agri and Vallo di
Diano faults occurred when most of the fault surface was positively stressed (75–95%; Fig. 4b). However, there is
a clear difference between faults with respect to the range and standard deviation for the percentage of elements
with positive CST values when averaged over the time period 1456–1998 A.D., both over the whole fault surfaces
(Fig. 4b), or over different depth portions of the fault surfaces (Fig. 4c,d). For the Irpinia fault, where only one
fault exists across strike, 97 ± 3% of the elements over the whole fault surface have positive stress averaged over
1456–1998 A.D. (Fig. 4bi); the value is 98 ± 0%, for the Pollino fault which also has no other fault across strike
(Fig. 4biv). In cases where two faults exist across strike, values are 88 ± 12% and 87 ± 10% (Val d’Agri and Vallo
di Diano faults respectively). Similar patterns emerge for samples at different depths (Fig. 4c,d). Furthermore,
the Irpinia fault had 95% of its whole fault surface positively stressed when it ruptured in both the Mw 6.73 1694
A.D and Mw 6.81 1980 A.D. earthquakes, whilst only 82% of the elements were positively stressed on the Vallo
di Diano fault when it ruptured in Mw 6.72 1561 A.D. earthquake (although this was early in the model history),
and 95% of the elements positively stressed in the Mw 7.12 1857 A.D. earthquake on the Val d’Agri fault. Partial
Scientific Reports | (2020) 10:12724 | https://doi.org/10.1038/s41598-020-69681-w 6
Vol:.(1234567890)www.nature.com/scientificreports/
rupture occurs with variable values for the percentage of elements with positive stress (75–95%; e.g. 75% for the
Mw 5.74, 1826 A.D., Val d’Agri fault).
Furthermore, whilst the Irpinia and Pollino faults experienced a narrow range of values of 92–100% and
98% respectively of elements with positive CST at the times of historical earthquakes, the Val d’Agri and Vallo
di Diano faults experienced a wider range, with values of 71–100% and 67–98% respectively (Fig. 4b). Similar
observations can be made for the calculated percentage of positively stressed elements at 7 km depth (Fig. 4c).
The range for the Irpinia fault is 88–100% and 96% for the Pollino fault; the Val d’Agri and Vallo di Diano exhibit
a range of 67–100% and 42–100% respectively. However, looking at 15 km depth, the Irpinia, Val d’Agri and Pol-
lino faults show a percentage of positively stressed elements that remain constant at 100% through time (Fig. 4d),
due to the fact that the interseismic loading from a fault’s shear zone at depth overwhelms stress transfer between
neighbouring fault/shear-zone structures at this depth. Only the Vallo di Diano fault shows a range of 74–98%,
as a result of the effects of the Mw 7.1 1857 A.D. earthquake on the Val d’Agri fault.
Together, the results on the percentage of elements with positive CST values show that (1) CST values are spa-
tially smooth where only one fault exists across strike with more spatial variation where two or more faults exist
across strike, and (2) earthquakes can occur even when the entire fault surface has not accumulated positive CST,
but the range of values when earthquakes occur appears to be smaller where only one fault exists across strike.
Examination of CST through time shows that these observations, (1) and (2), are due to the proximity of fault/
shear-zone structures across strike and the stress reductions they produce when the faults rupture in earthquakes
(Fig. 2d; Supplementary Video 1). The effect of this is particularly clear where we have been able to isolate the
effects of regional loading from underlying shear zones and local loading due to across-strike fault interaction,
that is, for the case of the Irpinia fault where this structure is the only active fault across strike. As noted above, for
two out of 25 historical events, both on the Irpinia fault, the fault that ruptured was characterised by essentially
the highest CST pre-stress (Fig. 2b). We argue that this is due to the fact that there are no faults across strike to
produce stress reductions and hence small patches of reduced stress are rare, and when they do form they only
cover < 6% of the Irpinia fault (Figs. 2b, 3, 4). This observation may explain why the two earthquakes in 1694
and 1980 A.D. are known as so-called “twin events”, as they share overlapping damage distributions and similar
magnitudes35, and show similar coseismic offsets in palaeoseismological t renches36. Our results show that they
also share similar values for the mean cumulative CST when they occurred (~ 3 bars), both for the whole fault
surface, and at specific depths (~ 1.5 bars at 7 km and ~ 16 bars at 15 km, Fig. 3), an equal percentage of fault
surface positively stressed before the events (95% for both earthquakes; Fig. 4), and a similar values of maximum
CST on an individual element of the fault surface, ~ 28.9 before the 1694 event and ~ 26.5 before the 1980 event
(Supplementary Data 1c).
Overall, our results suggest that clear patterns emerge in the histories of stress-loading to failure in earth-
quakes for faults if cumulative CST is studied (summed coseismic, postseismic and interseismic stresses) and
that CST is influenced by the geometry of the fault/shear-zone system.
Discussion
In order to perform probabilistic forecasts of the propensity for particular faults to rupture in the future, and
hence mitigate for the hazard, it is essential to include information on how faults behave and interact through
time. Efforts on this topic have highlighted alternative v iews9 where earthquake recurrence is considered to be
either a random Poisson process where there is no memory in the system with regard to previous earthquakes8,
or a time-dependent process where the probability of occurrence of given earthquake magnitudes, and the slope
of fault specific frequency-magnitude curves, are computed for each source fault using, for example, Brownian
passage time or Weibull distributions37–39. Our study strongly supports the notion that there is a time-dependent
process influenced by fault geometry, in that stress-loading to failure occurs through far-field tectonic loading and
near-field interactions between faults. One key observation is that faults dominated by regional loading, without
loading due to across-strike interaction, have stress-loading to failure histories that differ from those affected by
across strike interaction. We highlight the question of whether it could be that the seismicity on such isolated
faults differs from that on faults with across-strike interactions, and have presented some limited observations
in support of this from the occurrence of so-called “twin earthquakes” on the Irpinia f ault35. Whether these
interactions produce differences in fault behaviour and seismicity may be tested with earthquake simulators that
produce synthetic earthquake catalogues, based on modelling of fault interaction in complex fault n etworks40.
However, a second key observation is that our results suggest that such simulations should include cumulative
CST that, as has been achieved here, includes coseismic, postseismic and interseismic loading and the influence
of underlying shear zones, not just slip on faults in the seismogenic layer. Moreover, our results show that it is
important to choose appropriate samples of the depth variation in CST on faults in such simulations. We show
that the base of the seismogenic layer (15 km in our models) appears to have stress-loading histories that are
less affected by across strike interaction in the long-term, because stress increases quasi-linearly through time
(Fig. 3), with less spatial variation in stress (Fig. 4d); this is because at that depth stress changes due to across-
strike interaction are in some instances overwhelmed by stress changes due to interseismic loading produced
by slip on shear zones at depth. In contrast, at a depth of 7 km stress-loading histories are more complex, with
stress reduction due to across-strike interaction (Fig. 3), and a greater degree of spatial variation (Fig. 4c); at
these depths stress reductions may serve as stress barriers that limit/delay rupture p ropagation24,41, and perhaps
even control the propensity for the fault to rupture in a variety of earthquake magnitudes rather than a single
so-called characteristic earthquake m agnitude42. Overall, this study has isolated the effects of regional tectonic
stress-loading and stress-loading due to across-strike fault interaction and shown that this approach provides
new insights into how faults behave for studies of seismic hazard and continental deformation.
Scientific Reports | (2020) 10:12724 | https://doi.org/10.1038/s41598-020-69681-w 7
Vol.:(0123456789)www.nature.com/scientificreports/
Methods
Modelling 3D strike‑variable faults. Twenty-five faults in the Southern Apennines have been modelled
with realistic variable geometries that were measured in the field, since it has been shown that CST is most sensi-
tive to variations in strike of the receiver faults, compared to variations of dip and r ake22. The method used to
build strike-variable fault planes is described in detail in r eference22. Fault traces, based on detailed fieldwork
and Google Earth satellite imagery, are used to project the fault plane to depth. Faults are then modelled by
discretising the fault plane in 1 km rectangular elements; the Coulomb stress changes are calculated for each
element. The CST calculations are performed in the Coulomb 3.4 s oftware43.
Modelling historical coseismic and interseismic CST. We modelled 25 historical earthquakes, occur-
ring on 16 faults, following the methodology described in reference10. We have included three earthquakes that
occurred in Molise-North Campania, in the northern section of the study area, which have been previously
modelled10. All the earthquakes are modelled with relatively simple, concentric slip distributions, since there is
no detailed information for historical earthquakes. Thus, it is assumed that the coseismic slip is maximum in the
centre of the fault and zero at the base of the seismogenic layer. To model the interseismic CST, shear zones are
built from 15–24 km depth, as a continuation of the brittle portion of the faults. The depth chosen for the brittle/
viscous transition is consistent with hypocentral depths and coseismic slip in the Apennines44–46, and consistent
with previous m odelling10,11. The annual rate of slip is calculated using the Holocene throws measured at surface,
using new data and data from previous works10,14,18,19,25–27. A triangular profile is assumed for the interseismic
slip distribution, by linearly interpolating between the values of slip-rate measured at the surface, and thereafter
decreased to zero at the tips. The interseismic CST prior to each earthquake is calculated by multiplying the
annual rate of slip and stress transfer by the number of years between two subsequent earthquakes.
Calculating cumulative CST. The Italian catalogue of historical seismicity is considered complete since
1349 A.D.20. Thus, we start the model with zero stress prior to this date, since information on previous events
are insufficient. To calculate the cumulative CST prior to each earthquake, the coseismic CST and interseismic
CST are summed for each element constituting a fault plane. When an earthquake occurs, all the stress accumu-
lated is released, so that the stress on the fault rupturing drops to zero. We allow the model to spin-up between
1349–1692 A.D., and do not analyse the data until after this time, to counteract the effect of our simplification
where we assign CST as zero at 1349 A.D..
Comparing cumulative CST and stress heterogeneity. To investigate the importance of geometry
for stress heterogeneity, we compare the cumulative CST calculated prior to each historical earthquake for faults
located across-strike from each other (VA, VD) and faults with no faults across strike (IRP, POL). The mean
cumulative CST is calculated for the whole fault surface and at specific depths (7 km, 15 km), by calculating the
mean stress for all the elements constituting 1 km of the fault surface in the downdip direction. To further inves-
tigate and compare the behaviour of across-strike and isolated faults, we calculated the percentage of positively
stressed elements prior to each event both across the whole fault surface and at specific depths (7 km, 15 km).
Data availability
All data generated during this study are included in the Supplementary Data files.
Received: 19 May 2020; Accepted: 15 July 2020
References
1. King, G. C., Stein, R. S. & Lin, J. Static stress changes and the triggering of earthquakes. Bull. Seismol. Soc. Am. 84, 935–953 (1994).
2. Dieterich, J. A constitutive law for rate of earthquake production and its application to earthquake clustering. J. Geophys. Res. Solid
Earth 99, 2601–2618 (1994).
3. Harris, R. A., Simpson, R. W. & Reasenberg, P. A. Influence of static stress changes on earthquake locations in southern California.
Nature 375, 221–224 (1995).
4. Dawers, N. H. & Anders, M. H. Displacement-length scaling and fault linkage. J. Struct. Geol. 17, 607–614 (1995).
5. Jackson, C. A. L., Gawthorpe, R. L. & Sharp, I. R. Growth and linkage of the East Tanka fault zone, Suez rift: Structural style and
syn-rift stratigraphic response. J. Geol. Soc. 159, 175–187 (2002).
6. Schlische, R. W., Young, S. S., Ackermann, R. V. & Gupta, A. Geometry and scaling relations of a population of very small rift-
related normal faults. Geology 24, 683–686 (1996).
7. Cowie, P. A. & Roberts, G. P. Constraining slip rates and spacings for active normal faults. J. Struct. Geol. 23, 1901–1915 (2001).
8. Reiter, L. Earthquake hazard analysis: Issues and insights (Columbia University Press, Columbia, 1990).
9. Main, I. Statistical physics, seismogenesis, and seismic hazard. Rev. Geophys. 34, 433–462 (1996).
10. Mildon, Z. K., Roberts, G. P., Walker, J. F. & Toda, S. Coulomb pre-stress and fault bends are ignored yet vital factors for earthquake
triggering and hazard. Nat. Commun. 10, 1–9 (2019).
11. Cowie, P. A., Scholz, C. H., Roberts, G. P., Walker, J. F. & Steer, P. Viscous roots of active seismogenic faults revealed by geologic
slip rate variations. Nat. Geosci. 6, 1036–1040 (2013).
12. Hirth, G., Teyssier, C. & Dunlap, J. W. An evaluation of quartzite flow laws based on comparisons between experimentally and
naturally deformed rocks. Int. J. Earth Sci. 90, 77–87 (2001).
13. Cavinato, G. P. & Celles, P. D. Extensional basins in the tectonically bimodal central Apennines fold-thrust belt, Italy: Response
to corner flow above a subducting slab in retrograde motion. Geology 27, 955–958 (1999).
14. Roberts, G. P. & Michetti, A. M. Spatial and temporal variations in growth rates along active normal fault systems: An example
from The Lazio-Abruzzo Apennines, central Italy. J. Struct. Geol. 26, 339–376 (2004).
15. Barchi, M., Amato, A., Cippitelli, G., Merlini, S. & Montone, P. Extensional tectonics and seismicity in the axial zone of the Southern
Apennines. Boll. Soc. Geol. It. Spec. Issue 7, 47–56 (2007).
Scientific Reports | (2020) 10:12724 | https://doi.org/10.1038/s41598-020-69681-w 8
Vol:.(1234567890)www.nature.com/scientificreports/
16. E. Guidoboni, et al. CFTI5Med, Catalogo dei Forti Terremoti in Italia (461 a.C.-1997) e nell’area Mediterranea (760 a.C.-1500).
INGV https://storing.ingv.it/cfti/cfti5/ (2018)
17. Devoti, R. et al. A combined velocity field of the Mediterranean region. Ann. Geophys. 60, 1 (2017).
18. Papanikolaou, I. D. & Roberts, G. P. Geometry, kinematics and deformation rates along the active normal fault system in the
southern Apennines: Implications for fault growth. J. Struct. Geol. 29, 166–188 (2007).
19. Faure Walker, J. P. et al. Relationship between topography, rates of extension and mantle dynamics in the actively-extending Italian
Apennines. Earth Planet. Sci. Lett. 325, 76–84 (2012).
20. Michetti, A. M., Brunamonte, F., Serva, L. & Vittori, E. Trench investigations of the 1915 Fucino earthquake fault scarps (Abruzzo,
Central Italy): Geological evidence of large historical events. J. Geophys. Res. Solid Earth 101, 5921–5936 (1996).
21. Nostro, C., Stein, R. S., Cocco, M., Belardinelli, M. E. & Marzocchi, W. Two-way coupling between Vesuvius eruptions and southern
Apennine earthquakes, Italy, by elastic stress transfer. J. Geophys. Res. Solid Earth 103, 24487–24504 (1998).
22. Mildon, Z. K., Toda, S., Faure Walker, J. P. & Roberts, G. P. Evaluating models of Coulomb stress transfer: Is variable fault geometry
important?. Geophys. Res. Lett. 43, 12407–12414 (2016).
23. Wedmore, L. N. J. et al. A 667 year record of coseismic and interseismic Coulomb stress changes in central Italy reveals the role
of fault interaction in controlling irregular earthquake recurrence intervals. J. Geophys. Res. Solid Earth 122, 5691–5711 (2017).
24. Mildon, Z. K., Roberts, G. P., Faure Walker, J. P. & Iezzi, F. Coulomb stress transfer and fault interaction over millennia on non-
planar active normal faults: the Mw 6.5–5.0 seismic sequence of 2016–2017, central Italy. Geophys. J. Int. 210, 1206–1218 (2017).
25. Papanikolaou, I. D., Roberts, G. P. & Michetti, A. M. Fault scarps and deformation rates in Lazio-Abruzzo, Central Italy: Com-
parison between geological fault slip-rate and GPS data. Tectonophysics 408, 147–176 (2005).
26. Faure Walker, J. P. Mechanics of continental extension from Quaternary strain fields in the Italian Apennines (University College
London, London, 2010).
27. Sgambato, C., Walker, J. P. F. & Roberts, G. P. Uncertainty in strain-rate from field measurements of the geometry, rates and kin-
ematics of active normal faults: Implications for seismic hazard assessment. J. Struct. Geol. 131, 103934 (2020).
28. Ellis, S. & Stöckhert, B. Elevated stresses and creep rates beneath the brittle-ductile transition caused by seismic faulting in the
upper crust. J. Geophys. Res. Solid Earth 109, 1 (2004).
29. Nostro, C., Piersanti, A. & Cocco, M. Normal fault interaction caused by coseismic and postseismic stress changes. J. Geophys. Res.
Solid Earth 106, 19391–19410 (2001).
30. Verdecchia, A. et al. The role of viscoelastic stress transfer in long-term earthquake cascades: Insights after the central Italy
2016–2017 seismic sequence. Tectonics 37, 3411–3428 (2018).
31. Harris, R. A. & Simpson, R. W. Changes in static stress on southern California faults after the 1992 Landers earthquake. Nature
360, 251–254 (1992).
32. Kanamori, H. & Anderson, D. L. Theoretical basis of some empirical relations in seismology. Bull. Seismol. Soc. Am. 65, 1073–1095
(1975).
33. Toda, S., Stein, R. S., Reasenberg, P. A., Dieterich, J. H. & Yoshida, A. Stress transferred by the 1995 Mw= 6.9 Kobe, Japan, shock:
Effect on aftershocks and future earthquake probabilities. J. Geophys. Res. Solid Earth 103, 24543–24565 (1998).
34. Lorenzo-Martín, F., Roth, F. & Wang, R. Elastic and inelastic triggering of earthquakes in the North Anatolian Fault zone. Tec-
tonophysics 424, 271–289 (2006).
35. Serva, L. Il terremoto del 1694 in Irpinia e Basilicata. In Contributo alla caratterizzazione della sismicità del territorio Italiano, CNR,
Convegno annuale Geodinamica, Udine 183–208 (1981).
36. Galli, P. & Peronace, E. New paleoseismic data from the Irpinia Fault A different seismogenic perspective for southern Apennines
(Italy). Earth-Sci. Rev. 136, 175–201 (2014).
37. Matthews, M. V., Ellsworth, W. L. & Reasenberg, P. A. A Brownian model for recurrent earthquakes. Bull. Seismol. Soc. Am. 92,
2233–2250 (2002).
38. Zoller, G. & Hainzl, S. Recurrence time distributions of large earthquakes in a stochastic model for coupled fault systems: the role
of fault interaction. Bull. Seismol. Soc. Am. 97, 1679–1687 (2007).
39. Pace, B., Visini, F. & Peruzza, L. FiSH: MATLAB tools to turn fault data into seismic-hazard models. Seismol. Res. Lett. 87, 374–386
(2016).
40. Gerstenberger, M. C. et al. Probabilistic seismic hazard analysis at regional and national scale: state of the art and future challenges.
Rev. Geophys. 58, 1 (2020).
41. Steacy, S. J. & McCloskey, J. What controls an earthquake’s size? Results from a heterogeneous cellular automaton. Geophys. J. Int.
133, F11–F14 (1998).
42. Schwartz, D. P. & Coppersmith, K. J. Fault behavior and characteristic earthquakes: Examples from the Wasatch and San Andreas
fault zones. J. Geophys. Res. Solid Earth 89, 5681–5698 (1984).
43. Toda, S., Stein, R. S., Richards-Dinger, K. & Bozkurt, S. B. Forecasting the evolution of seismicity in southern California: Anima-
tions built on earthquake stress transfer. J. Geophys. Res. Solid Earth 110, 1 (2005).
44. Chiarabba, C., Jovane, L. & DiStefano, R. A new view of Italian seismicity using 20 years of instrumental recordings. Tectonophysics
395, 251–268 (2005).
45. Frepoli, A., Maggi, C., Cimini, G. B., Marchetti, A. & Chiappini, M. Seismotectonic of Southern Apennines from recent passive
seismic experiments. J. Geodyn. 51, 110–124 (2011).
46. Chiaraluce, L., Valoroso, L., Piccinini, D., Di Stefano, R. & De Gori, P. The anatomy of the 2009 L’Aquila normal fault system (central
Italy) imaged by high resolution foreshock and aftershock locations. J. Geophys. Res. Solid Earth 116, 1 (2011).
47. Roberts, G. P. Fault orientation variations along the strike of active normal fault systems in Italy and Greece: Implications for
predicting the orientations of subseismic-resolution faults in hydrocarbon reservoirs. AAPG Bull. 91, 1–20 (2007).
Acknowledgements
This work was supported by a Natural Environment Research Council studentship (Grant number NE/
L002485/1) to Claudia Sgambato.
Author contributions
C.S. undertook the Coulomb stress modelling; Z.M. developed the approach to modelling strike-variable faults;
C.S., J.F.W. and G.R. collected new field data; all authors interpreted the results of the stress modelling. All authors
contributed to conceptualisation, writing and revising of the manuscript.
Competing interests
The authors declare no competing interests.
Additional information
Supplementary information is available for this paper at https://doi.org/10.1038/s41598-020-69681-w.
Scientific Reports | (2020) 10:12724 | https://doi.org/10.1038/s41598-020-69681-w 9
Vol.:(0123456789)www.nature.com/scientificreports/
Correspondence and requests for materials should be addressed to C.S.
Reprints and permissions information is available at www.nature.com/reprints.
Publisher’s note Springer Nature remains neutral with regard to jurisdictional claims in published maps and
institutional affiliations.
Open Access This article is licensed under a Creative Commons Attribution 4.0 International
License, which permits use, sharing, adaptation, distribution and reproduction in any medium or
format, as long as you give appropriate credit to the original author(s) and the source, provide a link to the
Creative Commons license, and indicate if changes were made. The images or other third party material in this
article are included in the article’s Creative Commons license, unless indicated otherwise in a credit line to the
material. If material is not included in the article’s Creative Commons license and your intended use is not
permitted by statutory regulation or exceeds the permitted use, you will need to obtain permission directly from
the copyright holder. To view a copy of this license, visit http://creativecommons.org/licenses/by/4.0/.
© The Author(s) 2020
Scientific Reports | (2020) 10:12724 | https://doi.org/10.1038/s41598-020-69681-w 10
Vol:.(1234567890)You can also read