Amino acids determining enzyme-substrate specificity in prokaryotic and eukaryotic protein kinases
←
→
Page content transcription
If your browser does not render page correctly, please read the page content below
Amino acids determining enzyme-substrate specificity
in prokaryotic and eukaryotic protein kinases
Lewyn Li*†, Eugene I. Shakhnovich*‡, and Leonid A. Mirny†
*Department of Chemistry and Chemical Biology, Harvard University, 12 Oxford Street, Cambridge, MA 02138; and †Harvard–MIT, Division of Health
Sciences and Technology, Massachusetts Institute of Technology, 77 Massachusetts Avenue, Cambridge, MA 02139
Edited by Harold A. Scheraga, Cornell University, Ithaca, NY, and approved February 19, 2003 (received for review December 16, 2002)
The binding between a PK and its target is highly specific, despite
the fact that many different PKs exhibit significant sequence and
structure homology. There must be, then, specificity-determining
residues (SDRs) that enable different PKs to recognize their unique
substrate. Here we use and further develop a computational
procedure to discover putative SDRs (PSDRs) in protein families,
whereby a family of homologous proteins is split into orthologous
proteins, which are assumed to have the same specificity, and
paralogous proteins, which have different specificities. We reason
that PSDRs must be similar among orthologs, whereas they must
necessarily be different among paralogs. Our statistical procedure
and evolutionary model identifies such residues by discriminating
a functional signal from a phylogenetic one. As case studies we
investigate the prokaryotic two-component system and the eu-
karyotic AGC (i.e., cAMP-dependent PK, cGMP-dependent PK, and
PKC) PKs. Without using experimental data, we predict PSDRs in
prokaryotic and eukaryotic PKs, and suggest precise mutations that
may convert the specificity of one PK to another. We compare our
predictions with current experimental results and obtain consid-
erable agreement with them. Our analysis unifies much of existing
data on PK specificity. Finally, we find PSDRs that are outside the
active site. Based on our results, as well as structural and biochem-
ical characterizations of eukaryotic PKs, we propose the testable
hypothesis of ‘‘specificity via differential activation’’ as a way for
the cell to control kinase specificity.
P hosphorylation is central to signal transduction in living
organisms, and PKs perform the vital task of phosphorylat-
BIOCHEMISTRY
ing a substrate. Approximately 2% of the eukaryotic genome
codes for PKs (1), and the current estimate is that there are 518
different PKs in the human genome (2–4). In bacteria and
archaea, ⬎400 histidine PKs (HPKs) have been identified, and
they serve a wide range of functions, including chemotaxis,
osmoregulation, and nitrogen metabolism (5–8). HPK, with its
cognate response regulator (RR) protein, constitutes the pro- Fig. 1. The prokaryotic two-component system and its PSDRs. The x-ray struc-
totypical two-component system (9). The HPK consists of two ture (19) of the dimerized catalytic domains (red and cyan), their DDs (red and
cyan helices in the center) and the receiver domain of the RR (blue and magenta).
modules: the highly variable sensing domain and the conserved
The PSDRs are shown as space-filling molecules and are colored the same as the
kinase core (9). The kinase core has two parts (Fig. 1): the chain in which they occur. A His-30 –Asp-54 pair involved in phosphotransfer are
catalytic domain and the dimerization domain (DD). The cat- shown in the yellow space-filling model. (a) Side view. Note the contacts between
alytic domain hydrolyzes ATP and transfers the phosphate to a PSDRs of the DDs and PSDRs of corresponding RRs (red and magenta, blue and
conserved His in the DD. The RR protein can also be separated cyan). (b) Top view. Note the contacts between PSDRs of the DDs. Presumably,
into two moieties: the receiver and the effector domain. The these interactions are responsible for correct dimerization. Numerous interacting
receiver domain has an ␣– Rossman fold that is highly con- PSDRs also surround the His-30 –Asp-54 site.
served (blue and magenta in Fig. 1a), whereas the effector
domain differs structurally from one system to the next (9). An
Asp on the receiver domain accepts the phosphate from the His In eukaryotes, PKs are classified into eight main groups (2,
on the DD. The transfer of phosphate triggers the effector 11). Most of them are involved in signal transduction (12–14). In
domain, which then binds on to DNA to activate or repress the this paper, we focus on the cAMP-dependent PK, cGMP-
appropriate genes (9). In summary, the phosphate is passed from
the DD to the receiver domain of the RR. The only known
exception is the chemotactic two-component system, where the This paper was submitted directly (Track II) to the PNAS office.
phosphate is passed, not from the DD, but from a histidine- Abbreviations: SDR, specificity-determining residues; PSDR, putative SDR; HPK, histidine
PK; DD, dimerization domain; RR, response regulator; AGC, cAMP-dependent PK, cGMP-
containing phosphotransfer domain, to the receiver domain of dependent PK, and PKC; GRK, G protein-coupled receptor kinase; MSA, multiple sequence
the RR (10). Therefore, in this work, we have eliminated the alignment.
Downloaded by guest on August 20, 2021
chemotactic proteins, and we will refer to the receiver domain of ‡To whom correspondence should be addressed. E-mail: shakhnovich@chemistry.
a RR protein simply as ‘‘RR.’’ harvard.edu.
www.pnas.org兾cgi兾doi兾10.1073兾pnas.0737647100 PNAS 兩 April 15, 2003 兩 vol. 100 兩 no. 8 兩 4463– 4468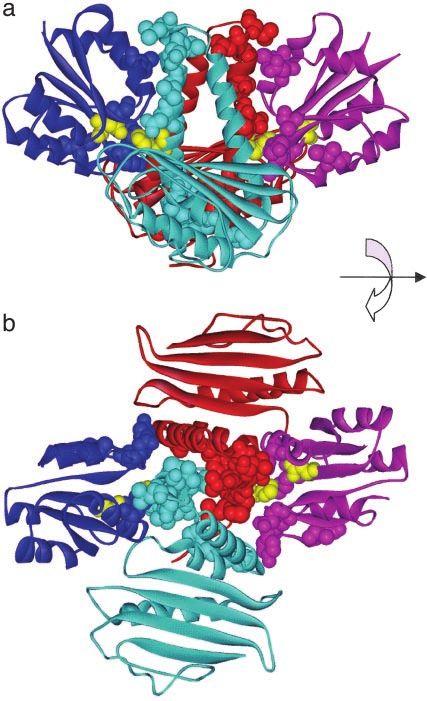
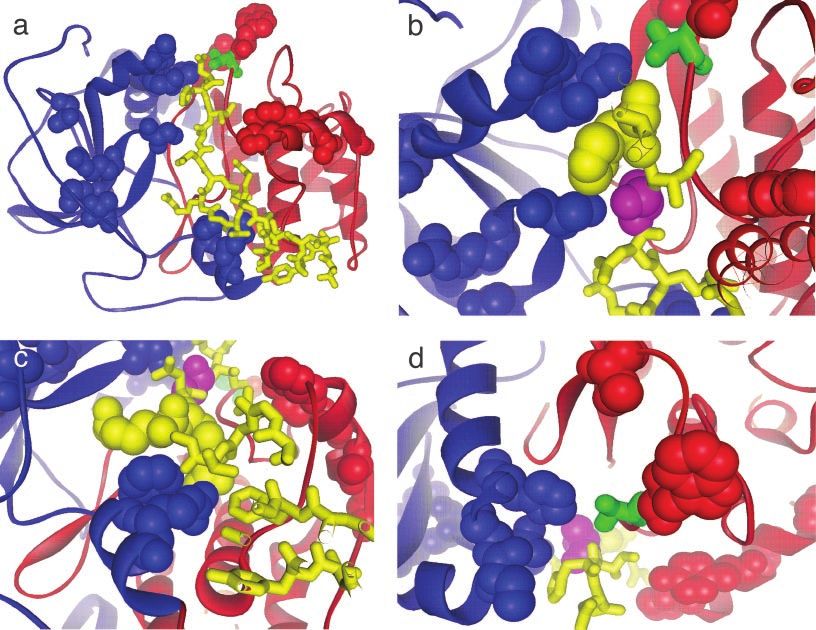
Fig. 2. The eukaryotic PK in the AGC group and its PSDRs. (a) The two-lobe structure of PKA (22) with PSDRs shown by space-fill. The two lobes are red and blue,
                                         respectively. The inhibitor substrate (yellow) lies between the lobes. Phospho-Thr-197 is green. (b) PSDRs are as follows: Lys-83, Gln-84, His-87 (blue, upper) Ser 53 (blue,
                                         lower) of the PKA and His-23 (yellow) of the inhibitor. Ala-21 (magenta) is the P site. His-23 is the P ⫹ 2 site. (c) Phe-129 and Arg-133 (blue) of the PKA, and Arg-18 and
                                         Arg-19 on the inhibitor (yellow). The P site is magenta. Arg-18 and Arg-19 correspond to P⫺ 3 and P ⫺ 2, respectively. (d) PSDRs Val-191 (red, upper), Tyr-196 (red), Lys-83,
                                         and His-87 (blue). Phospho-Thr-197 is green. His-23 and Asp-24 (yellow) are the closest substrate residues to Tyr-196, but are clearly not in contact with Tyr-196.

                                         dependent PK, and PKC (AGC) group of Ser兾Thr PKs. The                                    Finally, the active site of a PK may have evolved to accept only
                                         AGC group contains PKs such as cAMP-dependent PK (PKA),                                  the appropriate substrates. Much work has been done by using
                                         PKC, PKs related to PKA and PKC (RAC), G protein-coupled                                 peptide libraries (16–18) and x-ray crystallography (19, 22) to
                                         receptor kinase (GRK), ribosomal S6 PK, and the PVPK1 PK                                 elucidate kinase–substrate interactions. Nevertheless, given the
                                         homologs in plants (4). The catalytic subunit of PKA is the best                         size of a typical PK (⬇300 aa), it is difficult to know, a priori, the
                                         studied member of the AGC group (12). It has the typical                                 PK residues that are responsible for specificity. Locating these
                                         ‘‘two-lobe’’ structure (Fig. 2a) that is conserved among Ser兾                            specificity-determining residues (SDRs) experimentally is labor-
                                         Thr兾Tyr PKs (15). The active cleft, where the substrate binds,                           intensive and time-consuming (23).
                                         lies between the two lobes (Fig. 2a). A general recognition motif                           To alleviate this problem, we have recently developed a
                                         exists among most PKA substrates (12, 16, 17). Interestingly,                            bioinformatics approach to find putative SDRs (PSDRs) and
                                         PKA must itself be phosphorylated on Thr-197 for the enzyme                              applied it to bacterial transcription factors (24). Our method
                                         to be fully active (12).                                                                 consists of two steps. First, computational analyses locate resi-
                                            One of the most remarkable properties of PKs is their                                 dues that exhibit specific conservation signatures. Second, sta-
                                         specificity. For example, despite the highly conserved two-lobe                          tistical analyses distinguish such signatures from phylogenetic
                                         fold and sequence, different Ser兾Thr PKs recognize different                             signals and position-specific conservation. In this work, we look
                                         consensus sequences in their substrates (16–18). In this work, the                       for specific amino acids that are conserved within a family but
                                         average sequence similarity is 63% among the Ser兾Thr PKs. The                            vary across families in a multiple sequence alignment (MSA) of
                                         two-component system in prokaryotes is another good example.                             PKs. An important strength of our approach is its ability to
                                         An HPK phosphorylates only its cognate RR, and HPK-RR                                    predict a relatively small number of PSDRs, which can then be
                                         pairs for different functions usually do not crosstalk, even when                        tested by point mutations (24).
                                         all RRs share the same fold (19, 20).                                                       In this paper, we predict the PSDRs in prokaryotic and
                                            How do PKs achieve such exquisite substrate specificity?                              eukaryotic PKs. By comparing our predictions with experiments,
                                         There are several possible strategies. First, different PKs may be                       we are now able to understand existing data on kinase specificity
                                         localized in distinct regions of a cell, or in different cell types.                     in a unified framework. Furthermore, we pinpoint specific
                                         The GRKs are prime examples of this localization. Of the six                             mutations that may convert the substrate specificity of a PK to
                                         families of GRKs, it seems that GRKs 1–3 are mostly cytosolic,                           another. Finally, we investigate the PSDRs outside the kinase
                                         but GRKs 4–6 are tightly bound to the cell membrane (14).                                active site. In particular, we focus on two residues, Val-191 and
                                         Second, cofactor binding can selectively activate a PK toward its                        Trp-196 in PKA. We propose that different residues at positions
Downloaded by guest on August 20, 2021

                                         substrates. The best characterized case is cyclin-dependent ki-                          191 and 196 may influence kinase specificity by controlling
                                         nase, whose activity is controlled by its cyclin partner (21).                           Thr-197 phosphorylation. We call this concept ‘‘specificity via

                                         4464 兩 www.pnas.org兾cgi兾doi兾10.1073兾pnas.0737647100                                                                                                                  Li et al.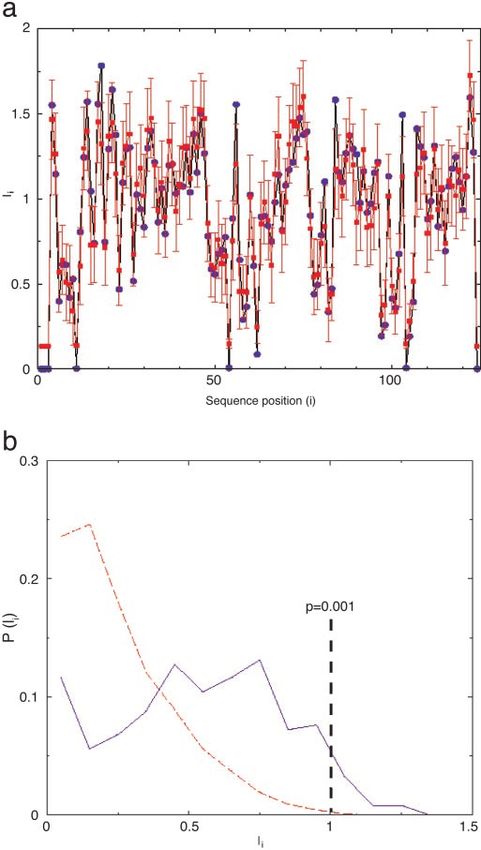
Table 2. PSDRs and their identities among prokaryotic
two-component systems: RR
Sequence position in Sp0F*
18 56 84 90 103 107
†
Ii 1.78 1.55 1.58 1.26 1.49 1.41
Family‡
PhoB M兾L M R兾K R兾K T S
BaeR L兾I M兾K K兾L R兾K C兾V S兾N
CreB T G R R A兾V S
KdpE F G R K T G
Fig. 3. An illustrative example of how to locate PSDRs from an alignment. PhoP H G R K T H
The red column has high mutual information and may be a PSDR. The blue and
NarL G N兾D S V兾L L E兾N
magenta columns have low mutual information and are not PSDRs.
AutR E D兾H Y A T兾L D兾E
CitB I兾L Y兾H A I I T
OmpR L M K R P N
differential activation’’ and we suggest particular mutations that FixJ S R H A E E兾D
would test this concept. NtrC V V兾R Q兾H A P D
Sp0F L K Y I A D
Methods VanR T — L Q — R
Databases of Protein Sequences and MSA. PK sequences have been
Each column shows the frequently encountered (ⱖ0.2) amino acids.
downloaded from the Sentra (5) and SWISS-PROT databases *Sequence positions are according to the x-ray structure (19).
(25), or found by a BLAST (26) search of the nonredundant †Mutual information determined by using Eq. 1 (see Methods).
database at the National Center for Biotechnology Information ‡Family is defined as in ref. 6. AutR ⫽ autolysin response domain (5). VanR has
(Bethesda). CLUSTALW (27) and HMMER2.2G (28) have been used not been used in calculating Ii and is included only for comparison with PhoB.
to make the MSAs. We have used data from Pfam (29) to guide
our alignments. For details, see Supporting Text, which is
published as supporting information on the PNAS web site, where i, x, and y denote the position in the alignment, the amino
acid type, and the family number, respectively (30). Y is the total
www.pnas.org.
number of families in an alignment (i.e., Y ⫽ 12 in Tables 1 and
Locating PSDRs with Mutual Information. Similarly to our previous
2; Y ⫽ 6 in Table 3). Pi(x, y) is the probability of finding amino
study (24), we assume that PSDRs would be conserved among acid type x at position i and in family y. Pi(x) is the probability
enzymes of the same substrate, but would vary among enzymes of finding amino acid type x at position i regardless of family and
P(y) is simply the fraction of proteins belonging to family y.
of different substrates. For example, the red column in Fig. 3 may
Importantly, Ii measures the correlation between x and y, and
be a PSDR, but the blue and magenta columns are not. To
Ii ⫽ 0 if and only if x and y are statistically independent (30).
quantify the difference between the red and the blue (or
Therefore, the red column in Fig. 3 has a high Ii, whereas the blue
magenta) column, we use ‘‘mutual information,’’ defined as
and magenta columns have low Iis. However, Ii alone cannot
冘 冘 define a PSDR because it strongly depends on the amino acid
BIOCHEMISTRY
Pi共x, y兲
Ii ⫽ Pi共x, y兲 log , [1] composition of the column (24). Instead, we must estimate the
Pi共x兲P共y兲
x⫽1. . .20 y⫽1. . .Y statistical significance of Ii. A similar method has been used
Table 1. PSDRs and their identities among prokaryotic two-component systems:
DD of histidine kinase
Sequence position in Sp0B*
24 25 33 34 38 42 43 45 74 78
Ii† 1.38 1.22 1.43 1.36 1.33 1.55 1.25 1.45 1.81 1.42
Family‡
PhoR F F兾L R兾K T V Y兾T L M兾T Q兾T L
BaeS F兾S M兾N R T V兾I E兾R L A兾G D兾E L
CreC Y V K兾I S A A A I兾L兾S T兾R兾N Q兾L
KdpD L L R T兾S A兾V兾G A A兾V T N M
PhoQ T L K T V T L S Y R
NarX L V兾L T兾G A兾V L兾G Q兾E E Q兾K C兾M Q兾A
AutS L A兾G E L E K L K K L
CitA A L M N V兾T L V兾L L S兾N A
EnvZ L M R T R A T M Y G
FixL M A N Q A Y I兾M兾S G I L
NtrB L兾M A兾V K N G A A L R F兾L
Sp0B L L M N L N L L P F
Each column shows the frequently encountered (ⱖ0.2) amino acids.
Downloaded by guest on August 20, 2021
*Sequence positions are according to the x-ray structure (19).
†Mutual information determined by using Eq. 1 (see Methods).
‡Family is defined as in ref. 6. AutS ⫽ autolysin sensor domain (5).
Li et al. PNAS 兩 April 15, 2003 兩 vol. 100 兩 no. 8 兩 4465
Table 3. PSDRs and their identities among eukaryotic PKs in the AGC group
                                                                                                            Sequence position in structure of PKA*

                                         PSDRs         48       53        56        58        83       84        87     115     129      133       191        196       243     247      249       253

                                         Ii           0.99     0.95      1.10      1.01      0.98     1.25      1.18   1.01    1.10      0.98      1.11       1.03     1.25     1.02    1.11      1.12
                                         Family†
                                            PKA        T       S兾G         R      M兾H兾E       K        Q         H     N兾Y     F兾W        R        V兾I        W         P        Y      K兾N        G
                                            PKC        V       S兾N         K       M兾L       D兾E      D兾E       C兾S     R       M         Q        N兾G      S兾R兾K       E       F兾Y     S兾A       D兾H
                                            RAC        L        T          K        I         D        E         H      R        F        S         G         K         H        F       L         E
                                            GRK       V兾I       G          E       C兾Y       K兾Q       G        M兾L    A兾K     K兾H       Y兾S      I兾F兾V     R兾H兾K      K兾D      V兾I      R       E兾T兾N
                                            S6 PK      V      G兾S兾A        K        F        A兾N       D        H兾R     K        F      S兾E兾Y     S兾A兾F      Y兾H        R       M兾I     K兾L        A
                                            PVPK1     R兾P       D          S      Y兾H兾F      N兾K       K         R     F兾H     H兾F       Q兾D       C兾T       M兾N        R       F兾L     N兾V       P兾K

                                         *Sequence positions according to the x-ray structure of cAMP-dependent PK (22). See Table 1 for the meanings of Ii and X兾Y(兾Z).
                                         †See text for definitions of abbreviations. The number of sequences for each family is 69 (PKA), 139 (PKC), 23 (RAC), 58 (GRK), 41 (S6 PK), and 50 (PVPK1). The

                                          PKA family includes all cyclic nucleotide-dependent PKs (4).

                                         recently to find potentially important sites in proteins (31). Our                of Leu-18 is ⬍5.5 Å away from the side chain of Leu-38, Asn-42,
                                         method also assumes similar binding geometries in most PK–                        or Leu-45. For three reasons, we believe that these four residues
                                         substrate pairs. This assumption is supported by available crystal                play a primary role in determining specificity of DD–RR rec-
                                         structures (22, 32), experiments with peptide libraries (16–18),                  ognition. First, the residues have statistically significant Ii values
                                         and recent computational studies (33).                                            (Tables 1 and 2). Second, the residues are in close contact with
                                                                                                                           each other. It should be noted that the DD and RR sequences
                                         Evaluating Statistical Significance and Choosing PSDRs. To evaluate               have been analyzed separately, without using structural infor-
                                         the statistical significance of an Ii, we need ‘‘control’’ MSAs to                mation, and Leu-18, Leu-38, Asn-42, and Leu-45 are found to be
                                         estimate the P value (⫽ the probability of observing this Ii in the               in contact only after the mutual information analysis. Third,
                                         control). We base our choice on the following reasoning. There                    among the families in Tables 1 and 2, there are correlated
                                         are two major mechanisms of conservation for an amino acid                        mutations between position 18 of the RR and positions 38, 42,
                                         position. The first mechanism is independent of amino acid                        and 45 of the DD. The most dramatic example is between the
                                         position in a protein. Examples of the first mechanism are chance                 sporulation (Sp0F–Sp0B in Tables 1 and 2) and the autolysin
                                         and phylogeny (34). The second mechanism is position-specific,                    system (AutS-AutR in Tables 1 and 2). When Leu-18 in Sp0F
                                         and conserves residues that have important structural, func-                      changes to Glu in AutR, Leu-38, Asn-42, and Leu-45 in Sp0B
                                         tional, or kinetic roles (35). In this work, we are searching for                 turn to Glu, Lys, and Lys, respectively, in AutS. The hydrophobic
                                         specificity-determining residues, which are important for protein                 contacts among Leu-18, Leu-38, Asn-42, and Leu-45 in Sp0F–
                                         function. PSDRs, then, are probably under position-dependent                      Sp0, then, seem to have been replaced by a mixture of hydro-
                                         conservation. Therefore, the ideal control MSA should take into                   phobic and electrostatic interactions in AutS-AutR. This hydro-
                                         account the position-independent conservation, but should ig-                     phobic-to-electrostatic switch may prevent Sp0F from binding to
                                         nore any position-specific conservation that may be in the MSA                    AutS in Bacillus subtilis. A simple experiment will confirm or
                                         of real proteins. We use the linear transformation method (24)                    refute this hypothesis: changing Leu-18 to Glu in Sp0F should
                                         to generate control MSAs that satisfy this requirement. The Iiobss                weaken the binding between Sp0F and Sp0B, but further mu-
                                         and Iiexps for the RR are plotted in Fig. 4a. In addition, for the                tating Leu-38, Asn-42, and Leu-45 in Sp0B to Glu, Lys, and Lys
                                         eukaryotic PKs, we find the method of Wollenberg and Atchley                      should restore, at least partially, the affinity between Sp0F and
                                         (34) to be useful in locating the cutoff for Iiobs (Fig. 4b). For the             Sp0B.
                                         prokaryotic PKs, we define a PSDR as any residue with Iiobs ⱖ                        Haldimann et al. (23) have done a similar experiment on the
                                         1.2 and P ⱕ 0.0013. For the eukaryotic PKs, we choose any                         PhoR–PhoB system, trying to make PhoB recognize the non-
                                         residues with Iiobs ⱖ 0.95 and P ⱕ 0.0003 as PSDRs. Details of                    cognate HPK VanS. Comparing their results with our predic-
                                         the methods are given in Supporting Text, which is published as                   tions, it is very encouraging that Met-17 in PhoB (⫽ Leu-18 in
                                         supporting information on the PNAS web site.                                      Sp0F), is involved in altering the specificity of PhoB (23).
                                                                                                                           However, our analysis misses some of the specificity-altering
                                         Results and Discussion                                                            mutations in PhoB, such as T97A (23). Interestingly, Haldimann
                                         Prokaroytic HPK Two-Component System. Our analysis predicts 10                    et al. (23) find no PhoB mutant that recognizes only VanS, and
                                         and 6 PSDRs in the DD and RR, respectively (Tables 1 and 2 and                    not PhoR. To make such a mutant, Table 2 suggests the following
                                         Fig. 1). There are no PSDRs on the helix that does not make                       method: Arg-85 (⫽ 84 in Table 2), Arg-91 (⫽ 90 in Table 2), and
                                         contact with the RR (Fig. 1b). All six PSDRs on the RR are near                   Ser-108 (⫽ 107 in Table 2) in PhoB should be mutated to Leu,
                                         the active site of the Rossman fold, even though they are wide                    Gln, and Arg, respectively. Furthermore, Met-17 could be
                                         apart in the amino acid sequence (Fig. 1 and Table 2). In the DD,                 replaced by Thr, rather than by Val (23).
                                         the 10 PSDRs segregate into two groups: one near the turn of the                     Four other observations are noteworthy in Fig. 1 and Tables
                                         antiparallel helical bundle, and the other close to the termini of                1 and 2. First, in the Sp0F–Sp0B system, the phosphate is
                                         the helices (Fig. 1).                                                             transferred from His-30 on the DD to Asp-54 on the RR (20).
                                            A fascinating picture emerges when we view the PSDRs on the                    These two residues (yellow in Fig. 1) are not PSDRs as they are
                                         DD and RR together (Fig. 1). Most of PSDRs are involved in                        conserved in all families, but are surrounded by several PSDRs.
                                         contacts between DD and RR, or between DDs of the two                             Enzyme-substrate specificity, then, may be determined by amino
                                         monomers. The first group may be responsible for specific                         acids outside the active site. This phenomenon appears again in
                                         DD–RR recognition, whereas the second group may play a role                       our analysis of Ser兾Thr PKs (see next section). Second, two
                                         in correct dimerization.                                                          PSDRs on Sp0F, Asp-107 and Lys-56, are in contact with Sp0B.
Downloaded by guest on August 20, 2021

                                            Leu-18 of the RR forms a tight hydrophobic minicore with                       However, the Sp0B contact partners of Asp-107 and Lys-56 are
                                         Leu-38, Asn-42, and Leu-45 on the DD (Fig. 1). The side chain                     not PSDRs, because they have mutual information values that

                                         4466 兩 www.pnas.org兾cgi兾doi兾10.1073兾pnas.0737647100                                                                                                     Li et al.
specificity of some other interactions formed by these proteins.
Finally, our previous work has demonstrated that certain amino
acids may have been conserved for protein folding kinetics (35,
36), and the kinetically important residues (nucleating residues)
in the Rossman fold have been identified (35). The six PSDRs
in the RR are aligned with Ile-20, Asn-59, Asp-89, Ile-96,
Val-108, and Thr-112 in the CheY structure of ref. 35. Not
surprisingly, there is no overlap between the PSDRs and the
nucleating residues in the Rossman fold. Although both PSDRs
and nucleating residues tend to be conserved, they exhibit
different evolutionary signatures. PSDRs are conserved in each
family, but need to be different across various families to avoid
crosstalk among paralogous proteins. In contrast, nucleating
residues do not necessarily change from one family to the other,
but are conserved for rapid folding.
AGC Group of Eukaryotic PKs. Our analysis reveals 16 PSDRs in this
group (Table 3). Interestingly, seven of them are near, or in
contact with, the inhibitor substrate: Ser-53, Lys-83, Gln-84,
His-87 (all shown in Fig. 2b), Phe-129 (Fig. 2c), Arg-133 (Fig. 2c),
and Pro-243. Two PSDRs (Val-191 and Trp-196) are in close
proximity to Thr-197 (Fig. 2d). Arg-56 is next to Phe-54 and
Gly-55, the two ATP-binding residues in PKA (12).
We first analyze the PSDRs near or in contact with the
substrate, using the well known PKA–inhibitor-complex struc-
ture from ref. 21 (Fig. 2a). In the peptide inhibitor (yellow in Fig.
2a), the P (phosphorylation) site is Ala-21 (22). Ser-53, Gln-84,
Phe-129, and Pro-243 are within 4.8 Å of their substrate partner,
whereas His-87 is 6.3 Å from its partner on the inhibitor. Ser-53,
Gln-84, and His-87 interact with His-23 at the P ⫹ 2 site on the
substrate (Fig. 2b). The side chains of Phe-129 and Arg-133 are
tightly packed against the Arg side chains at P ⫺ 2 and P ⫺ 3 (Fig.
2c). Pro-243 makes hydrophobic contacts with the side chain of
Arg-15, which corresponds to P ⫺ 6.
Importantly, our results elucidate a considerable part of
existing data on AGC specificity, and they predict mutations that
could switch specificity from one family to another in Table 3.
For example, considering the tight interactions among positions
129, P ⫺ 2 and P ⫺ 3 (Fig. 2c), the residue at position 129 is
BIOCHEMISTRY
expected to determine the variation at P ⫺ 2 and P ⫺ 3. This
expectation is fulfilled in Table 3. In PKA, PKC, RAC, and S6
PK, position 129 is occupied mostly by residues that can make
hydrophobic interactions (Phe, Trp, and Met), whereas in GRK,
a basic residue (Lys) is commonly found at position 129. There
Fig. 4. Mutual information (Ii) and its statistical significance. (a) The Ii values
is a corresponding change in the substrate residues at P ⫺ 2 and
for the RR in the prokaryotic two-component system. The abscissa and ordi- P ⫺ 3. Both PKA and PKC select amino acids with a long
nate represent the sequence position and mutual information, respectively. hydrocarbon chain (Arg or Lys) at P ⫺ 2 and P ⫺ 3 on the
The blue points are the observed values and the red points are the expected substrate (16). Arg is also strongly favored at the P ⫺ 3 site for
values. The error bars are drawn at three standard deviations from the mean RAC and S6 PKs (16). In contrast, for GRK2, the substrate
of the expected value and correspond to P ⫽ 0.0013. (b) The distribution of Iis consensus sequence has acidic residues (Asp or Glu) at P ⫺ 2 and
for the eukaryotic PKs in the AGC group. The abscissa and ordinate represent, P ⫺ 3 (16). Electrostatics seems, then, to govern the specificity
respectively, the mutual information and the probability of observing a between position 129 and the P ⫺ 2 or P ⫺ 3 site in GRK,
particular mutual information. The blue line is the observed result and the red
whereas hydrophobic packing appears to dominate in PKA,
line is the control from the method cited in ref. 34. The vertical line means that
there is a probability of ⬍0.001 of observing an Ii ⱖ 1.0 in the control MSAs
PKC, RAC, and S6 PK. This hypothesis could be tested by
from the method cited in ref. 34. Note that ‘‘p’’ in this figure does not mutating Phe-129 in PKA to Lys. The substrate consensus
correspond to the P value described in the text, which has been determined by sequence should then prefer Asp or Glu at P ⫺ 2 and P ⫺ 3.
the linear transformation method from ref. 24. See Methods for details. Position 84 is another clear example of how Table 3 illuminates
and unifies experimental data on specificity. For the P ⫹ 2 site,
there seems to be no preference in PKA (16). On the other hand,
are within expectation (data not shown). Asp 107 and Lys 56, PKC (16) and RAC (16) show a significant preference for the
then, may play a secondary role in determining specificity. Third, basic Arg at P ⫹ 2. In PKA, Gln-84 holds on to His 23 at P ⫹
some residues in Table 1 (e.g., Phe-78 in Sp0B) makes no 2 through hydrophobic and electrostatic interactions (Fig. 2b). In
DD–RR contacts in the Sp0F–Sp0B complex, but they have been PKC and RAC, the counterpart of Gln-84 is either Asp or Glu
determined by our method to be PSDRs. Such residues form (Table 3), which explains why Arg is preferred at P ⫹ 2. PKC and
contacts between DDs of the two chains, and therefore may be RAC, then, seem to use a salt bridge to achieve specificity for
responsible for specific dimerization. Other PSDR residues may P ⫹ 2 recognition, whereas PKA may rely on a combination of
Downloaded by guest on August 20, 2021
affect specificity in a way that is not revealed by the x-ray hydrophobic and electrostatic interactions. We can readily test
structure, may be false positives, or may be responsible for this hypothesis by mutating Gln-84 to an acidic residue. An
Li et al. PNAS 兩 April 15, 2003 兩 vol. 100 兩 no. 8 兩 4467enhanced preference for Arg at P ⫹ 2 would then confirm the experimental conditions for the three experiments were not
hypothesis. identical (37–39). Therefore, to rigorously test the hypothesis of
We now turn our attention to positions 191 and 196. The specificity via differential activation, we propose the mutation of
residues are not in contact with the inhibitor in PKA (Fig. 2d), Trp-196 in PKA to Lys (as in RAC) and His (as in S6 PK). If
so it seems unlikely that Val-191 or Trp-196 plays a direct role specificity via differential activation is true, we expect the rate of
in recognizing the substrate. Why, then, do these two positions Thr-197 phosphorylation to differ considerably among Trp-196,
show intrafamily conservation but interfamily diversity (Table Lys-196, and His-196 under the same experimental conditions.
3)? The answer may lie in the proximity among Val-191, Trp-196,
and Thr-197 (Fig. 2d). As stated before, Thr-197 in PKA, and its Conclusions
counterpart in several other PKs, must be phosphorylated for the We have achieved three important goals in this work. First,
enzyme to be fully active (12). When PKA is activated by without using experimental data, we predict PSDRs in prokary-
phosphorylation, it could be detrimental for the cell to simul- otic and eukaryotic PKs, and we refine our statistical procedure
taneously activate other PKs such as PKC and RAC. Therefore, for the discovery of PSDRs by using paralogous and orthologous
the different residues at positions 191 and 196 may be a method proteins. Second, we compare our predictions with current
for the cell to regulate the phosphorylation rate and thereby to experimental results and we obtain considerable agreement.
achieve enzyme-substrate specificity. In particular, the side chain More importantly, our analysis has enabled us to understand,
of Trp-196 is largely solvent-exposed (Fig. 2d) and may be within a unified framework, how different PKs distinguish their
substrates from nonsubstrates. In particular, the hydrophobic兾
involved in controlling access and guiding any PKA kinase to
electrostatic balance between a PK and its substrate appears to
Thr-197. This example illustrates the hypothesis of specificity via
be a major determinant of enzyme-substrate specificity. Finally,
differential activation in the Introduction.
we find PSDRs that are outside the active site in prokaryotic and
Experiments show that phosphoinositide-dependent PK1
eukaryotic PKs. Based on our results, as well as structural and
(PDK1) phosphorylates Thr-197 in PKA, RAC, and S6 PK at biochemical characterizations of eukaryotic PKs, we propose the
different rates (37–39). At 30°C, PDK1 takes ⬇25 min to achieve hypothesis of specificity via differential activation as a way for
50% phosphorylation at Thr-197 (37), whereas the same degree the cell to control kinase specificity. Very importantly, for every
of phosphorylation requires almost 50 min in RAC (38). The prediction or hypothesis we make, we outline specific mutations
wild-type S6 PK is minimally phosphorylated by PDK1, even that could confirm or refute the prediction or hypothesis.
after 45 min of incubation at 30°C (39). Interestingly, there
appears to be a correlation between the size of the side chain at This work has been supported by National Institutes of Health Grant
position 196 and the phosphorylation rate at Thr-197: PKA 52126 (to E.I.S.), an NEC fund, and a John F. and Virginia T. Taplin
(Trp-196) ⬎ RAC (Lys-196) ⬎ S6 PK (His196). However, the Award (to L.A.M.).
1. Rubin, G. M., Yandell, M. D., Wortman, J. R., Gabor Miklos, G. L., Nelson, 21. Peeper, D., Parker, L. L., Ewen, M. E., Toebes, M., Hall, F. L., Xu, M., Zantema,
C. R., Hariharan, I. K., Fortini, M. E., Li, P. W., Apweiler, R., Fleischmann, A., van der Eb, A. J. & Piwnica-Worms, H. (1993) EMBO J. 12, 1947–1954.
W., et al. (2000) Science 287, 2204–2215. 22. Knighton, D. R., Zheng, J., Ten Eyck, L. F., Xuong, N.-H., Taylor, S. S. &
2. Manning, G., Whyte, D. N., Martinez, R., Hunter, T. & Sudarsanam, S. (2002) Sowadski, J. M. (1991) Nature 253, 414–420.
Science 298, 1912–1934. 23. Haldimann, A., Prahalad, M. K., Fisher, S. L., Kim, S.-K., Walsh, C. T. &
3. Hunter, T. (1987) Cell 50, 823–829. Wanner, B. L. (1996) Proc. Natl. Acad. Sci. USA 93, 14361–14366.
4. Hanks, S. K. & Hunter, T. (1995) FASEB J. 9, 576–596. 24. Mirny, L. A. & Gelfand, M. S. (2002) J. Mol. Biol. 321, 7–20.
5. Maltsev, N., Marland, E., Yu, G.-X., Bhatnagar, S. & Lusk, R. (2002) Nucleic 25. Bairoch, A. & Apweiler, R. (2000) Nucleic Acids Res. 28, 45–48.
Acids Res. 30, 349–350. 26. Altschul, S. F., Madden, T. L., Schäffer, A. A., Zhang, J., Zhang, Z., Miller W.
6. Grebe, T. W. & Stock, J. B. (1999) Adv. Microb. Physiol. 41, 139–227. & Lipman, D. J. (1997) Nucleic Acids Res. 25, 3389–3402.
7. Koretke, K. K., Lupas, A. N., Warren, P. V., Rosenberg, M. & Brown, J. R. 27. Thompson, J. D., Higgins, D. G. & Gibson, T. J. (1994) Nucleic Acids Res. 22,
(2000) Mol. Biol. Evol. 17, 1956–1970. 4673–4680.
8. Kim, D.-J. & Forst, S. (2001) Microbiology 147, 1197–1212. 28. Eddy, S. R., Mitchison, G. & Durbin, R. (1995) J. Comput. Biol. 2, 9–23.
9. Stock, A. M., Robinson, V. L. & Goudreau, P. N. (2000) Annu. Rev. Biochem. 29. Batesman, A., Birney, E., Durbin, R., Eddy, S. R., Howe, K. L. & Sonnhammer,
69, 183–215. E. L. (2000) Nucleic Acids Res. 28, 263–266.
10. Dutta, R., Qin, L. & Inouye, M. (1999) Mol. Microbiol. 34, 633–640. 30. Cover, T. & Thomas, J. (1991) Elements of Information Theory (Wiley, New York).
11. Hanks, S. K. & Quinn, A. M. (1991) Methods Enzymol. 200, 38–62. 31. Bickel, P. J., Kechris, K. J., Spector, P. C., Wedemayer, G. J. & Glazer, A. N.
12. Smith, C. M., Radzio-Andzelm, E., Madhusudan, Akamine, P. & Taylor, S. S. (2002) Proc. Natl. Acad. Sci. USA 99, 14764–14771.
(1999) Prog. Biophys. Mol. Biol. 71, 313–341. 32. Cook, A., Lowe, E. D., Chrysina, E. D., Skamnaki, V. T., Oikonomakos, N. G.
13. Mellor, H. & Parker, P. J. (1998) Biochem. J. 332, 281–292. & Johnson, L. N. (2002) Biochemistry 41, 7301–7311.
14. Pitcher, J. A., Freedman, N. J. & Lefkowitz, R. J. (1998) Annu. Rev. Biochem. 33. Brinkworth, R. I., Breinl, R. A. & Kobe, B. (2003) Proc. Natl. Acad. Sci. USA
67, 653–692. 100, 74–79.
15. Huse, M. & Kuriyan, J. (2002) Cell 109, 275–282. 34. Wollenberg, K. R. & Atchley, W. R. (2000) Proc. Natl. Acad. Sci. USA 97,
16. Pinna, L. A. & Ruzzene, M. (1996) Biochim. Biophys. Acta 1314, 191–225. 3288–3291.
17. Songyang, Z., Lu, K. P., Kwon, Y. T., Tsai, L.-H., Filhol, O., Cochet, C., Brickey, 35. Mirny, L. A. & Shakhnovich, E. I. (1999) J. Mol. Biol. 291, 177–196.
D. A., Soderling, T. R., Bartleson, C., Graves, D. J., et al. (1996) Mol. Cell. Biol. 36. Li, L., Mirny, L. A. & Shakhnovich, E. I. (2000) Nat. Struct. Biol. 7, 336–341.
16, 6486–6493. 37. Cheng, X., Ma, Y., Moore, M., Hemmings, B. A. & Taylor, S. S. (1998) Proc.
18. Yaffe, M. B., Leparc, G. G., Lai J., Obata, T., Volinia, S. & Cantley, L. C. (2001) Natl. Acad. Sci. USA 95, 9849–9854.
Nat. Biotechnol. 19, 348–353. 38. Alessi, D. R., James, S. R., Downes, C. P., Holmes, A. B., Gaffney, P. R. J.,
19. Zapf, J., Sen, U., Madhusudan, Hoch, J. A. & Varughese, K. I. (2000) Structure Reese, C. B. & Cohen, P. (1997) Curr. Biol. 7, 261–269.
(London) 8, 851–862. 39. Pullen, N., Dennis, P. B., Andjelkovic, M., Dufner, A., Kozma, S. C.,
20. Varughese, K. I. (2002) Curr. Opin. Microbiol. 5, 142–148. Hemmings, B. A. & Thomas, G. (1998) Science 279, 707–710.
Downloaded by guest on August 20, 2021
4468 兩 www.pnas.org兾cgi兾doi兾10.1073兾pnas.0737647100 Li et al.You can also read