Technical Assistance Consultant's Report
←
→
Page content transcription
If your browser does not render page correctly, please read the page content below
Technical Assistance Consultant’s Report

Project Number: TA 8166
December 2013

India: Climate Adaptation through Sub-Basin
Development Investment Program

Cauvery Delta Zone: Climate Data and Future Scenarios
—Final Report

This consultant’s report does not necessarily reflect the views of ADB or the Government concerned, and
ADB and the Government cannot be held liable for its contents. All the views expressed herein may not
be incorporated into the proposed project’s design.
IND (44429): Climate Adaptation through Sub-Basin Development
                      Investment Program
                 Cauvery Delta Tamil Nadu, India

                            Final Report
        Cauvery Delta Zone: Climate Data and Future Scenarios

                                                                1
Table of Contents

1.     INTRODUCTION                                8
1.1.    PROJECT BACKGROUND                         8
1.2.    GEOGRAPHICAL CONTEXT                       8
1.3.    CLIMATOLOGY                                8
1.4.    REVIEW OF EARLIER STUDIES                  9
1.5.    ORGANIZATION OF THIS REPORT               11

2.     APPROACH AND METHODOLOGY                   12
2.1. STRATEGY                                     12
2.2. SPATIAL DOMAIN                               12
2.3. HISTORICAL CLIMATE DATA                      13
STATION DATA                                      13
GRIDDED IMD DATA                                  14
APHRODITE GRIDDED PRECIPITATION DATA              14
2.4. CLIMATE MODELS USED                          14
CMIP5 GCMS                                        14
ASSESSMENT OF MONSOON SIMULATIONS                 16
SELECTION OF GCMS                                 16
REGIONAL CLIMATE MODEL (RCM)                      17
2.5. DELIVERED DATA SETS                          17
DATA EXTRACTION                                   18
BIAS CORRECTION                                   19
2.6. TROPICAL CYCLONES ANALYSIS                   19

3.     BASELINE CLIMATE AND EVALUATION            20
3.1. OBSERVED CLIMATOLOGY                         20
SEASONALITY                                       20
TRENDS                                            22
RAINFALL                                          26
3.2. BASIC STATISTICS                             26
3.3. EVALUATION OF GCM AND RCM                    31
TEMPERATURE SEASONAL CYCLE                        31
RAINFALL SEASONAL CYCLE EVALUATION                33
RAINFALL DAILY CLIMATOLOGY                        35
SPATIAL PATTERNS IN SUMMER MAXIMUM TEMPERATURES   37
SPATIAL PATTERNS IN RAINFALL                      38
3.4. BIAS CORRECTION                              42

4.     PROJECTIONS                                43
4.1.    CLIMATE CHANGE SCENARIO                   43

                                                   2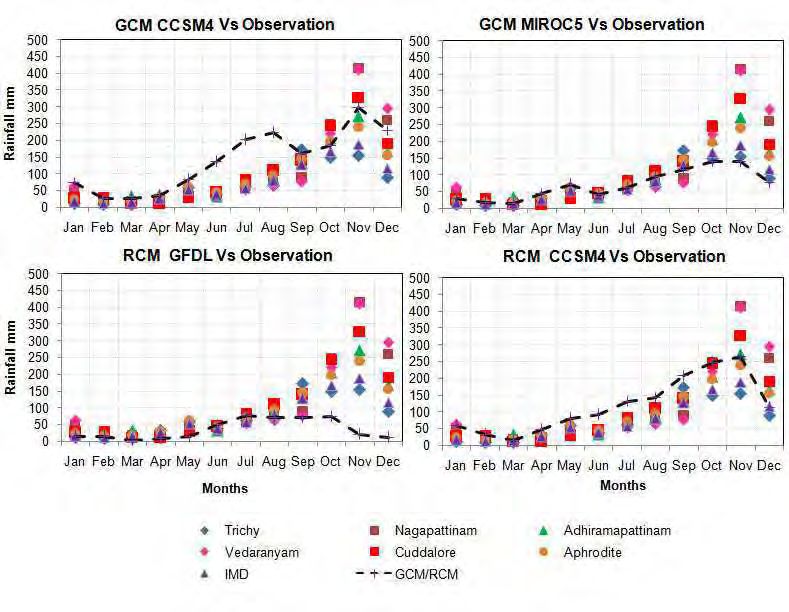
SEASONAL CYCLE                                                       43
DAILY RAINFALL PROJECTIONS                                           47
4.2. BASIC STATISTICS                                                49
4.4. SPATIAL CHANGES                                                 51

5.     DAILY RAINFALL ANALYSIS                                       55
5.1. RETURN PERIOD ANALYSIS FOR BASELINE                             55
5.2. RETURN PERIODS FOR PROJECTED RAINFALL DATA                      56
5.3. PROBABILITY OF RAINFALL                                         57
BASELINE                                                             57
FUTURE PROJECTIONS                                                   58

6.     TROPICAL CYCLONES                                             60
6.1.    CURRENT TRENDS AND VARIATIONS                                60
6.2.    TROPICAL CYCLONES AND POSSIBLE INFLUENCE OF CLIMATE CHANGE   62

7.     CONCLUSIONS                                                   64

8.     REFERENCES                                                    65

ANNEX I                                                              67
STATION OBSERVATIONS                                                 67
GRIDDED DATASETS                                                     69
REANALYSIS DATASETS                                                  69
CYCLONIC STORMS TRACKS DATA                                          69
LIST OF IMD DISTRICT RAINFALL MONIOTRING SCHEME (DRMS) STATIONS      71
SUMMARY OF DATA PROVIDED BY PWD, TAMIL NADU                          76

ANNEX II                                                             79
INVENTORY OF DAILY DATA FROM CIMIP5 GCMS                             79

ANNEX III                                                            81
DESCRIPTION OF DATA EXTRACTED FOR CDZ                                81
DATA STRUCTURE OF DISTRIBUTED CLIMATE DATASETS                       82
DATA SETS PRODUCED FOR CDZ                                           83
DATASETS FOR STATION LOCATIONS                                       84
DERIVED DATA                                                         85
FILE STRUCTURE                                                       86

                                                                      3
LIST OF ACRONYMS
ADB          Asian Development Bank
APHRODITE    Asian Precipitation—Highly-Resolved Observational Data Integration Towards Evaluation
CDZ          Cauvery Delta Zone
GCM          General Circulation Model (also Global Climate Model)
GHGs         Green House Gases
msl          Mean sea level
INCCA        Indian Network for Climate Change Assessment
IPCC         Inter-governmental Panel on Climate Change
IPRC         International Pacific Research Center (IPRC), University of Hawaii
IPRC-RegCM   IPRC Regional Climate Model
IWRM         Integrated Water Resources Management
LLNL         Lawrence Livermore National Laboratory, California, USA
RCM          Regional Climate Model
PCMDI        Program for Climate Model Diagnosis and Intercomparison
PPTA         Project Preparatory Technical Assistance
TN           Tamil Nadu

                                                                                                4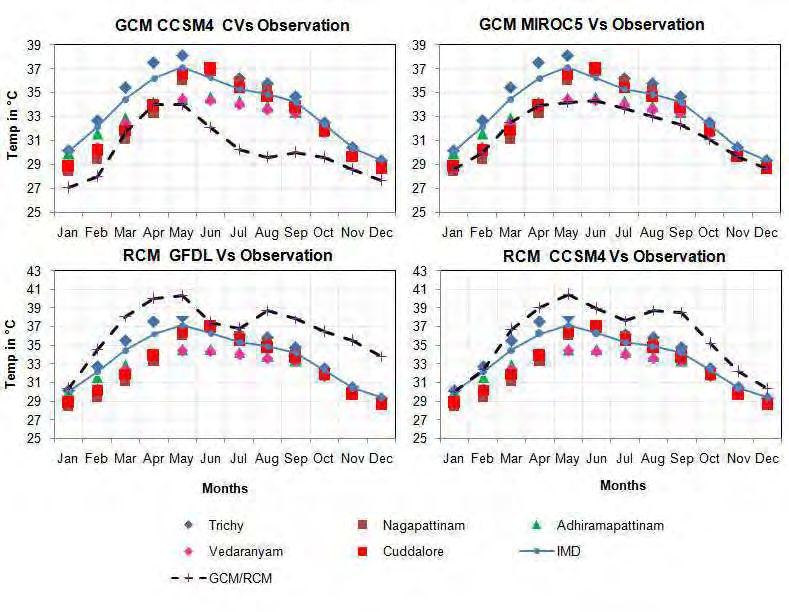
EXECUTIVE SUMMARY
The project was aimed to prepare an assessment of current climate and future climate change
over the Cauvery delta of Tamil Nadu, and to provide related data, analysis and interpretations,
based on the latest science. This was mainly intended to support hydrologic analysis,
particularly to build climate resilience in future designs for drainage improvement, flood control
and irrigation structures being planned under the over-arching Climate Adaptation through Sub-
basin Development investment Program (CASDP) of the Asian Development Bank (ADB).
Impacts of future climate change are expected to be more pronounced in areas that are already
vulnerable due higher population densities and exposure to natural hazards. In such contexts,
effective use of climate information in planning strategies are of greater relevance now, than
ever before.
The present project effort brought together a variety of observational data sets, including long-
term site-specific climate data to enable better characterization of local climate. Climate change
scenarios up to the 2050s have been generated and analyzed from state-of-the-art GCMs and
downscaled using a Regional Climate Model (RCM) to higher resolutions appropriate for water
sector adaptation strategies.
The importance of the Cauvery River and the Cauvery Delta Zone (CDZ) to the culture and
livelihoods of the people of Tamil Nadu cannot be overstated. The tropical climate of the Tamil
Nadu region is characterized around seasonal rainfall contributed by both South West (SW) and
the North East (NE) monsoons influencing the Indian sub-continent. Set within this larger
climatological context, the deltaic region of River Cauvery comes mainly under the influence of
NE monsoon. Cyclonic disturbances, while providing important additional water resource to the
CDZ in their benign forms, can cause substantial damage to life and property when they reach
severe intensities. Although the mean annual temperatures over the Cauvery delta area is
around 30 C, summer peaks can go up to 43 C with consequences to both water demand and
evaporative losses.
The task of the climate component of the project involved initial scoping of available data from
the point of view of requirements of the water sector groups. An inventory of observed climate
data sets for the CDZ was prepared from this initial scoping and some details are included in the
this report. Observed climate data for project location available from the meteorological stations
of the India Meteorological Department (IMD), data from available Government of Tamil Nadu
Public Works Department (PWD), and gridded data sets of both IMD and other global sources
were inventoried and assessed. A sub-set of these observed data sets were used to
characterize the baseline climatology of the project location.
General Circulation Models (GCMs) are the main tools available to project future climate and its
change in response to various greenhouse gas emission scenarios. GCMs, projections are
however still too coarse (~200 km) for use in sub-basin level climate change assessments. This
study has therefore used Regional Climate Model (RCM) - downscaled high-resolution (~30 km)
scenarios generated from coarse resolution GCMs projections, in addition to GCMs results.
Results available from current genre of CMIP5 GCMs (Coupled Model Inter-comparison Project
phase 5) models and dynamically downscaled RCM results forced with CMIP5 and CMIP3
lateral boundary conditions were used for preparing baseline and future climate change
scenarios for the study area.

                                                                                                5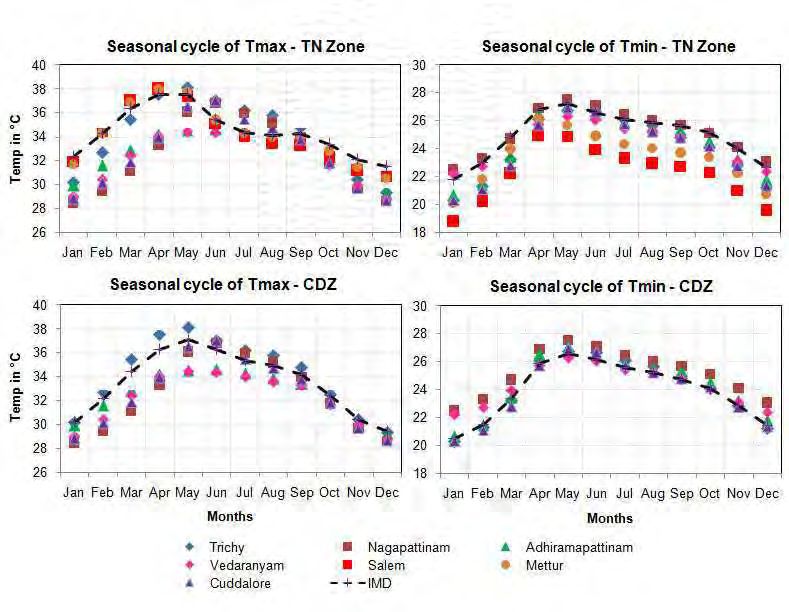
Both the GCMs, and the RCMs capture the seasonal evolution in temperatures but with a cold
bias in certain cases pertaining to the GCMs and warm bias in case of the CCSM4 driven RCM.
Among the model results compared temperature biases are of the order of about 2-3 C for
maximum temperatures. Overall the models are able to closely capture temperature variations
during the season as well as spatial patterns. The temperature evaluation indicates that there is
more confidence in temperature projections, which is probably higher during the drier months of
the year.
Simulation of rainfall accurately is difficult for climate models, as rainfall is an end product of
many inter-linked processes in the earth’s climate system. This gets even more challenging
when projections are required over a small area like the CDZ because rainfall’s natural
variability increases as we go from larger to smaller domains. However, It is encouraging to note
that the GCMs and RCMs used in this assessment pick up the seasonal cycle of rainfall over
the CDZ quite well. Significant biases do exist, which in one of the regional model results has
been corrected using a bias correction procedure. Model results compared over a daily time
scale showed quite a good similarity with respect to observed rainfall. Due to higher variability of
rainfall there is lesser confidence in rainfall estimates and projections.
Analysis of temperature observations from stations in the CDZ area shows an increasing trend
in both maximum and minimum temperatures. The annual mean maximum temperatures are
increasing at a rate of about 0.13 to 0.33 C/10 years. Both maximum and minimum temperature
trends are most prominent during the cooler months of January and February. Historical
observations of rainfall from both gridded and station observations show very little trends with
predominance of year-to-year variability.
The climate change scenarios for CDZ have been prepared for time horizons up to 2050
keeping in view the planning needs of water sector projects. Particular focus of our analysis was
on temperature and rainfall variables as they are the key variables for the hydrological analysis
and have also been extensively evaluated with relatively higher reliability as compared to other
variables. However, data sets have been provided for other variables like humidity, wind speed,
solar radiation, evaporation and mean sea-level pressure.
Maximum temperature change over the CDZ projected by the models show a range from about
1.0 to 1.5°C by the 2050s. Minimum temperatures show a larger increase with changes ranging
from 2-3°C. Spatially, the temperatures changes show a large variation over the TN region with
the range going from 2-6°C for maximum temperatures in the 2050s, with the RCM driven by
GFDL showing higher temperature increase. These results are consistent with the earlier
climate model projection studies undertaken by other research groups.            These rising
temperatures will have consequences to the water sector, in terms of higher water demand and
enhanced evaporative losses. Higher mean temperatures may also translate into longer spells
of heat waves in summers.
In the projected temperature changes over the CDZ, the differentiation between high and
medium emission scenarios is not seen clearly in changes up to 2050s. That means different
emission scenarios do not impact temperatures differently over time-horizons until the 2050s
considered for this study.
The projected rainfall changes over the region vary, but most of the model results show
increase in rainfall during the rainy season months. Seeing the lack of clear agreement among
the various models used, it seems that this conclusion may not be as robust as the temperature

                                                                                                  6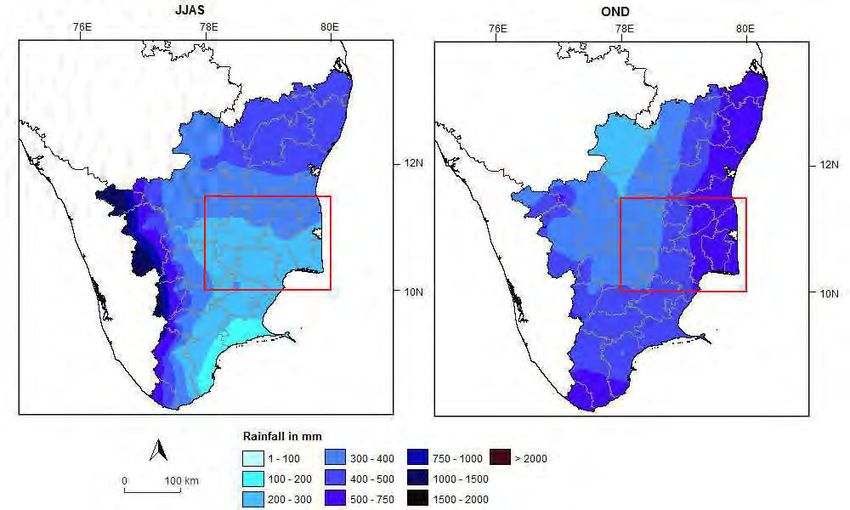
increase. Further analyses of the rainfall return-periods and assured rainfall amounts also
indicate increase in rainfall, and extreme rainfall amounts. From the climate resilience
perspective it could be interpreted as planning for a slightly longer return period design standard
than the one being presently used.
Although the rainfall projections are not clearly indicative of clear increase in magnitude, there
seems to be a shift towards more a more variable behavior in daily rainfall amounts. Addressing
such changes would perhaps require better management strategies that can dynamically adjust
to a wider range of climate situations. Enhanced use of climate information in short-term
management practices is soft option that me require consideration.
In view of the range of bias in the model results, it would be perhaps better to use the delta
method, which involves estimation of model projected changes with respect to their respective
baselines. These changes can be imposed on observed climate data series at any required
location to produce a future projection of a model scenario.
Future variations in the number of storms show year-to-year variations, but the total number of
detected storms for the entire period of simulation remains the same in both the base line and
future scenario integrations both cases. In other words, no measurable change in the total
number of storms is projected.

In summary, the climate change projections for the CDZ indicate a warmer regime with
possibility of a wetter northeast monsoon season that is variable with higher rainfall extremes.
Considering the uncertainties in future rainfall changes, it would be advisable to consider a mix
of measures that include institutional capacities in adaptive management. One of the key
aspects for better management will be information system that is supported by robust
monitoring networks, good data archival and interface to enable decision-making.

                                                                                                 7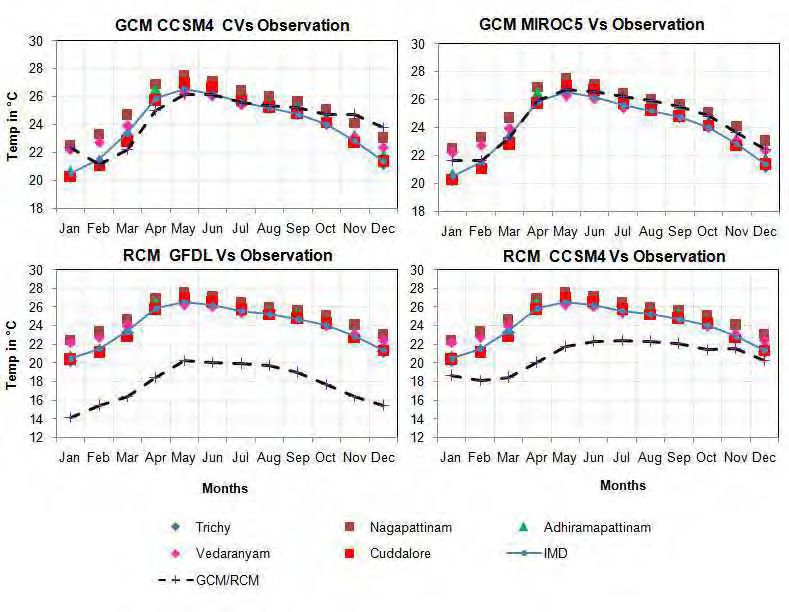
1. Introduction
  1.1. Project background
     1. The project aims to enhance resilience of communities to climate change in the
        Cauvery delta of Tamil Nadu, India. Outcome of the project will be improved
        integrated water resources, flood and coastal management in the delta area.
        Reliable information of current climate variability and future climate change
        scenarios, along with their respective range of uncertainties and confidence levels
        are required to support the hydrologic analysis for sub-basin Integrated Water
        Resources Management (IWRM).
     2. This climate component of this Project Preparatory Technical Assistance (PPTA)
        would aim to provide assessments of current climate and future climate change over
        the Cauvery delta of Tamil Nadu, and to provide related data, analysis and
        interpretations, based on the latest science to support the hydrologic analysis and
        design for drainage improvement, flood control and irrigation structures to be
        planned under this project.
     3. The work has been carried out in fulfillment of the formal contract under the
        framework of the ADB UNESCO-IHE Knowledge Partnership initiated on June 11,
        2012. The work was originally scheduled to be completed by November 2012, but
        since then has been accorded a cost neutral time extension until end of June 2013 in
        view of delays in accusation of data.
     4. Climate change scenarios based on “climate models that demonstrate skill in
        simulating current climate and high-resolution regional model simulations forced by
        these climate models” are being prepared along with limitations and uncertainties
        associated with these projections. These data and results will be made available in a
        popular format, along with explanatory notes, for further use, particularly to the PPTA
        team commencing further work on this ADB project.

  1.2. Geographical context
     5. Cauvery is one of the largest Rivers of southern India, flowing from northwest to
        southeast draining a basin of about 81,155 sq. km straddling the States of Karnataka
        and Tamil Nadu. The Cauvery Delta zone lies between 10.0 N to 11.30 N Latitude
        and 78.15 E to 79.45 E longitude at the end of the Cauvery river basin in the eastern
        part of Tamil Nadu. With an area of about 14,470 sq. km comprising of 28 revenue
        taluks falling within four districts of Nagappatinam, Thanjavur and Thrivarur and parts
        of the district Trichy (5 taluks), Cuddalore (2 taluks) and Puddukkottai (one thaluk),
        CDZ represents an equivalent 11% of the area of Tamil Nadu State (ADB, 2011).
     6. The terrain of the Cauvery basin is composed of ridge and valley topography on the
        western and central parts with plateaus in between and undulating terrain, rolling
        plains, fluvial plains, delta plains and coastal plains on the east. The maximum
        elevation of about 2,637 m is in Nilgri hills. The Karnataka plateau has an average
        elevation of about 900 m above mean sea level (msl), while the eastern Tamil Nadu
        plains including the CDZ lie below 300 m (Gopalakrishnan and Rao, 1986).

  1.3. Climatology
     7. Rainfall is the most important climatological resource for the Tamil Nadu state, and is
        contributed by both South West (SW) and the North East (NE) monsoon. The

                                                                                             8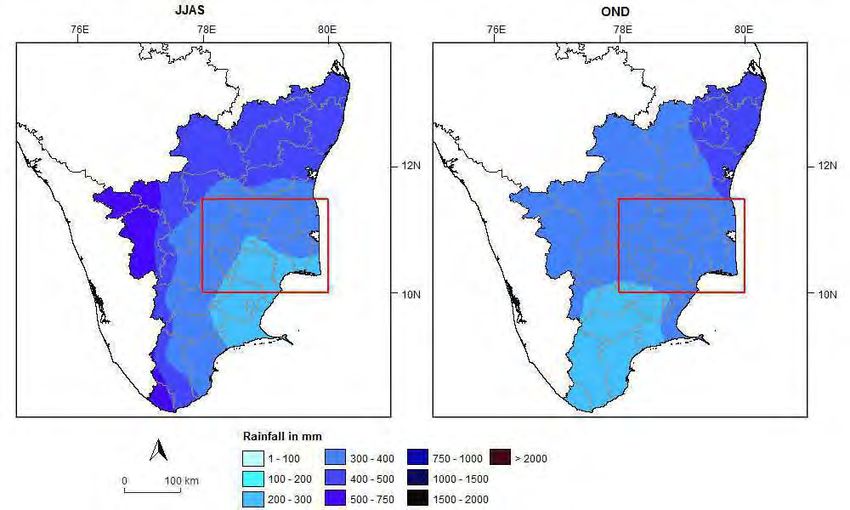
typically tropical climate of the region is characterized around these seasonal current
of moist winds from over the adjoining seas. Seasonal distribution of temperature in
this region is basically a modulation of sub-equatorial temperatures by the
monsoonal currents and local topography. Due to its proximity to the Bay of Bengal,
the state experiences frequent tropical cyclones, some of which landfall with fiery
intensity causing substantial damages to life and property, particularly to the CDZ
coast, due to both high speed winds and storm surge.
8. Set within this larger climatological context, the deltaic region of River Cauvery is
mainly under the influence of NE monsoon, whereas the river basin in the upper
reaches is controlled mostly by SW monsoon (June to September) in its prominent
source areas of Western Ghats. Rainfall in the upstream catchments, principally due
to the SW monsoon, fills the Mettur reservoir on the Cauvery Basin enabling paddy
cultivation outside the main rainy season of the catchment, which is during the
October to November NE monsoon season.
9. The surge of water from the tributaries to the main course of Cauvery during SW
monsoon brings a lot of sediment into the deltaic region from the uplands. The
tributaries are often dry during the rest of the year. The region experiences a semi-
arid tropical climate with mean annual temperature of 25°C and the maximum
summer (March to May) temperature reaches occasionally up to 43°C. A number of
dams constructed across the river in the recent past have modified the water
discharge and sediment accumulation rates in the deltaic region. An average
sediment accumulation rate between 0.4 and 4 mm/yr for the recent past has been
reported in the Cauvery River basin with less sedimentation rate in the tributaries
(Ramanathan et al., 1996).
1.4. Review of earlier studies
10. The climatological analysis of two representative stations Tiruchchirapalli (Trichy)
(western region of the delta) and Nagappattinam (coastal eastern end of the delta)
based on FAO CROPWAT have been carried out earlier as reported in ADB, 2011.
This analysis shows mean daily temperatures at Trichy to range from a low of about
25C in December to a high of about 32C in May. April to June is the hottest period
with mean daily maximums close to 31C. The mean daily temperature range is
typically about 8C. At Nagappattinam mean daily temperatures range from a low of
about 25C in December to a high of about 31.4C in May. May and June are the
hottest months with mean daily maximums close to 31C. The mean daily
temperature range is typically about 8C. The slightly lesser temperature maxima at
Nagappattinam is due to its proximity to the coast where the land-sea breeze bring
down the daytime maximum temperatures. Similarity in mean temperatures observed
at the two stations indicates that Tamil Nadu Cauvery Delta Zone (TNCDZ) is a
homogenous zone in terms of its temperature climate.
11. Trichy, located away from the coast records mean annual rainfall of 902 mm, while at
Nagappattinam the annual rainfall is 1421 mm. Figure 1-1 gives the seasonal rainfall
variation for the whole CDZ illustrating the stronger influence of the Northeast
monsoon over the Cauvery Delta.
9Figure 1-1 Mean monthly rainfall (mm) over the Cauvery Delta Zone (CDZ)
(Source: present study team based on climate normals of IMD stations)
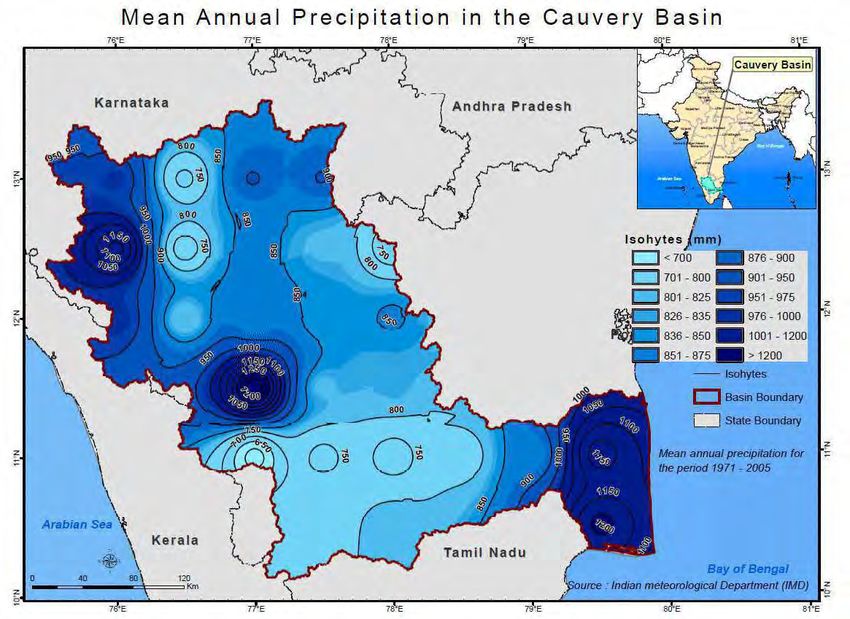
12. Analysis of spatial variation of mean annual rainfall over the Cauvery Basin based on
the India Meteorological Department (IMD) gridded 0.5×0.5 data that covers the 35
year period 1971 to 2005 has also been presented in ADB, 2011. There is a
significant variation of annual mean rainfall across the sub-basin, with about 700 mm
in the interior western area to more than 1200 mm in the eastern region nearer to the
coast (Figure 1-2).
Figure 1-2 Mean annual rainfall over the Cauvery river basin based on IMD gridded
rainfall data
(Source: ADB, 2011, based on IMD gridded rainfall data set)
1013. Annamalai et al. (2011) examined future climate change scenarios for the Cauvery
river basin using dynamical downscaling method. More specific scenarios studies for
the CDZ were reported by Geethalakshmi et al. (2011) in their study on adaptation
strategies to sustain rice production within the Indian Network for Climate Change
Assessment (INCCA) initiative of the Ministry of Environment and Forests,
Government of India. Both these studies were supported originally by the ClimaRice
project funded by the Ministry of Foreign Affairs, Norway and the Royal Norwegian
Embassy, New Delhi. Besides these, the ADB (2011) also examined downscaled
results for the Cauvery river basin for mid-century (2021-50) and end-century (2070-
2100) for SRES scenario A1B; and A2 and B2 scenarios for the end-century.
14. The predominant signal for the CDZ from these studies is that maximum and
minimum temperatures show increasing trends that are a basin-wide, while rainfall
during the NE monsoon shows increasing trend.
1.5. Organization of this report
15. After a brief introduction, the report describes the methodology and approach used
for preparing climate change projections for the CDZ. Different observational and
model data sets used for the current project are also given. The next chapter details
the baseline climate of CDZ derived from the different observational data sets and
climate models, both GCMs and RCMs. This section also presents evaluation of the
model baselines with respect to the observations. Chapter 4 on projections describes
the different future scenarios based on CIMIP5 GCMs and RCM results. The
concluding chapter provides a summary of the work and uncertainties in scenario
projections, and further efforts required.
112. Approach and Methodology
2.1. Strategy
16. As suggested in the ToRs, future climate change scenarios were generated based
on a two-tier approach using GCMs and RCMs:
i. Scenarios of temperature and rainfall changes from two CMIP 5 a select set of
GCMs. Selection of these two GCMs was based on their performance of
simulating the current climatological features of the monsoons over the Cauvery
delta. A limited subset of other climate variables like wind speed, relative
humidity, radiation etc are also provided as per their availability at daily time
scales.
ii. Regional Climate model runs for available emission scenarios (IPRC-RegCM)
and representative time horizons based on CMIP 3 boundary forcing were
analyzed to provide regionally downscaled scenarios for the CDZ.
17. Figure Figure 2-1 below outlines the strategy adopted to prepare climate change
scenarios for CDZ.
Figure 2-1 Schematic illustrating the climate scenario data generation strategy.
2.2. Spatial Domain
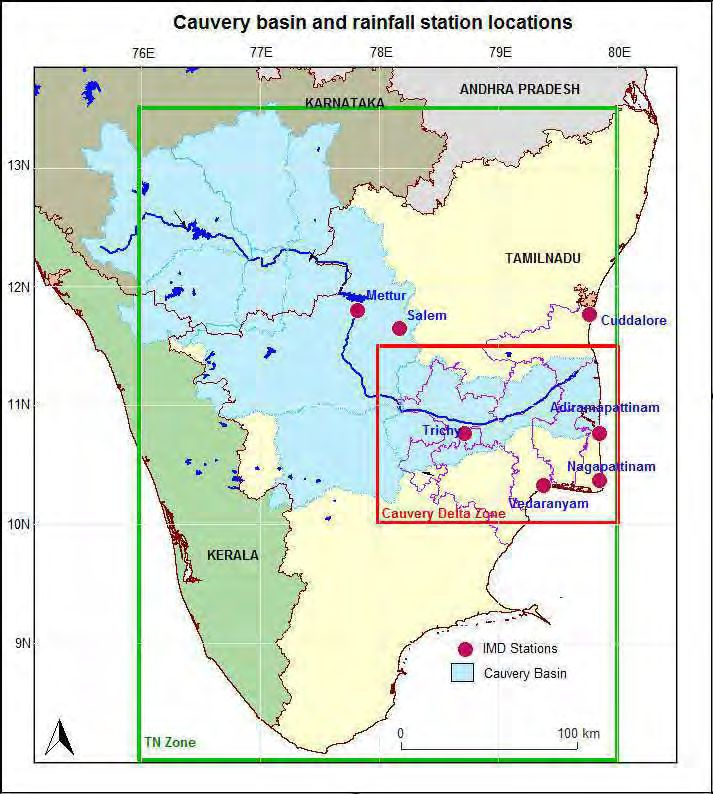
18. Two nested domains (Figure 2-2) – one larger, covering the whole Tamil Nadu (TN)
state (8.0 – 13.5oN/76.0 – 80.0oE) and another smaller, covering the core Cauvery
Delta Zone (CDZ) (10.0 – 11.5oN/78.00 – 80.0oE) were demarcated for this study.
The larger domain will enable analyses to ensure climatological consistency and
extraction of gridded data sets, to be used as required in water resources impacts
studies. All the gridded datasets are compiled for the bigger box (TN) that includes
12some areas from adjoining states besides whole of TN. The smaller box covering the
CDZ (all delta districts) is treated as a single box to create time-series for some of
the model evaluations.
Figure 2-2 Spatial domain of the study area with Rainfall station locations (red dots),
Tamil Nadu (TN – green box) and Cauvery Delta Zone (CDZ – red box)
2.3. Historical Climate Data
Station data
19. Climate data relevant to the project area are available from meteorological and
hydrological stations located in the Cauvery Basin. These observational networks are
being maintained by different agencies like the India Meteorological Department
(IMD), Central Water Commission, Tamil Nadu State Irrigation Department, Public
Works Department (PWD), Department of Agriculture, Indian Space Research
Organization and other private sector agencies. However, many of these observation
stations were set up during different times and do not have long series of data (> 30
years) that are suitable for climatological trend analysis.
20. Annex I gives a more detailed inventory of observed data sets available.
21. Daily data from 16 IMD observation stations in the Cauvery basin for the period
1971-2000 were analyzed. After quality checks, 7 stations, falling in the vicinity of the
CDZ in the TN part of the Cauvery basin having more than 90% data were selected
(Figure 2-2). The list of these stations along with their percentage of missing records
during the 1971-2003 period is given in Table 2-1.
13Table 2-1 IMD climate stations in the CDZ area used
S. No. Station Name Data missing
(%)
1. Adiramapatinam 3.6
2. Cuddalore 0.5
3. Metturdam 6.3
4. Nagapattinam 6.6
5. Salem 3.3
6. Trichy 3.0
7. Vedaranyam 9.8
Gridded IMD data
22. IMD gridded data sets for both rainfall (0.5 degree resolution; Rajeevan et al., 2009)
and temperature (1 degree resolution) have been obtained and data extracted for the
TN domain and compiled for the CDZ for 1971-2000 period to match the baseline
period for which that IMD station data were available. Gridded data represent spatial
averages and are important for making comparisons with climate model results.
APHRODITE gridded precipitation data
1
23. APRODITE gridded rainfall dataset available for the Asian region at (0.25 degree
resolution) for the period 1971-2000 is the second rainfall climatology dataset used
to compile baseline rainfall climate for CDZ.
2.4. Climate models used
24. GCM simulations available from genre of CMIP5 (Coupled Model Inter-comparison
Project phase 5) models and dynamically downscaled RCM results forced with
CMIP5 and CMIP3 lateral boundary conditions have been used for preparing
baseline and future climate change scenarios for the study area.
CMIP5 GCMs
25. Daily data for MIROC5 GCM & CCSM4 for each of these GCMs climate variables
have been downloaded from PCMDI, LLNL CIMIP5 site. Variables included rainfall
and temperature (maximum and minimum), mean sea-level pressure, wind-speed
and direction, surface incoming solar radiation and relative humidity. Annex III gives
all the details of the data availability.
26. Modelling groups from the world over have contributed data from more than one
model versions to CMIP3 and CMIP5 initiatives. Table 2-2 gives a list of the recent
CMIP5 models with daily data sets available. These simulations include the
modelling group’s best estimates of natural (e.g., solar irradiance, volcanic aerosols)
and anthropogenic (e.g., greenhouse gases, sulfate aerosols, ozone) climate forcing
during the simulation period. In contrast to CMIP3, both direct and indirect effects of
1
The APHRODITE (Asian Precipitation—Highly-Resolved Observational Data Integration Towards Evaluation of
Water Resources) daily gridded rainfall data set for Asia developed by Japanese research groups (Yatagai et al.,
2012) is a result of the APHRODITE project supported by the Water Resources initiative of the Environment
Research & Technology Development Fund, Ministry of the Environment, Japan. This dataset covers a period of
more than 57 (1951–2007) years was created by collecting and analyzing rain-gauge observation from 5000 to
12,000 stations across Asia.
14aerosols are represented in CMIP5. The availability of these large integrations
provide a unique opportunity to assess the models’ skill in simulating aspects of the
monsoons and then select few models that demonstrate high skill for further use in
preparing climate change scenarios.
2
Table 2-2 CMIP 5: List of Modelling Groups (with daily datasets)
Modelling Centre Institute ID Model Name
1. Commonwealth Scientific and Industrial Research
ACCESS1.0
Organization (CSIRO) and Bureau of Meteorology CSIRO-BOM
(BOM), Australia
2. Beijing Climate Center, China Meteorological BCC-CSM1.1
BCC
Administration
CanESM2
3. Canadian Centre for Climate Modelling and Analysis CCCMA
CanCM4
4. National Center for Atmospheric Research NCAR CCSM4
CESM1(CAM5)
5. Community Earth System Model Contributors NSF-DOE-NCAR
6. Centre National de Recherches Meteorologiques /
Centre European de Recherche et Formation CNRM-CERFACS CNRM-CM5
Avancees en Calcul Scientifique
7. Commonwealth Scientific and Industrial Research
Organization in collaboration with Queensland Climate CSIRO-QCCCE CSIRO-Mk3.6.0
Change Centre of Excellence
GFDL-CM3
8. NOAA Geophysical Fluid Dynamics Laboratory NOAA GFDL GFDL-ESM2G
GFDL-ESM2M
GISS-E2-H
9. NASA Goddard Institute for Space Studies NASA GISS
GISS-E2-R
10. National Institute of Meteorological Research/Korea
NIMR/KMA HadGEM2-AO
Meteorological Administration
HadCM3
11. Met Office Hadley Centre MOHC HadGEM2-CC
HadGEM2-ES
12. Institute for Numerical Mathematics INM INM-CM4
IPSL-CM5A-LR
13. Institut Pierre-Simon Laplace IPSL
IPSL-CM5A-MR
14. Japan Agency for Marine-Earth Science and
Technology, Atmosphere and Ocean Research MIROC-ESM
MIROC
Institute (The University of Tokyo), and National MIROC-ESM-CHEM
Institute for Environmental Studies
15. Atmosphere and Ocean Research Institute (The
MIROC4h
University of Tokyo), National Institute for
MIROC
Environmental Studies, and Japan Agency for Marine-
MIROC5
Earth Science and Technology
MPI-ESM-LR
16. Max Planck Institute for Meteorology MPI-M
MPI-ESM-P
2
As on April, 2013 accessed from PCMDI, LLNL, CMIP5 site.
1517. Meteorological Research Institute MRI MRI-CGCM3
18. Norwegian Climate Centre NCC NorESM1-M
27. For all climate models, one of the most challenging aspects is the simulation of
rainfall climatology during both summer (June-September) and winter (October-
January) monsoon seasons over South Asia. A realistic simulation of the basic state
of monsoon rainfall climatology is a key feature, for assessing the future changes
due to anthropogenic forcing particularly over the Indian region.
Assessment of Monsoon simulations
28. The simulated rainfall has been validated against observed rainfall climatology for
the period 1979-2005 constructed from Global Precipitation Climatology Project
(GPCP). The metrics used are pattern correlation (PC) and root mean square error
(RMSE).
29. Either over the broader Asian monsoon region (20S-40N, 40-180E) or over the
core rainfall region (15S-30N; 50E-160E), only few models depict statistically
significant values of PC and RMSE (Annamalai et al. 2007; Turner and Annamalai
2012: Sperber et al. 2012; Annamalai et al. 2012). Even in these few “best” models,
a further assessment of the “spatial distribution of regional rainfall maxima” suggests
limitations, particularly in the amplitude of rainfall (Annamalai et al. 2012).
30. Compared to CMIP3, higher horizontal resolutions employed in CMIP5 models
capture the topographically induced rainfall over the Asian monsoon region. This is
important since Cauvery basin is regarded as a “hot spot” with steep orography of
the Western Ghats that receive copious rainfall. Similar results are obtained for the
diagnostics performed for the winter (October-January) seasons. Note that a realistic
simulation of summer monsoon rainfall is a necessary condition for models to
capture the winter monsoon. Our analysis suggests that in models, the monsoon
circulation is better captured than the rainfall, and the systematic errors in simulating
the regional rainfall have not improved from CMIP3 to CMIP5 (Sperber et al. 2012).
Selection of GCMs
31. Based on the suite of metrics mentioned, from the pool of CMIP5 models, the latest
versions of the Community Climate System Model (CCSM4), and MIROC5 from
Japan were selected for this project. The simulations from these global models are
performed at an unprecedented horizontal and vertical resolution, an added value for
understanding and assessing “regional” changes in a warmer climate.
32. A new set of emission scenarios called the Representative Concentration Pathways
(RCPs) have been introduced. A particular RCP represents radiative forcing reached
by the year 2100, without being linked to any specific socioeconomic development
storylines as in the case of the earlier SRES.
33. Annex III gives an inventory of daily climate variables available from the modelling
groups that have contributed data to CMIP5 so far. Out of the identified CMIP5
GCMs based on their monsoon performance, only two (CCSM4 & MIROC5) have
daily data available. These are the two CMIP5 GCMs identified to be used in this
project. Baseline and future time horizons up to 2050s will be analysed for the
16TNCDZ project area for two future (RCP) scenarios viz. RCP45 and RCP85,
representing medium and high emission futures.
Regional Climate Model (RCM)
34. The International Pacific Research Center (IPRC) regional climate model
(IPRC_RegCM) has been used to simulate the current and future climates over the
project location. The regional model’s was set up with appropriate domain and
resolution based on prior experimentation. It has been demonstrated to realistically
simulate observed climate characteristics, particularly the seasonal rainfall features
over the Tamil Nadu area and the Cauvery river basin when forced with lateral
boundary conditions from the European Center for Medium-range Weather
Forecasting (ECMWF) reanalysis data (Annamalai, 2011). It must be mentioned here
that at the time of initiation of this current project, there were not many regional
modeling results available for the South Asian region at below ~50 km spatial
resolution, whereas such high resolution regional climate scenarios were required to
capture the climate of the region influenced by steep topography of the eastern
Ghats.
35. Our collaborating research partner IPRC, University of Hawaii, provided the regional
modeling results. IPRC’s regional climate model was used for the dynamical
downscaling study, and all the model data analyses were undertaken collaboratively
with Dr. Annamalai, IPRC.
36. IPRC-RegCM used in this study has 28 vertical levels with high-resolution in the
planetary boundary layer. The lowest model level is roughly 25 m above the surface.
The model domain extends from 50ºS to 55ºN, 5ºE to 170ºE with a grid spacing of
0.25º (~30 km horizontal resolution), in both zonal and meridional directions. For
RCM baseline two sets of data - runs downscaled from GCMs CCSM4 and
GFDL_CM2.1 have been prepared. As CCSM4 GCM is from the current genre of
CIMIP5 GCMs, it will enable comparisons with the parent GCM.
2.5. Delivered Data sets
37. The current climate was characterized using available observed data sets that
included global, regional and national gridded data sets; and observations from
individual stations. Model baseline climates were established using historical runs
from comparable time periods from select CMIP 5 models and available RCM
results. The select CMIP5 models were evaluated for their ability to simulate regional
precipitation patterns and circulation features associated with both the summer and
winter monsoons that influence the study area.
38. All relevant observed data sets and model results have been subjected to basic
statistical analysis. Key features of the baseline (present-day climate from observed
data sets and climate model twentieth century runs) and future climate change (as
projected by selected GCMs and RCM simulations) for the period representing the
2050s - expressed in relevant statistics over the sub-basin were computed.
39. Table 2-3 below lists the climate data sets delivered by the project.
Table 2-3 List of different baseline and climate model data sets produced**
Data Details Parameters Time slice Frequency
Quality Station observatory for Rainfall (mm/day), 1971-2000 Daily
17checked daily seven locations Maximum temperature
climate data Adiramapattinam, (◦C), Minimum temperature
from IMD Cuddalore, Mettur, (◦C),
Stations in the Nagapattinam, Salem,
CDZ area Trichy and Vedaranyam.
IMD gridded Gridded data at 1x 1 Rainfall (mm/day), 1971-2000 Daily &
resolution for Maximum temperature Monthly
temperature and 0.5 x (◦C), Minimum temperature
0.5 for rainfall fields (◦C),
covering TN domain
GCM MIROC5 Baseline Rainfall (mm/day), 1981-2000 Daily
Projection (RCP45) Maximum temperature 2006-2100 Daily
Projection (RCP85) (◦C), Minimum temperature 2006-2100 Daily
(◦C), Surface Downwelling
Shortwave Radiation (rsds
in wm-2), ), Sea Level
Pressure (psl in Pa), Near-
Surface Specific Humidity
(huss in kg/kg), Eastward
Near-Surface Wind (uas in
ms-1), Northward Near-
Surface Wind (vas in ms-1)
GCM CCSM4 Baseline Rainfall (mm/day), 1981-2000 Daily
Projection (RCP45) Maximum temperature 2006-2100 Daily
Projection (RCP85) (◦C), Minimum temperature 2006-2100 Daily
(◦C Sea Level Pressure
(psl in Pa),
RCM GFDL Baseline Irradiance (MJ m-2), Min 1981-2000 Daily
Projection Temperature (oC), Max 2021-2050 Daily
Temperature (oC), Early
Morning VP (kPa), Mean
Wind Speed (m s-1) ,
Precipitation (mm d-1),
Dew point temp ( oC),
Relative Humidity (%),
RCM CCSM4 Baseline Irradiance (MJ m-2), Min 1986-2005 Daily
Projection Temperature (oC), Max 2081-2100 Daily
Temperature (oC), Early
Morning VP (kPa), Mean
Wind Speed (m s-1) ,
Precipitation (mm d-1),
Dew point temp ( oC),
Relative Humidity (%),
Bias corrected Baseline Rainfall (mm/day), 1981-2000 Daily
RCM GFDL Projection 2021-2050 Daily
**Blue text pertains to observed climate or model baseline data.
Data extraction
40. Three/four broad categories of data sets have been developed for use keeping in
view a range of users with different levels of experience in using climate model data
sets.
41. The originally available GCMs and RCMs are in netcdf (*.nc) gridded binary format,
with control files (*.ctl) that describe the data for use in Grid Analysis and Display
System (GrADS) a popular open source tool for display and analysis of earth
18sciences data. Using GrADS package, data has been extracted for zone wise and
station wise. Zonal daily time series data (baseline and projection of GCMs and
RCMs) were extracted by averaging all the grids in the spatial extent of the zones
Tamil Nadu (TN) zone (76E-80E & 8N-13.5N) and Cauvery Delta Zone (CDZ) (76E-
80E & 10N-11.5N). Station wise daily time series of climate scenarios data were
generated only for RCMs (baseline and projection of 2 RCMs) by averaging nearest
four grid points for each of the seven IMD station locations. These station locations
can be taken as representative points for the CDZ. Details of the grids averaged and
spatial extent are available in Annex III. All the extracted daily time series datasets
are in csv text format to enable easy import to most GIS and hydrological/hydro-
dynamical modeling software.
42. Estimates of rainfall amount associated with 1 in 2, 5, 10, 20, 50, 100 and 200 year
events, respectively; estimates of rainfall amount at median, 50%, 80%, 90% and
95% confidence levels, respectively for the three seasons; estimates of rainfall
depths for duration of hourly (if data available), daily, 2-days, 5-days and 10-days,
respectively;
43. Datasets were organized under four major sections (four main folders) 1. RAW (grid
wise GCM and RCM output in text format) 2. Zone wise (GCM and RCM outputs
averaged for two major zones Tamil Nadu and CDZ) 3. Station wise (RCM outputs
averaged for seven selected IMD station location) 4. Derived (Rainfall return period,
Probability of rainfall occurrence and rainfall depths for seven IMD station location),
and details of each of the sections are explained in detail in Annex III.
Bias correction
44. Despite all efforts to improve regional climate simulations, uncertainties in GCM
simulations cascade when downscaling is performed. Therefore strictly speaking,
any direct comparison with observations can at best provide us guidance of the
model uncertainties that then helps us to assign confidence levels to the climate
change projections, both in GCMs and RCMs.
45. Rainfall field from one of the RCM runs has been bias corrected using statistical
techniques. These data have also been extracted and analyzed for basic and derived
statistical parameters.
2.6. Tropical Cyclones Analysis
46. Considering the importance of Tropical cyclones to the CDZ, trends have been
examined using historical records, published research and diagnostics based on
long-term numerical re-analysis data, RCM baseline and projections.
47. A recent cyclone tracking technique was applied to observations, and coarse-
resolution climate model and high-resolution regional climate model simulations. The
analysis was performed during both the southwest and northeast monsoon seasons,
and for baseline and future climate scenarios. The dynamical downscaling runs used
were conducted by forcing the IPRC regional model (IPRC_RegCM) with lateral and
boundary conditions taken from the coarse-resolution climate models (CMIP3/5) that
“best” capture the current monsoon rainfall climatology and its variations (Annamalai,
2013).
193. Baseline climate and evaluation
3.1. Observed climatology
Seasonality
48. Climate normal of a variable is represented as an average, typically for a 30-year
period. The seasonality can be expressed as the temporal evolution of this climate
normal and illustrates the timing of the maximum and minimum during a year. It is an
effective indicator of climate of a location, area or region. It is useful to therefore
compare the seasonal cycles of temperatures and rainfall over the whole of the Tamil
Nadu (TN) state as well as the particular project area, the Cauvery Delta Zone
(CDZ). Comparing observed present day climate with model baseline also provides a
good indicator of the model performance.
Temperature
Figure 3-1 Seasonal Cycle of maximum and minimum temperature IMD stations and IMD gridded
data set over TN (top panel) and CDZ (bottom panel).
49. The highest values of maximum and minimum temperatures are encountered during
the summer months of April-May, while the lowest values are observed during
December-January months over the whole region (Figure 3-1). There are, however,
clear differences between the stations near the coast and the more inland stations.
Maximum temperature observed in interior places (Trichy, Salem and Mettur) show
higher values compared to coastal stations (Cuddalore, Adhiramapatinam and
Vedaranyam). However, further inland towards the western region of Tamil Nadu,
20lower temperatures are encountered because of elevated orography of the “Ghats”
or mountainous tracts. Influence of the SW monsoon is seen in the maximum
temperature series of IMD gridded as lowered temperature during the June to
September months. This east-west temperature gradient in maximum temperature
during spring months (MAM) is clearly brought out by the baseline temperature
analysis using the IMD gridded data shown in Figure 3-2. The coarser resolution of
the IMD data is however unable to clearly differentiate the slightly lower
temperatures of the CDZ due to the coastal influence.
Figure 3-2 Distribution of maximum temperatures over Tamil Nadu during March-April-May
season –based on IMD gridded data
Rainfall
Trichy
Seasonal cycle of Rainfall - TN & CDZ Zone
450 Nagapattinam
400 Adhiramapattinam
350 Vedaranyam
Rainfall mm
300
Salem
250
Mettur
200
150 Cuddalore
100 APH_TN
50 APH_CDZ
0 IMD_TN
Jan Feb Mar Apr May Jun Jul Aug Sep Oct Nov Dec
IMD_CDZ
Months
Figure 3-3 Seasonal cycle of Rainfall – IMD gridded, Aphrodite gridded &IMD stations for TN and
CDZ zones
2150. The peculiarity of rainfall seasonal cycle Tamil Nadu is the competing effect of the
Southwest (SW) and the Northeast (NE) monsoon along an east-west direction. Over
CDZ, the dominating influence of NE monsoon is clearly seen as highest monthly
normal rainfall amounts during the Oct-Nov-Dec months (Figure 3-3). Part of the
higher rainfall amounts recorded during the months of November and December at
Coastal stations like Nagapattinam, Vedaranyam, and Cuddalore may be attributable
to cyclonic activity. Moving westwards towards the inland areas of the Cauvery basin
there is greater influence of the SW monsoon, as apparent from the June-September
monthly normal of rainfall. Both IMD and Aphrodite gridded rainfall data sets are able
to pick up the increased rainfall over TN compared to CDZ during the SW monsoon
season (June-September), similar to the observed station data. Figure 3-4 shows the
spatial distribution of rainfall over the Tamil Nadu region during two rainy seasons
viz. SW (JJAS) and NE (OND). The higher rainfall amounts over CDZ during NE, as
compared to SW monsoon season is quite clearly brought out on a spatial scale.
Figure 3-4 Distribution of rainfall during summer monsoon (JJAS) and winter monsoon (OND)
seasons based on IMD gridded data
Trends
51. Basic statistics of the important climate variables namely maximum and minimum
temperature and rainfall have been computed for the baseline period (1971-2000) for
all available observed data sets. In the following section the observed trends are
presented. The trends and basic statistics are presented for the different seasons as
outlined in the terms of reference for the project.
22Temperature
52. Figure 3-5 shows the time-series of yearly averages of maximum temperature
anomalies3 for the whole CDZ zone from the IMD gridded data. Similar time-series
are also plotted for two representative stations - Trichy (inland location) and
Cuddalore (coastal location). Lower panel of Figure 3-5 shows the anomaly time-
series for annual average of minimum temperature. A warming tendency can be
seen in almost all the temperature time-series. Despite the warming trend year-to-
year variations are also quite prominent. Similar time-series plots have been
presented in Figure 3-6 & Figure 3-7 for the spring (March-April-May, MAM) and
northeast monsoon (OND) seasons. shows the temperature trends over the CDZ
during different seasons based on both IMD gridded data and station observations.
Except for Vedaranyam station all other stations exhibited positive temperature
trends in maximum and minimum temperatures.
Figure 3-5 Year-to-year variations of maximum and minimum temperature anomalies over the
CDZ
3
Anomalies are deviations of the maximum temperature averages of each year from the long-term mean
calculated based on a 30-year period (1971-2000).
23Figure 3-6 Year-to-year variations of summer season (MAM) maximum and minimum
temperature anomaly in CDZ
24Figure 3-7 Year-to-year variations of maximum and minimum temperatures over CDZ during
the NE monsoon season (OND).
Table 3-1 Observed Temperature trends over CDZ using IMD gridded data
Trend in °C/10 year
Data
Annual JF MAM JJAS OND
TMAX
IMD gridded 0.20 0.32 0.25 0.12 0.18
IMD stations
Trichy 0.19 0.22 0.24 0.10 0.23
Cuddalore 0.33 0.59 0.39 0.13 0.38
Adhiramapatinam 0.16 0.23 0.18 0.10 0.16
Vedaranyam 0.13 0.13 0.14 -0.15 0.15
TMIN
IMD gridded 0.11 0.25 0.11 0.07 0.07
IMD stations
Trichy 0.12 0.42 0.09 0.03 0.06
Cuddalore 0.23 0.42 0.21 0.17 0.20
Adhiramapatinam 0.07 0.33 0.06 0.01 -0.02
Vedaranyam -0.13 -0.31 0.16 -0.24 -0.20
25Rainfall
53. Figure 3-8 shows the variations in the observed rainfall over the CDZ during the
historical baseline period. There are no clear trends discernable but during the
northeast monsoon season (OND), more number of weak monsoon years (negative
anomalies) is observed. This, combined with a warming tendency (Figure 3-7)
implies hardship for water resources.
Figure 3-8 Inter-annual variations of precipitation (IMD gridded, APHRODITE gridded and IMD
station data during summer monsoon (JJAS) and northeast monsoon seasons
3.2. Basic statistics
54. Table 3-2 & Table 3-3 give the basic statistics for baseline temperatures (maximum
and minimum) as computed from the different observed historical and model
historical runs for the baseline period 1971-2000. The shaded rows in the Tables are
CDZ stations.
26Table 3-2 Maximum Temperature statistics for the CDZ
Season JF MAM JJAS OND
Data sources Mean SD CV Mean SD CV Mean SD CV Mean SD CV
IMD gridded 31.1 0.6 1.9 35.9 0.6 1.6 35.2 0.5 1.3 30.7 0.5 1.5
IMD stations
Trichy 31.4 0.7 2.3 37.0 0.8 2.0 35.9 0.6 1.7 30.7 0.6 2.0
Adiramapatinam 30.7 0.7 2.2 33.8 0.9 2.6 34.0 0.6 1.7 30.4 0.5 1.6
Cuddalore 29.5 0.7 2.4 34.1 0.5 1.6 35.2 0.5 1.5 30.0 0.5 1.6
Mettur 33.0 0.7 2.0 37.5 0.5 1.4 34.4 0.5 1.5 31.6 0.6 1.9
Nagapattinam 28.9 0.6 2.1 33.5 0.5 1.5 35.4 0.6 1.6 30.0 0.4 1.4
Salem 33.2 0.9 2.7 37.4 0.7 1.9 33.9 0.7 2.0 31.3 0.7 2.3
Vedaranyam 29.7 0.8 2.5 33.6 0.8 2.3 33.8 0.7 2.0 30.1 0.7 2.4
GCM CCSM4 27.5 0.5 1.7 33.2 1.3 3.9 30.5 0.7 2.2 28.6 0.3 1.0
GCM MIROC5 29.3 0.7 2.3 33.5 0.6 1.8 33.3 0.7 2.0 29.8 0.6 1.9
RCM CCSM4 31.5 0.8 2.4 37.3 0.7 2.0 36.0 0.6 1.7 30.9 0.5 1.7
RCM GFDL 31.3 0.8 2.5 38.1 0.4 1.1 36.4 1.0 2.6 34.0 2.2 6.4
Table 3-3 Minimum Temperature statistics for CDZ
Season/ JF MAM JJAS OND
Data sources Mean SD CV Mean SD CV Mean SD CV Mean SD CV
IMD gridded 21.1 0.7 3.5 25.3 0.5 2.0 25.5 0.3 1.1 22.8 0.4 1.7
IMD stations
Trichy 20.8 0.8 3.8 25.3 0.6 2.4 25.8 0.3 1.2 22.7 0.4 1.8
Adiramapatinam 21.0 0.8 3.9 25.7 0.5 1.8 25.8 0.5 1.9 23.2 0.5 2.4
Cuddalore 20.7 1.0 4.7 25.1 0.5 2.0 25.6 0.5 1.9 22.7 0.5 2.4
Mettur 20.9 0.9 4.2 25.2 0.7 2.7 24.2 0.6 2.4 22.1 0.6 2.7
Nagapattinam 22.9 0.8 3.6 26.4 0.7 2.5 26.3 0.3 1.2 24.1 0.4 1.8
Salem 19.5 0.8 4.2 24.0 0.6 2.6 23.2 0.5 2.0 20.9 0.5 2.5
Vedaranyam 22.5 1.0 4.6 25.2 1.0 3.8 25.4 0.9 3.6 23.1 0.9 4.0
GCM CCSM4 21.8 0.8 3.4 24.4 0.8 3.3 25.6 0.4 1.4 24.4 0.4 1.8
GCM MIROC5 21.7 0.6 2.9 25.3 0.5 2.1 26.1 0.4 1.5 23.6 0.3 1.4
RCM CCSM4 21.0 0.6 2.8 25.5 0.6 2.3 25.8 0.3 1.2 22.7 0.4 1.9
RCM GFDL 15.7 0.8 5.2 19.4 0.6 3.3 20.4 0.6 2.8 17.4 0.6 3.2
55. From these tables it is clear that during coolest months there is a better agreement in
minimum temperatures range, i.e., 21-23°C. The IMD gridded data set shows a
27baseline average of 21.1°C for minimum temperatures during January-February (JF)
for the CDZ and the corresponding GCM and RCM mean values fall within the range
21.0 – 21.8°C. The RCM forced by GFDL however seems to have a cold bias, about
~5.0 °C below observed values.
56. The maximum temperatures during the hottest months March, April & May (MAM)
from various baseline datasets fall within a range 33.2 – 37.3°C, and the range is
larger as compared to the minimum temperature range. The IMD gridded data set
shows a baseline average of 35.9°C with CCSM4 value of 33.2oC and 33.5°C for
MIROC5, indicating a probable cold bias over the CDZ area. Some of the coastal
stations show lower mean temperatures perhaps under the maritime influence
(Figure 3-9), which is may be pronounced in the GCMs. This aspect would require
further research to clearly identify the reason. The RCM results however show a
higher mean maximum temperature (37.3°C) that is closer to the IMD gridded
baseline estimates. Figure 3-9 below compares maximum temperatures during the
seasonal extremes.
JF' MAM'
35# 38#
Maximum'Temp'(C)'
33# 37#
Maximum'Temp'(C)'
31# 36#
35#
29#
34#
27#
33#
25# 32#
23# 31#
IR #
#
T#
M 4#
#C #
#
Tr #
D#
SA G#
VE #
CC R#
Tr d #
#
SA #
VE #
M 4#
#C #
#
D#
T#
AD y#
CC #
M C5
id
AD y
AM
M
M
M C5
AM
G
M
M
DR
ich
ET
SM
D
CU
NA
SM
i
ich
ET
Gr
CU
NA
LE
CS
Gr
CS
LE
RC IRO
RC IRO
D#
M
IR
D#
M
IM
IM
Figure 3-9 Baseline Maximum temperatures from station observations, IMD gridded data and
GCM/RCM simulations during cooler months (JF) and hot season (MAM) over CDZ.
(Gridded data sets are presented in different colors: red IMD, brown CCSM4 & MIROC5 GCMs and red hash is RCM forced by
CCSM4)
57. In general, both GCMs seem to be underestimating the maximum temperature
evolution during all seasons as seen in Figure 3-10 below. The regional climate
model (RCM), which is driven, by one of the GCMs (CCSM4) overestimates the
maximum temperatures. The error bars in Figure 3-10 indicate the spread amongst
the observed data sets. Both GCMs show 2-3°C cooler mean maximum
temperatures during most of the seasons. The RCM baseline is 1-2°C warmer during
summer and SW monsoon season and quite close to the observed temperatures
during the NE monsoon and the cooler months of JF. Thus, RCM appears to capture
the regional characteristics well.
28IMD#OBS# CCSM4#GCM# MIROC5#GCM# RCM#CCSM4#
39#
37#
35#
Maximum'Temp'(C)' 33#
31#
29#
27#
25#
JA# MAM# JJAS# OND#
Figure 3-10 Mean maximum temperatures over CDZ during different seasons.
58. Table 3-4 presents the basic statistics of rainfall over the CDZ from different baseline
data sources. There are significant differences between different stations and the
different observed datasets. As the main rainy months over the project area are the
Southwest monsoon season (June, July, August and September: JJAS); and the
Northeast monsoon season (October, November and December: OND) the
discussion here will focus on these seasons.
Table 3-4 Rainfall basic statistics over CDZ
Season JF MAM JJAS OND
Data sources Mean SD CV Mean SD CV Mean SD CV Mean SD CV
IMD gridded 28.4 44.9 158.2 90.9 32.8 36.1 299.6 71.6 23.9 471.3 162.4 34.5
Aphrodite 41.2 58.3 141.6 108.2 42.2 39.0 354.6 106.0 29.9 589.0 203.2 34.5
IMD stations
Trichy 21.0 41.1 196.2 99.5 67.6 67.9 338.9 119.4 35.2 390.4 197.5 50.6
Adiramapatinam 56.4 87.4 154.9 120.8 77.9 64.5 316.4 152.0 48.1 641.4 323.9 50.5
Cuddalore 51.0 90.4 177.1 50.7 50.2 99.0 375.4 136.2 36.3 763.7 296.7 38.9
Mettur 10.7 16.7 156.4 182.6 71.0 38.9 378.2 106.5 28.1 319.9 173.1 54.1
Nagapattinam 74.2 112.7 151.8 79.0 65.5 82.9 260.1 99.3 38.2 919.9 280.5 30.5
Salem 8.5 19.5 229.2 152.0 65.6 43.1 502.1 167.3 33.3 286.9 127.8 44.5
Vedaranyam 88.4 120.2 135.9 71.3 52.1 73.0 225.1 135.3 60.1 922.4 304.3 33.0
GCM CCSM4 100.1 105.3 105.2 142.4 95.8 67.3 718.8 166.6 23.2 711.0 176.3 24.8
GCM MIROC5 44.0 38.6 87.8 129.9 43.8 33.7 311.7 109.9 35.3 358.8 105.5 29.4
RCM CCSM4 89.2 40.0 44.8 139.4 102.5 73.6 575.0 115.2 20.0 621.8 312.6 50.3
RCM GFDL 25.7 19.1 74.1 23.9 23.2 97.0 268.3 97.5 36.4 111.2 105.5 94.9
2959. During the SW monsoon season the range of rainfall observed is about 260 – 500
mm as compared to 320 – 900 mm observed during the NE monsoon season over
the IMD stations in the CDZ area. The two gridded rainfall data sets also show
differences, with APHRODITE showing higher rainfall as compared to IMD gridded
data set. The difference is about 50 mm during the JJAS and about 118 mm during
the OND season as estimated during the baseline period. These ranges indicate
approximately the degree of uncertainty in rainfall observations.
60. Figure 3-11 below shows the differences in rainfall amongst the various baseline
datasets during the two major wet seasons over the CDZ area. While the station
averages roughly indicate the spatial variations, the differences amongst the two
gridded datasets gives an idea of the range of uncertainty in rainfall estimation over
the area.
Figure 3-11 Baseline rainfall from IMD stations, gridded datasets and GCM/RCMs
61. During the SW monsoon season the CCSM4 shows a wet bias while the MIROC5
GCM rainfall baseline is quite similar to observations. The RCM that is forced by the
CCSM4 also displays a wet bias, but is lower than the parent GCM. In the NE
monsoon season the models seem to be in better agreement with the observed
rainfall, with values falling with the range of uncertainty of observations. Figure 3-12
below shows the seasonal rainfall for all the seasons along with uncertainty envelops
computed using standard error estimates.
30IMD"OBS" CCSM4"GCM" MIROC5"GCM" RCM"CCSM"
800"
700"
600"
500"
400"
300"
200"
100"
0"
JF" MAM" JJAS" OND"
Figure 3-12 Observed Seasonal rainfall from IMD stations and gridded datasets compared
with GCM and RCM simulated baseline values
3.3. Evaluation of GCM and RCM
Temperature seasonal cycle
62. Both the GCMs, and the RCMs capture the seasonal evolution in maximum
temperature as observed but with a cold bias in GCMs as already noted from the
results shown in the Tables 3 & 4 in the preceding section. The CCSM4 GCM shows
a cold bias in its simulations of maximum temperatures over the CDZ. The bias
becomes particularly pronounced during the southwest monsoon months (Figure
3-13). Downscaled results of CCSM4 show a slight warm bias in maximum
temperatures. The MIROC5 model seems to be simulating the observed
temperatures fairly well.
31Figure 3-13 Evaluation of GCM (CMIP5 MIROC5 & CCSM4), RCM (GFDL 2.1 & CCSM4) maximum
temperature seasonal cycle with observations.
32Figure 3-14 Evaluation of GCM (CMIP5 MIROC5 & CCSM4), RCM (GFDL 2.1 & CCSM4) minimum
temperature seasonal cycle with observations.
63. In the case of minimum temperature evolution, both GCMs capture the observed
seasonal cycle but the RCMs counterparts simulate too cold a bias (Figure 3-14).
This seems to be persistent problem, particularly affecting the downscaling results
from GFDL CM2.1 results.
Rainfall Seasonal cycle evaluation
64. Despite the evaluation is performed on a smaller region, both the GCMs and RCMs
depict the seasonal cycle in rainfall that is remarkable. One possible interpretation
could be - rainfall seasonal cycle, which is governed by large-scale processes, is
perhaps well represented in the climate models. The difference is, however, in the
amplitude of the simulated rainfall (Figure 3-15). Figure 3-16 shows a similar plot of
bias corrected GFDL RCM rainfall time-series.
33You can also read