The Importance of Monitoring River Water Discharge - Frontiers
←
→
Page content transcription
If your browser does not render page correctly, please read the page content below
POLICY BRIEF
                                                                                                                                             published: 26 October 2021
                                                                                                                                         doi: 10.3389/frwa.2021.745912

                                            The Importance of Monitoring River
                                            Water Discharge
                                            P. J. Depetris 1,2*
                                            1
                                             Academia Nacional de Ciencias, Córdoba, Argentina, 2 Focal Point, Water Program of the Inter-American Network of
                                            Academies of Science, Córdoba, Argentina

                                            River discharge time series, originally recorded to anticipate floods and water
                                            scarcity, later became indispensable to design hydroelectric dams. Presently, discharge
                                            monitoring aids in detecting climatic and environmental change, because the discharge
                                            and quality of river water are functions of many climatic, biological, geological, and
                                            topographic variables coexisting in the basin. Climate change is altering the atmospheric
                                            precipitation distribution pattern-both, in time and space-as well as the occurrence of
                                            extreme climatic events. It is important the global upgrading of river gauging networks
                                            to unveil hydrological trends and changing atmospheric patterns. In so doing, discharge
                                            monitoring stations–and the resulting time series-may be, as well, invaluable in revealing
                                            the role played by significant environmental variables.
                                            Keywords: streamflow, river monitoring, ENSO effect, discharge trend, drainage basin, Paraná river, climatic effect

                             Edited by:
                        Subimal Ghosh,
                                            INTRODUCTION
         Indian Institute of Technology
                          Bombay, India     Rivers are essential features for our planet’s habitability. Following the etymology of the term, it
                                            appears that in ancient times a river was mostly defined by the channel in which water flows rather
                         Reviewed by:
                        Anamitra Saha,
                                            than denoting the water it conveys1 . This was possibly linked to the fact that rivers were frequently
            Massachusetts Institute of      used as natural borders separating different communities, not necessarily coexisting in friendly
            Technology, United States       terms. In any case, the immense significance reached by rivers in the development of humanity
                          Jisha Joseph,     became apparent soon in its history. Since early times, rivers were easily reachable sources of
         Indian Institute of Technology     freshwater, relatively inexpensive means of transportation, and effortlessly accessible sources of
                          Bombay, India     proteins. Unfortunately, these obvious benefits contrasted with disastrous floods or droughts with
                 *Correspondence:           which, with variable frequency, rivers showed their might. In order to foresee times of hunger,
                        P. J. Depetris      abundance, or catastrophe, Egyptians gauged the Nile River by means of nilometers2 , measuring
           pedro.depetris@gmail.com
                                            river water height (i.e., a discharge proxy) for millennia (e.g., Eltahir and Wang, 1999 and references
                                            therein). These gauging structures continued to be useful until modern times, when the Nile’s
                    Specialty section:
                                            natural flow was modulated, mainly by the Aswan High Dam.
          This article was submitted to
                     Water and Climate,
                                               The human response to such fluvial unpredictability was the building of barrages to prevent
                a section of the journal    devastating floods, to irrigate crops, or to store water to ameliorate foreseeable water scarcity3 .
                       Frontiers in Water   The construction of structures across rivers to hold back water led to the development of more
            Received: 22 July 2021
                                            truthful methods to approach river flow than measuring river water height (i.e., as in Egypt’s
      Accepted: 09 September 2021           nilometers), keeping historical discharge records, so as to fully understand and forecast river
        Published: 26 October 2021

                            Citation:       1 River has its roots in the Latin word riparius (i.e., from ripa, “bank of a river”), and then, from Anglo-Norman rivere, and
Depetris PJ (2021) The Importance of        Old French riviere; rive, French for “shore” or “bank”.
  Monitoring River Water Discharge.         2 There are three types of nilometers along the Nile: one is near Cairo, another is in Elephantine Island, at Aswan, and the
              Front. Water 3:745912.        third kind is a little further north, at the Temple of Kom Ombo.
    doi: 10.3389/frwa.2021.745912           3 Mesopotamians built dams in present-day Jordan (4th century B.C.E.), and Romans, in Spain (1st−2nd century C.E.).

Frontiers in Water | www.frontiersin.org                                           1                                           October 2021 | Volume 3 | Article 745912
Depetris Importance of River Monitoring
discharge variability. Adding to the original objectives, the and the almost insignificant relative presence of rivers in the
current worldwide environmental crisis has shown that river freshwater budget, they supply ∼50 per cent of the water
discharge monitoring is, as well, a meaningful tool to interpret humanity has at its disposal to fulfill all its drinking needs,
changes occurring within drainage basins. To meet future global and ∼57 per cent of the water used for irrigation (UNESCO
challenges in such context, many countries should modernize WWAP, 2021)7 . Unquestionably, these figures put in the correct
to state-of-the-art river flow monitoring networks, employing perspective the importance of freshwater resources for the future
techniques like acoustic Doppler instrumentation, early-warning of humanity, particularly in a climate change scenario8 .
systems, remote sensing, real-time data delivery4 , or improving
rainfall-runoff modeling to assist in the assessment of climate
and land use changes (e.g., Anderson et al., 2005). The previous
observations turn out to be particularly significant because the POLICY OPTIONS AND IMPLICATIONS
existing river flow databases [e.g., Global Runoff Data Center
(GRDC), and UNH CSRC Global River Discharge (RivDIS)], The topmost factor that might affect river flow in a drainage
generally supply partial images on the current status of discharge basin would be a supply of water, thus making weather9 and
monitoring global networks, limiting data to a subset of all climate—i.e., briefly described as “the statistics of weather” (Von
the available stations in each country (i.e., those considered Storch, 2005)-, important items to consider. Even with adequate
significant, usually supplying the system’s total discharge), and water supply, river discharge and runoff might be influenced
almost always omitting information on the methodology used to in a number of ways by the features (i.e., natural or caused
generate the databases. by humans) predominant in drainage basins. Rivers, delivering
The target of this policy brief is to show that even though freshwater and the byproducts of continental denudation to
the significance of the initial goals of river flow monitoring world oceans, integrate all the involved exogenous processes
still preserve their original worth, the resulting time series are at continental scale. The physical characteristics affecting river
valued means to unveil climate-induced discharge trends and discharge and runoff, has been traditionally divided in two
to detect environmental problems within the basin. Europe’s distinct classes: (a) conditions inherent in the natural landscape,
recent disastrous flooding took most hydrologists by surprise5 , and (b) conditions in which nature has been transformed by
reiterating that climate change is a major challenge for humanity the human use of the land. Basin elevation and orientation,
and, hence, it is of utmost importance to build robust data bases topography (shape and slope), geology, and soil type are the more
so that controlling floods, water scarcity, and preserving water conspicuous natural features. There are few places in the planet
quality are actions that should be based on the most advanced where vegetation remains pristine. Deforestation, agriculture
technologies, securing efficient real-time data availability to all or urban developments are the practices having the most
parties concerned. general influence on natural drainage, while dam construction
and waterway alteration (i.e., channelization) impact on river
flow dynamics. Although they are not frequently included as
THE SIGNIFICANCE OF RIVERS IN THE relevant factors intervening in basin’s system, rate of change
HYDROLOGICAL CYCLE and uncertainty are important in assessing low-(e.g., climatic
fluctuations, topography, soil types) and high-frequency (e.g.,
About 2.5 percent of the Earth’s water mass (∼1.4 109 km3 ) weather variability, vegetation cover, land use) processes affecting
corresponds to freshwater. Rivers and freshwater lakes – drainage basins as integral units (e.g., Koutsoyiannis, 2013).
undoubtedly, the most accessible water sources - store ∼0.007 Water quantity goes hand in hand with its quality.
percent of the total water6 available for human consumption. Unfortunately, many years ago, humankind guiltlessly assumed
Milliman and Farnsworth (2011) calculated a mean riverine that rivers were unproblematic means of getting rid of waste.
global discharge of ∼36000 km3 y−1 , of which 55 percent is As years passed and human beings progressed in their welfare,
jointly supplied by Asia and Oceania (∼11000 km3 y−1 ) and recreation was added to the list of benefits rendered by rivers
the Amazon River (∼8600 km3 y−1 ). This skewed discharge although, concurrently, pollution remains a largely unsolved
distribution is determined by atmospheric precipitations, which problem on a worldwide basis (e.g., Issakaa and Ashrafa, 2017:
are significantly higher in the latitudinal belt comprised between Sasakova et al., 2018). Recently, the water quality scenario in
∼20◦ N and ∼20◦ S (e.g., Dai and Trenberth, 2002; Dai et al., 2009; the Americas has been thoroughly surveyed (IANAS, 2019),
Milliman and Farnsworth, 2011). and international agencies, like UNEP, FAO, and UNESCO,
Besides their role as freshwater suppliers, rivers contribute
to support dynamic and assorted life-sustaining systems, in the
rivers themselves, and in estuaries and the contiguous marine 7 According to the FAO, groundwater provides drinking water to at least the
environment. In spite of the ostensible scarcity of freshwater
remaining 50% of the global population.
8 By 2030, the world is projected to face a 40% global water deficit under the
4 The U.S. Geological Survey introduced real-time data delivery in 1995. business-as-usual climate scenario (UNESCO WWAP, 2021).
5 https://www.sciencemag.org/news/2021/07/europe-s-deadly-floods-leave- 9 Defined as “the instantaneous state of the atmosphere at a particular location,
scientists-stunned (accessed August 22, 2021). typically characterized by a range of meteorological variables (or weather elements)
6 https://www.usgs.gov/special-topic/water-science-school/science/ such as pressure, temperature, humidity, wind, cloudiness, and precipitation”
fundamentals-water-cycle? (accessed August 3, 2021). (Mckendry, 2005, and references therein).
Frontiers in Water | www.frontiersin.org 2 October 2021 | Volume 3 | Article 745912Depetris Importance of River Monitoring
are continuously dealing with this menace, seeking to raise time series allow attaining a historical view on climate change
worldwide concern and find innovative solutions10 . and other environmental modifications. It comes as a logical
Climate, being the most important variable governing riverine conclusion, then, that the design of a discharge monitoring
flow incorporates, not only the long-term moisture supply, but network seeking construction of dams may be coincidental
also the day-to-day weather pattern that governs the timing or may differ from a network conceived as a tool to gain
and total quantity of water delivered to drainage basins by the crucial environmental information. Besides considering technical
atmosphere. Included here are storm types, typical duration and factors (topographic, hydrological, geological, etc.), which may
intensity of rainfall or snowfall, distribution of precipitation be common to both, one focuses primarily on the cost-benefit
over the drainage basin, and reliability of precipitation over analysis of the forthcoming dam, whereas the other centers in
a period of years, all of which are perceived as significantly the efficient recording of climatic-environmental information.
distorted by climate change. Extended (e.g., longer than 50 Relevant examples involving drainage basins may be probing into
years) precipitation or river flow time series frequently exhibit the effect of a shifting-crop policy, differences in urbanization
non-stationary properties and past climate may no longer be rate, the impact of selective forest clear-cutting, alterations
considered as an accurate guide to present or future climate. in river flow not entirely accounted for by meteorological
It is clear, then, that floods and droughts are primarily factors, etc.
determined by climate. However, floods are frequently affected
by physical conditions within the drainage basin, sometimes
THE LACK OF STATIONARITY IN RIVER
acting in synergy with rainfall (e.g., increased runoff triggered by
deforestation11 ). On the other hand, efficient management of the DISCHARGE SERIES: THE PARANÁ RIVER
vegetation cover may play a favorable role maintaining base flow EXAMPLE
in streams and rivers during droughts (Olsson et al., in press).
In the late 19th and early 20th centuries, technology The first regular river discharge measurements in England began
added hydroelectric power to the benefits already assumed as on the Thames and Lea rivers in the 1880s and, currently,
supplied by these impressive structures built across rivers to the U.K.’s National River Flow Archive (NRFA) is the focal
control water flow. Later, around 1960s, dam building was point for river flow data, supporting hydrological research and
increasingly questioned when environmental awareness began water management activities13 . The United States Geological
to grow all over the world, showing that dam construction also Survey (USGS) has been collecting streamflow data for over
carried undesirable consequences to the environment. Anyhow, 100 years, ever since the first streamflow measurements were
population growth, economic development, the need to close the made in the late 19th century. Although there are a number
electricity access breach, and last but not least, the ever-increasing of discontinued gauging stations, the USGS currently operates
use of fossil fuels—and their ill consequences—promoted a about 8,500 streamflow stations, of which more than one-half are
renovated growth in the construction of dams. Over 3,700 major telemetered by an earth-satellite-based communications system.
dams (i.e., larger than 1 MW) were in the planning stage or under Hydrological data are available in real-time for many agencies to
construction in the last decade and, at the same time, our planet’s conduct water-resources projects and for the National Weather
left over free-flowing large rivers have diminished by ∼21% (Zarfi Service (NWS) to forecast floods14 . Data from individual stations
et al., 2014). are frequently used for objectives beyond the original purpose for
At the beginning of the 20th century, the goal behind an individual station, and the undertaking of scientific studies of
locating discharge-measuring gauging stations in rivers was the long-term changes in the hydrologic cycle is among them.
long-term assessment of discharge variability, directly applied Argentina belongs in the group of countries leading in
to flood and drought management. Building dams previously river discharge data-gathering in South America, since gauging
requires–among many other prerequisites-extended and reliable stations began operation early in the 20th century15 . Currently,
information on discharge irregularity, focusing on the frequency Argentina’s national hydrologic network (i.e., Secretaría de
and volume of floods and the severity of droughts. It follows Infaestructura y Política Hídrica) operates 339 real-time
that the location of such gauging stations along river courses streamflow gauging stations and 251 conventional ones. Over
should be determined by suitable sites-from an engineering 200 have ceased operation. There is an uncertain number
point of view-for dam construction (e.g., Fell et al., 2018). of additional gauging stations which are operated by other
The current environmental crisis12 , however, has added a new federal (e.g., the Servicio Meteorológico Nacional) or provincial
perspective to river monitoring: river flow dynamics cast a agencies. Data from one of the oldest stations (i.e., Paraná
reliable image on the environmental factors and the changes River at Corrientes) was employed to compute the 1904-2003
occurring in the drainage basin. Moreover, lengthy river flow deseasonalized discharge time series (i.e., data stripped of its
seasonal component) and examined by means of the Mann-
Kendall trend test (Mann, 1945; Kendall, 1975), finding a
10 E.g., https://uneplive.unep.org/media/docs/assessments/unep/wwqa/report/
web.pdf (accessed July 30, 2021). 13 https://www.ceh.ac.uk/our-science/projects/national-river-flow-archive
11 More than 50% of the Amazonian rainforest (i.e., ∼5 106 km2 ) is in Brazil, where (accessed July 7, 2021).
∼19% has been cleared; deforestation decreased after 2004 but forest clearing is 14 https://pubs.usgs.gov/fs/2004/3056 (accessed July 7, 2021).
rising again (Amigo, 2020). 15 https://www.argentina.gob.ar/obras-publicas/hidricas/base-de-datos-
12 https://www.ipcc.ch/library (accessed July 27, 2021). hidrologica-integrada (accessed June 30, 2021).
Frontiers in Water | www.frontiersin.org 3 October 2021 | Volume 3 | Article 745912Depetris Importance of River Monitoring
significant (p < 0.05) increasing mean trend of ∼31 m3 s−1 recorded during the early decades of the 20th century cannot be
per year (Pasquini and Depetris, 2007). The seasonal Kendall used to forecast 21st century river flow17 .
test (Hirsch et al., 1982) applied to the same 100-year-long
series exhibited increasing significant trends (p < 0.001) for the
low-water season (i.e., August–November). The same trend test CONCLUDING COMMENTS AND
employed in 50-year segments (i.e., 1904–1949, and 1950–2003) RECOMMENDATIONS
showed significant negative trend for the first set (i.e., p < 0.05 in
February–March, high discharge months) and a significant (i.e., Early in history, barrages were built to prevent the undesirable
p < 0.001) positive trend for the second (i.e., August–November) consequences of both, floods and droughts. Technology devised
(Pasquini and Depetris, 2007). hydroelectricity around the last quarter of the 19th century and,
Other important aspects are recurring weather patterns, which hence, the regular measurement of river flow began spreading
change the global atmospheric circulation and affect temperature worldwide at propitious sites to gather information which would
and precipitation across the globe. A leading example is the assist in river discharge forecasting, thus securing continuous
broadly known El Niño-Southern Oscillation (ENSO), which power production and water volumes commensurate to demand.
involves changes in the water temperature in the Pacific Ocean The current environmental/climatic crisis, however, has added
disturbing worldwide weather (e.g., McPhaden et al., 2020). Early new challenges -succinctly reviewed below—to the original
in the study of the Southern Oscillation, its teleconnection with straightforward goals.
the Paraná River flow was explored by Sir Gilbert Walker’s Climate change involves modification of the precipitation
research team in the 1920s, then seeking to forecast India’s distribution patterns and the frequency of occurrence of extreme
monsoon (e.g., Depetris et al., 1996 and references therein). climatic events, introducing non-stationary properties to river
The hydrological behavior of the Paraná River drainage basin flow series. Thus, it is all the more important to assemble robust
illustrates the dynamic nature of the linkage between weather hydrological data bases so that the management of rivers for
patterns and river flow. Harmonic analysis showed that the flood control, water scarcity, and maintenance of water quality,
Paraná River at Corrientes exhibited a significant (p < 0.001) can be based on rigorous observations of the frequency and
inter-annual oscillation in the ∼3–7 years range, which is in intensity of river discharges. It is important emphasizing here
phase with ENSO events (Pasquini and Depetris, 2007)16 . The that, Oceania and Africa, for example, account for more than
impact of ENSO-triggered anomalous hydrology is replicated in half of the rivers for which Milliman and Farnsworth (2011),
many other parts of the world (e.g., McPhaden et al., 2020). in their well-known synthesis, could find no hydrological data.
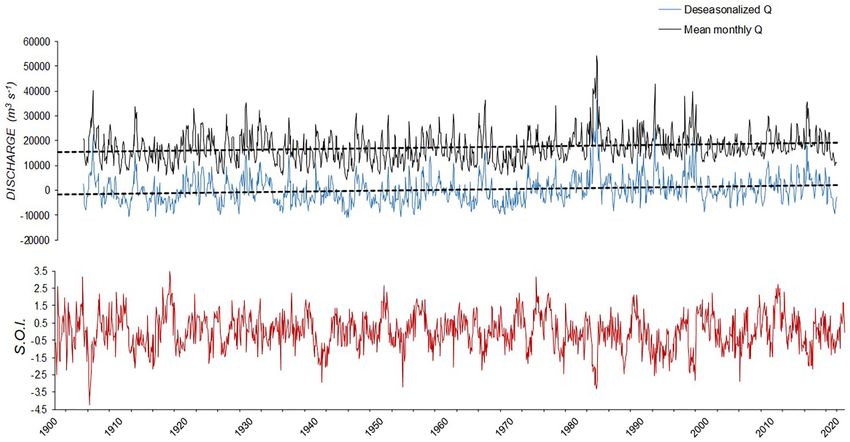
Figure 1 illustrates further the valuable information that the There are, however, numerous problems involved in maintaining
investigation of river flow time series can supply. An updated worldwide river discharge databases and, although the wide-
Paraná River discharge time series shows the increasing trend reaching gauging network has improved significantly since
of the deseasonalized series. In the case of the middle and river flow measurement started, it is still far from ideal (e.g.,
lower Paraná, its mean monthly discharge increased ∼3700 Milliman and Farnsworth, 2011). GRDC, for example, is limited
m3 s−1 over the 116-year period. Is ENSO-triggered rainfall to selected stations, largely defined by participating countries
a relevant factor in the Paraná’s flow increase? It seems to be and, furthermore, hydrological data is sometimes incomplete
the case. Figure 1 also includes the variability of the Southern or insufficient, and changes experienced over time in gauging
Oscillation Index (SOI) for the same period. Sharply negative SOI networks may be unreported. GRDC has no information on the
departures (i.e., El Niño events) frequently determine high flow, instrumentation or methods employed to generate the discharge
whereas positive departures generally correspond to La Niña database18 .
occurrences in the Pacific, often determining low discharges. Another important aspect to consider is mountain streams.
Particularly outstanding is the 1982-83 ENSO which brought Mountain chains are frequently called the water towers of the
about extraordinary flooding accompanied by a significant world because they often hold the uppermost catchments that
biogeochemical response (e.g., Depetris and Kempe, 1993; supply water to large river systems (e.g., Amazon, Congo,
Depetris, 2021). Research has shown that there is unevenness Orinoco). About half of the water used by the world’s population
in the hydrologic response of some tributaries feeding the originates in mountain chains (Wohl, 2011, and references
main stem (Depetris and Pasquini, 2008; Pasquini and Depetris, therein). It follows, then that, under the light of acute climatic
2010). Increased rainfall in the upper catchments appears to modifications, the hydrological scrutiny (i.e., rainfall and stream
be the main factor determining such hydrological behavior flow gauging) of such areas must be intensified and optimized, so
(e.g., Zandonadi et al., 2016, and references therein). However, as to attain sound forecasting capability. The Surface Atmosphere
detailed gauging information from selected sites might reveal, Integrated Field Laboratory (SAIL), high in the Colorado
for example, the additional impact of land-use changes. Perhaps Rockies, is a relevant example of a scientific effort seeking
the most important conclusion emerging from the Paraná’s long
17 Unexpectedly, the Paraná River is currently undergoing the worst drought in
discharge time series is that it is not stationary and that discharges
over 90 years. The low-discharge trend started in June 2019 and it is still going on.
18 Expanding and optimizing global discharge databases is a multifaceted problem
and the blueprint for its solution lies beyond the purpose of this policy brief.
16 Fourier’s
squared coherency supported the teleconnection existing between Extensive international cooperation is, indeed, implicit and should be framed
ENSO occurrences and Paraná River flow anomalies. within the current global change crisis.
Frontiers in Water | www.frontiersin.org 4 October 2021 | Volume 3 | Article 745912Depetris Importance of River Monitoring
FIGURE 1 | Upper graphs: mean monthly discharge series (Q) of the Paraná River at the Corrientes gauging station (1200 km upstream the mouth) and the
corresponding deseasonalized series for the 1904-2020 period. Geometric mean discharge currently reached ∼16300 m3 s−1 . A positive trend (i.e., the slope of ∼300
m3 s−1 per decade showed little change over the last 20 years) resulted in a mean discharge increase of ∼3700 m3 s−1 over the ∼116 year interval. Lower graph: SOI
variability19 Notice the coherence between Q and ENSO events, particularly in the 1982-3 exceptional flood.
to unveil the causes behind the drought that has gripped the accomplish monitoring on a scale that is significantly larger
southwestern USA for 2 decades20 . than the currently reached level. Yet, without such support,
The growth of environmental concern at present has led to a it is going to be challenging to devise water management
deeper insight into the Earth’s “critical zone” (e.g., Richardson, policies based on the modern reality of climate changing
2020), and resources are now perceived under a different over time.
perspective. The water conveyed by rivers, as well as the As a final remark, it would be recommended that
heterogeneous materials they transport to coastal seas, can supply countries expand and optimize river flow measuring
a wealth of information on the features coexisting and the networks, revising the locations of permanent/temporary
processes occurring within their drainage basins. Probing into gauging stations, modernizing measuring methodologies—
data series allows to investigate hydrologic/environmental high- i.e., hydrology is particularly constrained by the restrictions
and low-frequency processes as well as other chemical and of in situ sampling (e.g., England, 2005)-, and improving
physical phenomena. data distribution. The benefits, for example, of real-time
The recent disastrous floods endured by a significant data-acquisition, gauging recalibration (e.g., by Doppler
proportion of the European population, stunned hydrologists acoustic technology), effective use of modeling (e.g.,
and showed that rainfall/streamflow monitoring has never been Hidalgo, 2021), the restarting of adequate inoperative
more important (i.e., investigation suggests that extreme flood stations, will positively impact on our knowledge of the
events will become more common in Western Europe as the World’s hydrology.
world warms21 ).This fact tends to get neglected because it is hard While the importance of monitoring has long been
to generate support and public understanding for the need to recognized, it has assumed today even more standing
because of the loss of stationarity and clear evidence
19 http://www.bom.gov.au/climate/influences/graphs/. that the consequences of climate change are increasingly
20 https://www.science.org/news/2021/08/high-colorado-rockies-scientists- becoming obvious. Adding the boundary conditions
launch-search-causes-western-water-woes?utm_campaign=news_daily_2021- forced by global change to the objectives validating
08-24&et_rid=742695301&et_cid=3895875 (accessed September 3, 2021). river discharge monitoring implies that gauging station
21 https://www.nature.com/articles/d41586-021-02330-y?utm_source=Nature$+
networks may be revised-and, possibly, multiplied and/or
$Briefing&utm_campaign=144d67f668-briefing-dy-20210826&utm_medium=
email&utm_term=0_c9dfd39373-144d67f668-44601189 (accessed August 30, relocated-, so as to be useful in assessing recent—or
2021). ongoing—environmental impacts.
Frontiers in Water | www.frontiersin.org 5 October 2021 | Volume 3 | Article 745912Depetris Importance of River Monitoring
AUTHOR CONTRIBUTIONS Network of Academies of Science (IANAS). The financial support
of the Inter Academy Partnership (IAP) for the realization of
The author confirms being the sole this publication is herein acknowledged. The author is grateful
contributor of this work and has approved it to IANAS’ Water Program and to its co-Chairs, Henry Vaux
for publication. and Katherine Vammen, for their valuable assistance in revising
the original manuscript. The commentaries of Richard Taylor,
ACKNOWLEDGMENTS Specialty Chief Editor, and two unknown reviewers have been
particularly helpful in improving the original manuscript. I am
This Policy Brief is one in a series prepared by members also grateful to Subimal Ghosh, Associate Editor, for the handling
and colleagues of the Water Committee of the Inter-American of this MS.
REFERENCES Mann, H. B. (1945). Non-parametric tests against trend. Econometrica 13, 245–259.
doi: 10.2307/1907187
Amigo, I. (2020). The Amazon’s fragile future. Nature 578, 505–507. Mckendry, I. G. (2005). “Weather patterns and weather types,” in
doi: 10.1038/d41586-020-00508-4 Encyclopedia of Hydrological Sciences, ed M. G. Anderson (Chichester,
Anderson, M. G., and McDonnell, J. J. (eds.). (2005). Encyclopedia of Hydrological SXW: Wiley and Sons), 401–411. doi: 10.1002/0470848944.hs
Sciences, Vol. 5, Chichester, SXW: Wiley and Sons. doi: 10.1002/047084 a028
8944 McPhaden, M. J., Santoso, A., and Cai, W. (eds). (2020). El niño
Dai, A., Qian, T., Trenberth, K. E., and Milliman, J. D. (2009). southern oscillation in a changing climate. Washington, DC: Wiley.
Changes in continental freshwater discharge from 1948 doi: 10.1002/9781119548164
to 2004. J. Clim. 22, 2773–2792. doi: 10.1175/2008JCLI2 Milliman, J. D., and Farnsworth, K. L. (2011). River Discharge to the
592.1 Coastal Ocean. A Global Synthesis. Cambridge: Cambridge University Press.
Dai, A., and Trenberth, K. E. (2002). Estimates of freshwater discharge from doi: 10.1017/CBO9780511781247
continents: latitudinal and seasonal variations. J. Hydrometeor. 3, 660-687. Olsson, L., Barbosa, H., Bhadwal, S., Cowie, A., Delusca, K., Flores-Renteria,
doi: 10.1175/1525-7541(2002)0032.0.CO;2 D., et al. (in press). “Land Degradation,” in Climate Change and Land: an
Depetris, P. J. (2021). Revisiting the effect of extreme flooding on the IPCC Special Report on Climate Change, Desertification, Land Degradation,
chemistry of a large floodplain river: the example of Argentina’s Sustainable Land Management, Food Security, and Greenhouse Gas Fluxes in
middle Paraná. Env. Earth Sci. 80:54. doi: 10.1007/s12665-020-09 Terrestrial Ecosystems, eds P. R. Shukla, J. Skea, E. Calvo Buendia, V. Masson-
309-4 Delmotte, H.-O. Pörtner, D. C. Roberts, P. Zhai, R. Slade, S. Connors, R. van
Depetris, P. J., and Kempe, S. (1993). Carbon dynamics and sources in the Paraná Diemen, M. Ferrat, E. Haughey, S. Luz, S. Neogi, M. Pathak, J. Petzold, J.
River. Limn. Oceanogr. 387, 382–395. doi: 10.4319/lo.1993.38.2.0382 Portugal Pereira, P. Vyas, E. Huntley, K. Kissick, M. Belkacemi, J. Malley.
Depetris, P. J., Kempe, S., Latif, M., and Mook, W. G. Available online at: https://www.ipcc.ch/srccl/ (accessed July 19, 2021).
(1996). ENSO-controlled flooding in the Paraná River Pasquini, A. I., and Depetris, P. J. (2007). Discharge trends and flow dynamics
(1904-1991). Naturwissen. 83, 127–129. doi: 10.1007/BF0114 of south American rivers draining the southern Atlantic seaboard:
2177 an overview. J. Hydrol. 333, 385–399. doi: 10.1016/j.jhydrol.2006.0
Depetris, P. J., and Pasquini, A. I. (2008). Riverine flow and lake level variability 9.005
in Southern South America. EOS 89, 254–255. doi: 10.1029/2008EO28 Pasquini, A. I., and Depetris, P. J. (2010). ENSO-triggered exceptional flooding
0002 in the Paraná River: where is the excess water coming from? J. Hydrol. 383,
Eltahir, E. A. B., and Wang, G. (1999). Nilometers, El Nino, and climate 186–193. doi: 10.1016/j.jhydrol.2009.12.035
variability. Geophys. Res. Let. 26, 489–492. doi: 10.1029/1999GL90 Richardson, J. (2020). “Critical Zone”, in Encyclopaedia of Geochemistry, ed W. M.
0013 White (Berlin: Springer), 326–330.
England, A. W. (2005). “Sensor principles and remote sensing techniques,” in Sasakova, N., Gregova,G., Takacova, D., Mojzisova, J., Papajova, I., Venglovsky,
Encyclopedia of Hydrological Sciences, eds M. G. Anderson (Chichester, SXW: J., et al. (2018). Pollution of surface and ground water by sources related to
Wiley and Sons), 673–695. doi: 10.1002/0470848944.hsa050 agricultural activities. Front. Sustain. Food Syst. 2:42. doi: 10.3389/fsufs.2018.0
Fell, R., Stapledon, D., Bell, G., and Foster, M. (2018). Geotechnical Engineering of 0042
Dams, 2nd edn. London: CRC Press. UNESCO WWAP (2021). The United Nations World Water Development Report
Hidalgo, H. G. (2021). Climate variability and change in Central 2021: Valuing Water. UNESCO World Water Assessment Program. https://
America: what does it mean for water managers. Front. Water 2:1. unesdoc.unesco.org/ark:/48223/pf0000375724 (accessed July 19, 2021).
doi: 10.3389/frwa.2020.632739 Von Storch, H. (2005). “Models of global and regional climate,” in Encyclopedia of
Hirsch, R. M., Slack, J. R., and Smith, R. A. (1982). Hydrological Sciences, ed M. G. Anderson (Chichester, SXW: Wiley and Sons),
Techniques of trend analysis for monthly water quality 477–490. doi: 10.1002/0470848944.hsa035
data. Water Res. 20, 107–121. doi: 10.1029/WR018i001p0 Wohl, E. (2011). Mountain Rivers Revisited. Washington, DC: American
0107 Geophysical Union. doi: 10.1029/WM019
IANAS (2019). Water Quality in the Americas. Risks and Opportunities, 624. Zandonadi, L., Acquaotta, F., Fratianni, S., and Zavattini, J. A. (2016). Changes in
Available online at: https://ianas.org/wp-content/uploads/2020/07/02-Water- precipitation extremes (Paraná River basin). Theor. Appl. Climat. 123, 741–756.
quality-INGLES.pdf (accessed July 19, 2021). doi: 10.1007/s00704-015-1391-4
Issakaa, S., and Ashrafa, M. A. (2017). Impact of soil erosion and Zarfi, C., Lumsdon, A. E., Berlekamp, J., Tydecks, L., and Yockner, K. (2014).
degradation on water quality: a review. Geol. Ecol. Land. 1:2017. A global boom in hydropower dam construction. Aquat. Sci. 77, 161-170.
doi: 10.1080/24749508.2017.1301053 doi: 10.1007/s00027-014-0377-0
Kendall, M. G. (1975). Rank Correlation Methods. London: Griffin.
Koutsoyiannis, D. (2013). Hydrology and change. Hydrol. Conflict of Interest: The author declares that the research was conducted in the
Sci. J. 58, 1177–1197. doi: 10.1080/02626667.2013.80 absence of any commercial or financial relationships that could be construed as a
4626 potential conflict of interest.
Frontiers in Water | www.frontiersin.org 6 October 2021 | Volume 3 | Article 745912Depetris Importance of River Monitoring
Publisher’s Note: All claims expressed in this article are solely those Copyright © 2021 Depetris. This is an open-access article distributed under the
of the authors and do not necessarily represent those of their affiliated terms of the Creative Commons Attribution License (CC BY). The use, distribution
organizations, or those of the publisher, the editors and the reviewers. or reproduction in other forums is permitted, provided the original author(s)
Any product that may be evaluated in this article, or claim that may and the copyright owner(s) are credited and that the original publication in
this journal is cited, in accordance with accepted academic practice. No use,
be made by its manufacturer, is not guaranteed or endorsed by the
distribution or reproduction is permitted which does not comply with these
publisher.
terms.
Frontiers in Water | www.frontiersin.org 7 October 2021 | Volume 3 | Article 745912You can also read