The relevance of rock shape over mass-implications for rockfall hazard assessments - Nature
←
→
Page content transcription
If your browser does not render page correctly, please read the page content below
ARTICLE
                  https://doi.org/10.1038/s41467-021-25794-y                 OPEN

                  The relevance of rock shape over mass—
                  implications for rockfall hazard assessments
                  Andrin Caviezel 1 ✉, Adrian Ringenbach1, Sophia E. Demmel1, Claire E. Dinneen 1, Nora Krebs1,
                  Yves Bühler 1, Marc Christen1, Guillaume Meyrat1, Andreas Stoffel1, Elisabeth Hafner 1, Lucie A. Eberhard1,
                  Daniel von Rickenbach1, Kevin Simmler1, Philipp Mayer 2, Pascal S. Niklaus 2, Thomas Birchler2, Tim Aebi2,
                  Lukas Cavigelli 2, Michael Schaffner2, Stefan Rickli 2, Christoph Schnetzler2, Michele Magno2, Luca Benini2 &
                  Perry Bartelt1
1234567890():,;

                  The mitigation of rapid mass movements involves a subtle interplay between field surveys,
                  numerical modelling, and experience. Hazard engineers rely on a combination of best prac-
                  tices and, if available, historical facts as a vital prerequisite in establishing reproducible and
                  accurate hazard zoning. Full-scale field tests have been performed to reinforce the physical
                  understanding of debris flows and snow avalanches. Rockfall dynamics are - especially the
                  quantification of energy dissipation during the complex rock-ground interaction - largely
                  unknown. The awareness of rock shape dependence is growing, but presently, there exists
                  little experimental basis on how rockfall hazard scales with rock mass, size, and shape. Here,
                  we present a unique data set of induced single-block rockfall events comprising data from
                  equant and wheel-shaped blocks with masses up to 2670 kg, quantifying the influence of rock
                  shape and mass on lateral spreading and longitudinal runout and hence challenging common
                  practices in rockfall hazard assessment.

                  1 WSL Institute for Snow and Avalanche Research SLF, Davos, Switzerland. 2 ETH Zurich, Integrated Systems Lab IIS, Zurich, Switzerland.
                  ✉email: caviezel@slf.ch

                  NATURE COMMUNICATIONS | (2021)12:5546 | https://doi.org/10.1038/s41467-021-25794-y | www.nature.com/naturecommunications                  1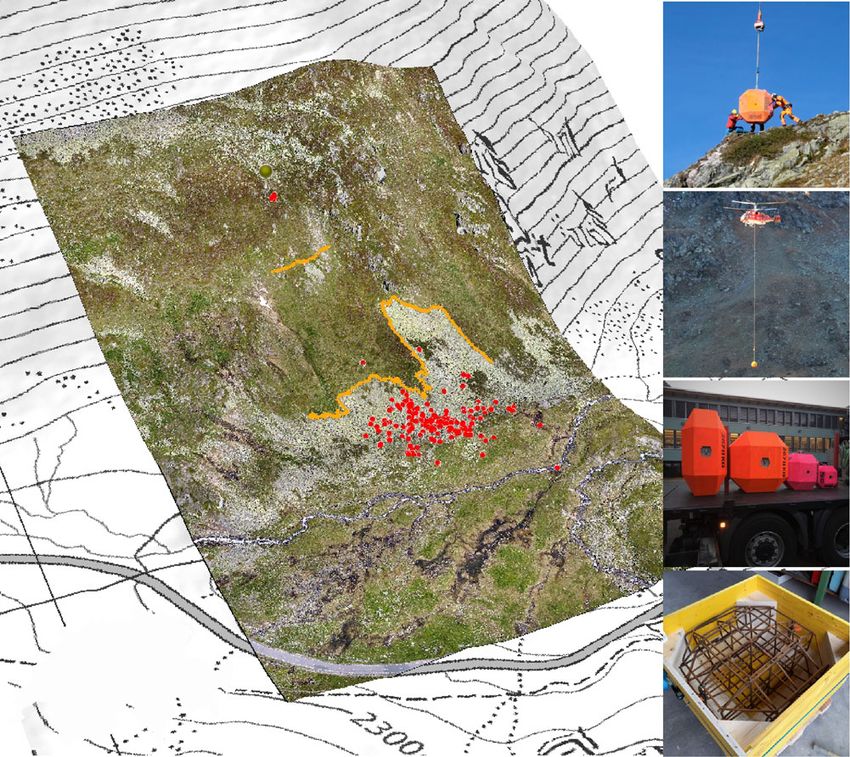
ARTICLE                                                                        NATURE COMMUNICATIONS | https://doi.org/10.1038/s41467-021-25794-y

T
        wo key factors in an accurate quantification of rockfall risk                and temporal resolution to capture the sudden, short-duration
        are realistic estimates of the release conditions and a sound               impact phenomena governing rockfall motion. Several experi-
        evaluation of possible block propagation trajectories.                      mental studies of induced rockfall trajectories have been
Geologic, on-site, or remotely conducted studies define the                          conducted9,28–31,31–36. Most of these studies focus on small
location and spatial distribution of rock-face instabilities and,                   numbers of rocks and/or rebounds, that is limited falling dis-
ideally, constrain the possible release scenarios in terms of                       tances. Recent studies pave the way to a more complete and
volume, block mass, and shape as well as recurrence                                 exhaustive experimental coverage of single-block experiments on
probability1–6. Three dimensional, numerical rockfall tools are                     a full slope scale37,38 expanding experimental techniques for
then applied to determine propagation distances to assess rockfall                  complete trajectory reconstructions similar to earlier pioneering
hazard7–13. Once the constitutive parameters governing the rock-                    studies30,34. These initial studies demonstrate the possibilities of
ground interaction are set for the respective model, the numerical                  new experimental techniques, they still do not have the statistical
simulations provide objective, spatially inclusive information on                   basis, i.e., number of experiments, range of rock types, etc., to
the relevant parameters of interest such as runout distances, jump                  quantify energy dissipation rates and therefore calibrate
heights, and kinetic energies as a function of the digitised terrain.               modelling tools.
While the awareness of rock shape dependence on rockfall tra-                          While the larger part of a rockfall motion is represented as a
jectory behaviour is well established14, only the advent of avail-                  series of oblique throws that follow ballistic trajectories with
able computational means to incorporate complex shapes has                          undisturbed rigid-body rotations, the complex rock-ground
triggered renewed interest in accurate size and shape treatment in                  interaction leads to local and discrete energy transfer mechan-
rockfall hazard assessments12,15–23 but equally its implications on                 isms. This makes the rockfall problem unique in natural hazards
numerical schemes11–13,24.                                                          mitigation. Unlike other gravitationally driven hazards such as
   Establishing an experimental foundation underpinning the                         debris flows, or rock and snow avalanches, energy dissipation
non-smooth kinematics of rockfall motion presents the geohazard                     mechanisms in the rockfall problem cannot be smoothed by
science and engineering community with many special chal-                           modelling statistical averages of thousands of particle interactions
lenges. The measurement techniques used to capture the essen-                       with the ground and/or other particles. Accurate modelling of the
tially smooth propagation velocities of fluid-type natural hazards                   rock-ground interaction requires understanding the dynamic
(see for example ref. 25 for debris flows or refs. 26,27 for ava-                    response of the ground loaded by a single, spinning, and
lanches) cannot be employed because they do not have the spatial                    complex-shaped rigid body. Motion patterns such as sliding, slip-
                                                                                    free rolling (and combinations) increase the complexity and
                                                                                    hence the selection of constitutive parameters governing rebound
    a                                                          b                    and energy dissipation.
                                                                                       This study presents an unprecedented dataset of induced
                                                                                    single-block rockfall events. In terms of data volume, systematic
                                                                                    sampling, and consistent boundary conditions, the measurements
                          Release Point                                             surpass existing rockfall datasets. Fusion of external and in situ
                                                               c                    measurement methods39,40 enable exhaustive trajectory recon-
        Acceleration Zone                                                           struction yielding information not only over the complete flight
                                                                                    path including parameters of interest such as translational velo-
                                                                                    city vectors, angular velocities, ballistic jump heights, and lengths
            Transition Zone                                                         but equally reveal insights in impact kinematics and energy dis-
                                                               d                    sipation mechanisms. The gathered data can thus serve as a
                                                                                    unique calibration basis for numerical rockfall models.
                 Runout Zone

                                                                                    Results
                                                               e                    The Chant Sura experimental campaign. The presented Chant
                                                                                    Sura experimental campaign (CSEC) consists of data collected
                                                                                    over 12 individual days spread over the snow-free seasons of
                                                                                    2017–2019 at the Chant Sura experimental site (46.74625∘N,
                                                                                    9.96720∘E) located on the Flüelapass, Switzerland (Fig. 1). Test
                                                                                    samples are perfectly symmetric, man-made test EOTA blocks,
Fig. 1 Aerial test site overview and experimental impressions of                    the norm rock of the European Organization for Technical
helicopter-aided single-block rockfall experiments. a Perspective                   Assessment used in standardised rock fence testing procedures in
overview of the rockfall test site Chant Sura located on the Flüelapass,            official European Technical Approval Guidelines41. Heavily
Switzerland, with its geographic location depicted in the lower-left corner. A      reinforced concrete blocks with weights of roughly 45, 200, 800,
UAS-derived orthophoto is draped over the corresponding digital elevation           and 2670 kg—a subset of which are depicted in Fig. 1b—are cast
model on top of a regular swisstopo map (Source: Federal Office of                   and repeatedly released from a hydraulic platform located at 2380
Topography swisstopo). The release platform is marked with a yellow pin.            meters a.s.l. (see insets of Fig. 1a). Initial conditions vary only
The ensemble of deposited rocks is indicated with red markers. The                  slightly in rock orientation on the platform, positional deviations
acceleration zone above the cliff, transition zone between cliff and scree          are negligible. The trajectory is initialised once the platform tilt
line, and runout zones/scree field are labelled. b Reception of an                   allows the rock to slide off. Directional deviations of the indivi-
EOTA2670kg
       221   by the ground crew at the release platform. c Slinging of a            dual trajectories are predominantly governed via geometrical
EOTA2670kg
       111   rock by a Kamov KA32 A12 back to the release platform                  configurations of the first impacts. A previous small rock
situated at 2380 m.a.s.l. d A subset of the used rocks ready for                    experimental campaign42 identified equant and compact platy
                                       2670;800;200kg
transportation: EOTA2670kg
                       221  and EOTA111               from left to right. e Steel   rocks as the worst-case scenario drivers. Thus, these two form
reinforcement cage of a wheel-shaped EOTA200kg 221    block to ensure maximal       variants of the EOTA rock are used, the equant EOTA111 with
ruggedness and lifetime.

2                    NATURE COMMUNICATIONS | (2021)12:5546 | https://doi.org/10.1038/s41467-021-25794-y | www.nature.com/naturecommunications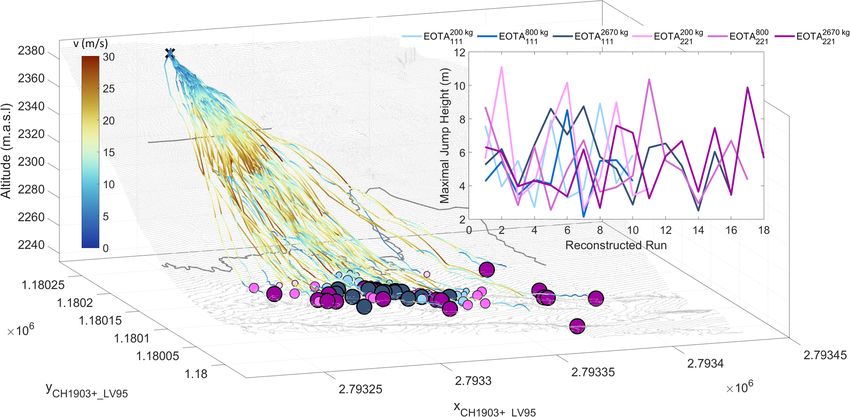
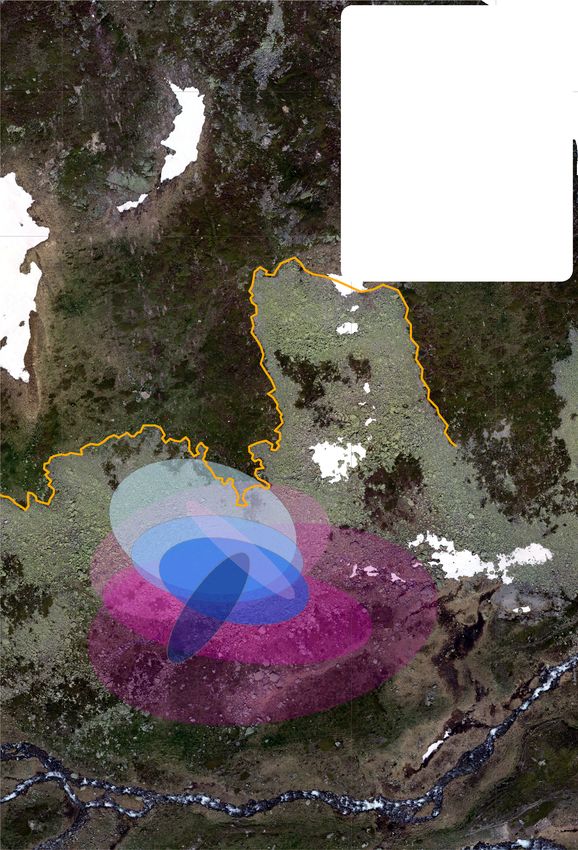
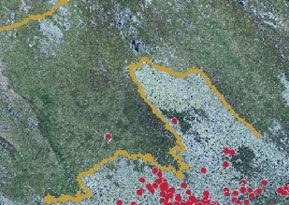
NATURE COMMUNICATIONS | https://doi.org/10.1038/s41467-021-25794-y                                                                       ARTICLE

Fig. 2 Complete set of 183 deposition points of the Chant Sura Experimental Campaign. Blue markers represent equant EOTA111 rocks varying from 45 kg
(light blue) to 2670 kg (dark blue). Wheel-shaped EOTA221 deposition points are shown in magenta with masses from 45 kg (light magenta) to 2670 kg
(dark magenta). The respective centres of mass for each rock category is indicated with a crossed circle in the same colour together with its first standard
deviation ellipse.

NATURE COMMUNICATIONS | (2021)12:5546 | https://doi.org/10.1038/s41467-021-25794-y | www.nature.com/naturecommunications                                 3
ARTICLE                                                                    NATURE COMMUNICATIONS | https://doi.org/10.1038/s41467-021-25794-y

Fig. 3 Complete set of 82 reconstructed rockfall trajectories of the CSEC and their maximal jump heights. Complete set of 82 reconstructed rockfall
trajectories of the CSEC. The colour and size code of the deposition points is identical to Fig. 2: Blue markers represent equant EOTA111 rocks varying from
45 kg (light blue) to 2670 kg (dark blue). Equivalently, the wheel-shaped EOTA221 deposition points are represented with masses from 45 kg (light
magenta) to 2670 kg (dark magenta). The translational kinematics are visualised with a velocity scaled, perceptually uniform, colouring48 of the
trajectories. The inset corroborates the uniform kinematic behaviour across the shape and weight classes with similar overall maximal jump heights of each
trajectory usually occurring at the cliff jump (upper thick grey line) as can also be derived from similar spatial velocity distribution of the trajectories.

three identical axis lengths and the wheel-shaped EOTA221, where                remote sensing using various unmanned aerial systems such as
the wheel diameter is twice as long as the shortest axis.                       DJI Phantom 4 Pro, DJI Phantom 4 RTK, or the eBee+ equipped
   The acceleration zone above the upper orange line in Figs. 2                 with 20–24 MP cameras. Flight planning is achieved with the
and 3 has soil characteristics of dwarf shrubs while the transition             respective software tools to ensure precise navigation on steep
zone shows typical characteristics of alpine meadow interspersed                slopes and sufficient image overlap, set to 80% forward and 60%
with rocks with a slope inclination between 20–60 degrees. The                  side overlap. Flight altitude above ground level averages around
flat runout consists of a slightly dipping, rough scree field. Two                75 m and a mapping area of 0.2 km2 is covered. Roughly 500
prominent spatial hallmarks are the nearly vertical cliff located in            images were taken during each mapping job, yielding a very high
the upper part of the slope and the scree line. Both are outlined               point density of ~600 points/m2. To avoid systematic offsets
with thicker lines in Figs. 1, 2, and 3. The test rocks are equipped            between pre- and post-experiment flights, ground control points
with sensor nodes moving with the rock in what is mathema-                      were distributed for the absolute reference orientation and
tically termed the Lagrangian reference frame to track parameters               mapped using a differential GNSS with tri-axial accuracies of
of interest in situ. The deployed StoneNode v1.1-343, a dedicated               2–5 cm. The obtained UAS imagery is processed using the latest
inertial measurement unit (IMU), mounted in the rock’s centre of                AgiSoft PhotoScan Pro v1.4.3-1.6.3, a commercial software
mass records accelerations up to 400 g and angular velocities up                extensively used in the UAS community. The photogrammetric
to 4000 ∘/s at a data acquisition rate of 1 kHz. For a detailed                 workflow finally provides a DSM resolution of 5 cm and altitude
presentation of the methodology consider37 and the references                   uncertainties of ±3 cm, which allows the scaring mark detection
therein. Rock transportation is ensured via Airbus H125, H225,                  in the corresponding differential DSM.
or Kamov KA32 A12 helicopters depending on the rock masses                         Figure 2 shows the complete set of 183 deposition points of the
(see Fig. 1c). The induced rockfall events are recorded via external            CSEC. Blue markers represent equant EOTA111 rocks varying
static, so-called Eulerian, measurements such as high-resolution                from 45 kg (light blue) to 2670 kg (dark blue). Wheel-shaped
videogrammetry for optical projectile tracking. Camera constella-               EOTA221 deposition points are shown in magenta with masses
tions vary from single-camera setup up to static stereo-graphic                 from 45 kg (light magenta) to 2670 kg (dark magenta). The
videogrammetry via three spatially separated RED EPIC-W S35                     respective centres of mass for each rock category are indicated
Helium cameras recording 8K video footage consisting of a 25                    with a crossed circle in the same colour together with its first
frames per second image stream with an image resolution of                      standard deviation ellipse for all the rocks reaching the
8192 × 4320 pixels. Most reliable high-speed synchronisation is                 runout zone.
achieved via a Tentacle Sync Lock-it set enabling jitter-free frame-
wise temporal pairing of the image stream. High-accuracy
differential GNSS handheld receivers such as the Trimble GeoXH                  Four-dimensional trajectory reconstruction. In total 82 rock
and Stonex S800 are used to measure endpoint and scarring                       trajectories were reconstructed in four-dimensional space—
locations on the slope with an accuracy significantly below the                  3 spatial coordinates and time—visualised in Fig. 3. Reconstruc-
extent of the deposited block.                                                  tion is performed in an ideal case via matching temporal infor-
   For each experimental day, a high-resolution digital surface                 mation about the impact and lift-off taken from the sensor
model (DSM) is generated pre- and post-experimentally via aerial                streams combined with scarring locations taken from differential

4                  NATURE COMMUNICATIONS | (2021)12:5546 | https://doi.org/10.1038/s41467-021-25794-y | www.nature.com/naturecommunications
NATURE COMMUNICATIONS | https://doi.org/10.1038/s41467-021-25794-y ARTICLE
UAS surface models. The colour and size code of the deposition scale the slope specificity for a given weight or shape class to a
points are the same as in Fig. 2, with blue markers representing single measure the extrapolated estimated mean rotational speeds
the deposition points of equant EOTA111 rocks varying with for different mass classes are shown in Fig. 4c. While 10 kg rocks
darker shades for heavier rocks. Equivalently, the deposition are expected to rotate up to 4000 ∘/s (11 Hz) it decreases to 130 ∘/s
points of wheel-shaped EOTA221 vary from light to dark magenta for a 100 t block (0.36 Hz). The empirical power-law
according to their weight class. The flight paths in Fig. 3 are
colour-coded by translational velocity, showcasing maximal 111 ¼ a111 m0:37 ± 0:06
ω and 211 ¼ a221 m0:44 ± 0:12 ð1Þ
ω
velocities of roughly 30 m/s normally reached after the longest with the scaling parameters a111 = 9278 [∘ s−1kg0.37]
airborne free-fall phase after the cliff. All subsets consistently a221 = 12480 [∘ s−1kg0.44] and mass m can provide a calibration
reach maximal velocities of 30 m/s in the cliff region. The basis across the entire mass spectrum for both shape classes for this
translational kinematic behaviour is rather uniform across the slope. Here, the shape specificity vanishes within the uncertainty,
shape and weight classes. Maximal jump heights are 8.5 m for all which corresponds to the uniform kinematic behaviour across
EOTA111 blocks, while the EOTA221 samples feature maximal shape classes. Equant rocks show tumbling behaviour, meaning low
jump heights of 11.1/10.4/9.8 m for the 200/800/2670 kg classes frequency, large amplitude oscillation in the minor axis extracted as
plotted as an inset of Fig. 3. Often, the rocks descend close to the its Fourier transform spectra in Fig. 4d. wheel-shaped rocks on the
ground, skimming the surface and spinning rapidly, covering the other hand feature a higher frequency, faster wobbling around their
250 m between release and deposition in less than 25 s. Maximal minor axis, rather insignificant with respect to the overall rotational
resultant angular velocities of 1000–5000 ∘/s (5.56π–27.78π rad/s) behaviour. Figure 4e visualises the energy ratio development upon
are measured. The insets highlight the comparison of angular descent for the chosen runs of Fig. 4a. The maximal rotational
velocities for both shape classes. During a typical descent, a rock energy ratio of 40% can serve as the upper limit estimation for
increases its angular and translational velocity during the accel- energy threshold estimation for rockfall barriers.
eration/stabilisation phase. On this slope, this happens in the pre- The use of Lagrangian methods, i.e., in situ instrumentation, allows
cliff zone above the upper thick grey line in Fig. 3. Here, wheel- for comparably effortless extraction of key parameters once the
shaped rocks tend to stabilise around their largest moment of availability of rugged sensor nodes covering the needed parameter
inertia—if not stopped immediately due to a landing on their flat ranges is given. Above all, matching angular velocities between
side at low speed, see uppermost deposition points in Fig. 2 and simulation results and experiments is a seal of quality for simulation
hence have been omitted in the calculation of the deviational code that relates to rigid-body approaches and needs to calculate
ellipses. Decreasing maximal rotational speeds with an increased rock-ground interactions with its full geometrical and kinematical
moment of inertia along with the almost exclusive uni-axial complexity. The presented rotational magnitudes and their empirical
rotations around the principal for wheel-shaped rocks are dis- law may serve as a benchmark for calibration routines.
cernible both in the insets of Fig. 3 as well as in Fig. 4.
Of interest for rockfall hazard assessment is that the total The stiletto effect: area-dependent energy dissipation. The 82
spreading angle of all trajectories is 38 degrees. The spreading reconstructed trajectories consist on average of eighteen parabolic
angle of the equant rocks reduces from ϕ111 ¼ 32 to
45kg
sections, and a total of 1394 impacts can be analysed across all the
200kg 800kg 2670kg
ϕ111 ¼ 23 , ϕ111 ¼ 27 as low as ϕ111 ¼ 13 . wheel-shaped weight and shape classes for translational degrees of freedom, 656
rocks display inverse spreading behaviour with increasing impacts additionally feature valid gyroscope information. The
spreading angles from ϕ221 ¼ 30 , ϕ221 ¼ 32 to
200kg 800kg parabolic sections resulting from impact reconstruction always
2670kg range from specified lift-off to subsequent impact location at the
ϕ221 ¼ 36 . Moreover, the wheel-shaped rocks determined
differential DSM. All parameters of interest (POI) such as posi-
the maximum spread of the trajectories, while the equant shaped
tion, kinematic variables, StoneNode readings such as angular
rocks show only marginal spreading. The spreading angle appears
velocities and acting accelerations are extracted at any given
to be defined immediately after release; that is, many of the
reconstruction point and allow to derive secondary variables such
wheel-shaped rocks followed straight trajectories once uprighted
as translational and rotational energy. Impact analysis consists of
and stable. This is a strong indication that the initial wobble phase
extracting POI at the endpoint of one parabolic section and the
immediately after release determines rock spreading. This fact
lift-off POI of the subsequent parabolic section. Each impact
could be exploited in rockfall hazard assessment.
corresponds thus to a given scar length from impact point to lift-
off point. The total energy is specified as Ekin = Etrans + Erot and
reduced to Etrans in case of gyroscope sensor failure. The average
StoneNode data—Lagrangian methods gather inside informa- soil-impact energy dissipation normalised per rock mass amounts
tion. The occasional sensor failure in such a highly dynamic kg
environment is inevitable. The StoneNode sensor proved itself as to ΔEkin ¼ 0:042 ± 0:005 kJ/kg independent of rock shape and
highly rugged equipment. Mechanical failure of the internal form. When additionally normalising to the penetrating cross-
accelerometer lead to data loss in five runs, a wrong compiler section area as shown in Fig. 5a, an empirical mass and area
setting on the gyroscopic sensitivity programming lead to 29 normalised energy dissipation power-law emerges
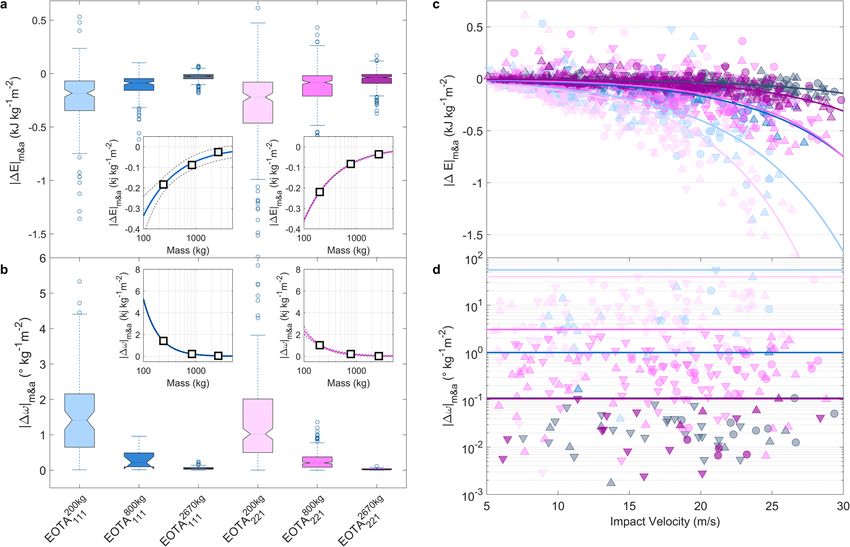
recorded runs with compromised data quality. The main limita- ΔEm&a ¼ b m0:7 ± 0:1 ð2Þ
tion for sensor data availability in the individual runs, was the
number of available sensors to equip all rocks, as they were with b = −9 [kJ kg−0.3 m−2] as depicted in the insets of Fig. 5a.
prototypically developed during the first part of the CSEC. The Figure 5b depicts the absolute mass and cross-section normalised
overall sensor stream availability amounts to 66% for accel- angular velocity change per impact. The deducted empirical
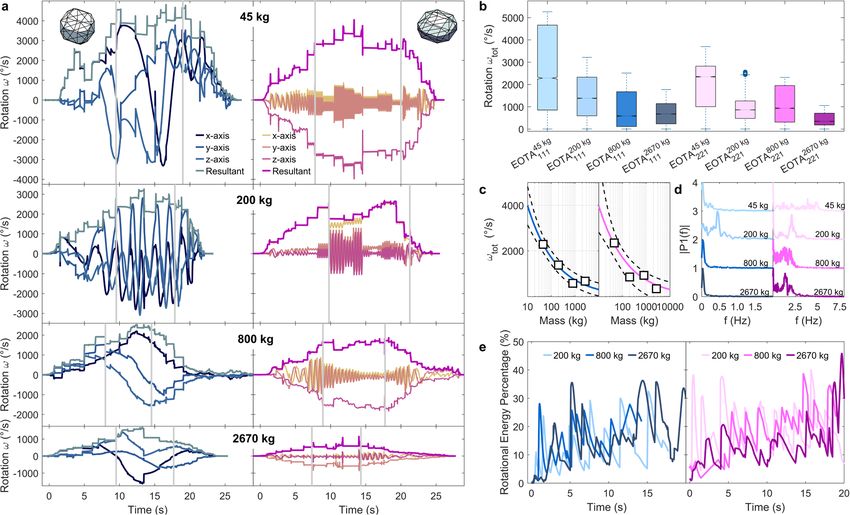
erometer data and 63% for gyroscope data. Figure 4a compares power-law follows a m−1.49±0.02 dependency for cubic EOTA111
the gyroscope sensor output from both shape classes across the rocks, and m−1.2±0.1 for platy EOTA221 rocks, respectively, as
investigated weight categories. Visible is the slope-specific bell depicted in the insets of Fig. 5b. The extrapolation and validity of
curve evolution of angular velocity. The decreasing absolute those empirical fitting laws to smaller and larger masses as well as
resulting rotational speed with an increased moment of inertia as their site-specificity must be verified in further studies. Future
well as the almost exclusive uni-axial rotations around the prin- data sources can be further experimental campaigns conducted
cipal axis for wheel-shaped rocks are predominant features. To under similar, controlled conditions at different locations or the
NATURE COMMUNICATIONS | (2021)12:5546 | https://doi.org/10.1038/s41467-021-25794-y | www.nature.com/naturecommunications 5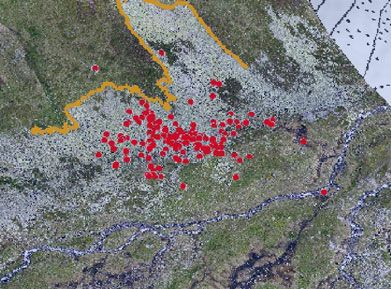
ARTICLE                                                                   NATURE COMMUNICATIONS | https://doi.org/10.1038/s41467-021-25794-y

Fig. 4 Gyroscope data streams across all shape and weight classes and their derived benchmark measures, such as median rotational relationship,
wobbling frequencies, and energy ratios. a Gyroscope data streams for all measured rock shapes and masses. Grey lines separate the acceleration zone
above the cliff, transition zone between cliff and scree, and scree runout zones. Individual lines represent x-, y-, z-axis as well as its resultant angular
velocities (thicker line). Decreasing maximal rotational speeds with an increased moment of inertia along with the almost exclusive uni-axial rotations
around the principal axis for wheel-shaped rocks is visible, i.e. almost perfect overlap between the leading axis and resulting axis apart from the
acceleration phase. Here, different colour shades represent different rock axis. b Summary boxplot—median values with standard whisker coverage of
99.3% (2.7σ)—of the StoneNode gyroscope output from the entire Chant Sura experimental campaign with its median rotational relationship as a possible
benchmark indicator for unobstructed slopes plotted in (c). d Wobbling frequency components of descending rocks. e Rotational energy percentage of the
presented runs in (a). Colour code for b–c is equivalent to Fig. 2: Blue markers represent equant rocks varying from 45 kg (light blue) to 2670 kg (dark
blue), Wheel-shaped rocks are shown in magenta with masses from 45 kg (light magenta) to 2670 kg (dark magenta).

use of publicly available results of scientific literature that follow a        person. It also remains shape-independent as the empirical fit
similar data collection approach given the temporal information                lines group according to their weight classes. The presented data
in the trajectory data is available. Figure 5d shows the shape-                indicates that for specific load cases with small rocks, local peak
class-dependent angular velocity changes upon 1361 analysed                    energies may play a role leading to the so-called "bullet effect", the
impacts across the different weight and shape classes. Horizontal              perforation of a rockfall protection mesh by an impact of a small
lines mark the maximal increase or decrease in angular velocity                block45, and with rocks larger than 1 m3, the velocity dependence
featuring the expected inertia dependency.                                     in energy dissipation needs only consideration starting from
   Figure 5c depicts the mass-normalised energy dissipation per                roughly 25–30 m/s. The occasional impact with positive ΔEm&a
impact with increasing impact velocities. The added lines                      can be attributed to special rebound conditions—in terms of
represent exponential fits to the different weight and shape                    impact geometry and local impact conditions as for example on a
classes in the established colour code and serve as a guide to the             downhill inclined smooth rock face in addition with a consider-
eye. It confirms the intuition, that soil impacts of faster projectiles         able potential energy intake when the impact happens on steep
dissipate more energy as they generally penetrate further into the             terrain. A major uncertainty in the reconstruction arises from
soil for equivalent soil conditions than smaller rocks. This is                impact/lift-off position placement and result in reconstructed
owing to the fact, that the compressibility of the impacted soil is            velocity uncertainties of ±0.5 ms−137. Figure 5d plots the mass
limited to a velocity-dependent maximal penetration depth44.                   and area normalised absolute rotation change of every exploitable
This maximal penetration depth is dependent on soil composi-                   and its order of magnitude shifts of rotation changes for the
tion and impact configuration, meaning larger and faster rocks                  different mass classes.
produce larger scars upon impact. The available travelling
distance for momentum reversal therefore can reach an upper                    Discussion
limit and scarring distance remain lower for slower projectiles.               The two key physical problems that need to be solved to improve
Analogously to the high-pressure loads of a person walking in                  rockfall hazard assessment are: (1) determining how rocks lat-
stiletto heels, smaller rocks dissipate significantly more energy               erally disperse from a given release source in natural mountain
compared to larger ones owing to their smaller cross-section. This             terrain, and (2) understanding the loss of translational and
stiletto effect for rock-ground interactions scales with the                   rotational kinetic energy during short-duration impacts with the
travelling velocities as is depicted in Fig. 5c, similar to a running          ground. Energy dissipation during the ground interaction defines

6                  NATURE COMMUNICATIONS | (2021)12:5546 | https://doi.org/10.1038/s41467-021-25794-y | www.nature.com/naturecommunications
NATURE COMMUNICATIONS | https://doi.org/10.1038/s41467-021-25794-y                                                                          ARTICLE

Fig. 5 Mass and impact cross-section normalised energy dissipation and angular velocity changes for all analysed impacts. a The stiletto effect in
rockfall—mass and impact cross-section normalised energy dissipation boxplot for the three larger weight classes. Insets present empirical power laws for
both shape categories with its 1σ-prediction bounds. b Impact-induced changes in absolute angular velocity scaling with mass and surface area. Insets
present empirical power laws for both shape categories with its 1σ-prediction bounds. Both boxplots feature median values with standard whisker coverage
of 99.3 % (2.7σ). c Velocity dependence of weight and impact cross-section normalised energy dissipation of 1394 analysed impacts for the three larger
weight classes. The smaller the rock cross-section the more pronounced the effect—equivalently to a person running in stiletto high heels as opposed to
sneakers. The lines represent exponential fits to the different weight and shape classes in the general colour code and serve as a guide to the eye. Upward
facing triangles mark impacts in the acceleration zone, circles in the transition zones, and downward facing triangles in the runout zones. d Angular velocity
changes upon 656 analysed impacts across the different weight and shape classes impact areas. Horizontal lines mark the maximal change in angular
velocity per weight class. Equivalent color code as in Fig. 2 used.

rock speed, jump heights, and finally runout distance. Rockfall                  This is a much stronger radius dependence as the Δω ∝ 1/r
models must be able to correctly predict these values for accurate              behaviour of a stick-slip-rolling transformation of an ideal sphere
hazard assessments.                                                             projected along a rough horizontal surface46. Frictional forces at
   Here, we present the results of a multi-year experimental                    the rolling interface apply a force and equivalent torque at the
campaign resulting in an unprecedented, comprehensive data                      rock’s centroid. Thus, the compilation of all the Chant Sura
inventory of single-block-induced rockfall experiments. The sig-                measurements indicates, that force tractions on the rock’s surface
nificantly higher lateral spread of wheel-shaped rocks is striking               control both the rotational and translational changes in kinetic
and highly relevant for hazard assessments. Once upright, the                   energy and rock kinematics. Further analysis might focus on
wheel-shaped rocks appear to follow straight trajectories on wide,              disentangling accelerating and decelerating behaviour and
open slopes, unencumbered by minor slope changes perpendi-                      potentially identifying an optimal rock radius concerning energy
cular to their direction of motion. Fluid-type gravitational                    accumulation and dissipation during impacts.
movements, like debris flows and snow avalanches, would react to                    This result underscores once again the importance of rock
these slopes, quickly following the line of steepest descent. The               shape. In real applications, for irregularly shaped rocks, the radius
trajectories of wheel-shaped rocks resist this tendency, with the               r changes from impact to impact depending on the terrain slope
end effect that rocks can escape channels and terrain undulations,              and rock orientation; the traction force changes with the prop-
thereby increasing the width of the hazard zone.                                erties of the ground material. The difference between the mea-
   We used the trajectories to quantify the change in rotational                surements and this ideal result should now be exploited to
speed Δω and change in translational kinetic energy ΔE during                   quantify traction forces for irregularly shaped rocks impacting
each ground interaction. We found that Δω111 ∝ 1/m0.83,                         different ground types. The results presented here provide a
Δω221 ∝ 1/m1.1, and ΔE ∝ 1/m0.70. If we let the rock mass m be                  detailed overview of the kinematic behaviour of two distinct rock
approximated by a perfect sphere of radius r, then m ∝ r3. We                   shape classes up to 1 m3 volume on the test site Chant Sura.
find approximately,                                                              While translational kinematics present themselves uniform across
                          1              1           1                          all shape and weight classes, strong shape dependence is found on
             Δω111 /          ; Δω221 / 3:3 and ΔE / 2                   ð3Þ    the lateral spread and rotational axis stabilisation. Generalised,
                        r 2:4          r            r

NATURE COMMUNICATIONS | (2021)12:5546 | https://doi.org/10.1038/s41467-021-25794-y | www.nature.com/naturecommunications                                    7
ARTICLE NATURE COMMUNICATIONS | https://doi.org/10.1038/s41467-021-25794-y
site-specific relationships for rotational and energy dissipation 8. Lan, H., Martin, C. D. & Lim, C. H. Rockfall analyst: A {GIS} extension for
behaviour are postulated and may serve as calibration measures. three-dimensional and spatially distributed rockfall hazard modeling.
Despite very high level of detail in the data, single impact con- Computers Geosci. 33, 262–279 (2007).
9. Bourrier, F., Dorren, L., Nicot, F., Berger, F. & Darve, F. Toward objective
figurations are not resolvable down to their exact impact con- rockfall trajectory simulation using a stochastic impact model. Geomorphology
figuration and location. Future sensor node development 110, 68–79 (2009).
coupling several sensor nodes to a fixed configuration might 10. Dorren L. K. A., Rocky for 3D (v5.2) revealed – Transparent description of the
overcome the reconstruction limit given by error accumulation complete 3D rockfall model. ecorisQ paper https://www.ecorisq.org/docs/
through integration of single IMU nodes and provide the missing Rockyfor3D_v5_2_EN.pdf (2016).
11. Leine, R. I. et al. Simulation of rockfall trajectories with consideration of rock
information. The confirmation or adaptation of the proposed shape. Multibody Syst. Dyn. 32, 241–271 (2014).
relationship for different site configurations will be of major 12. Yan, P., Zhang, J., Kong, X. & Fang, Q. Numerical simulation of rockfall
interest for future work. Possible necessary modifications through trajectory with consideration of arbitrary shapes of falling rocks and terrain.
topographic peculiarities such as couloirs or cliffs, the effect of Computers Geotech. 122, 103511 (2020).
forests, and different lithology remain of importance. Future 13. Leine, R. I., Capobianco, G., Bartelt, P., Christen, M. & Caviezel, A. Stability of
6-dof rigid body motion: application to rockfall simulation. Multibody Syst.
studies aim towards rotational energy dissipation mechanisms Dyn. 52, 431–455 (2021).
upon impacts in general and during rock-barrier interaction in 14. Kobayashi, Y., Harp, E. L. & Kagawa, T. Simulation of rockfalls triggered by
flexible rockfall barriers in particular. earthquakes. Rock Mechan. Rock Eng. 23, 1–20 (1990).
The primary message of this work is therefore to incorporate 15. Blott, S. J. & Pye, K. Particle shape: a review and new methods of
shape effects in state-of-the-art models used for hazard zoning13, characterization and classification. Sedimentology 55, 31–63 (2008).
16. Volkwein, A. et al. Rockfall characterisation and structural protection—a
defining hazard scenarios not only merely via block sizes but review. Nat. Hazard. Earth Syst. Sci. 11, 2617–2651 (2011).
equally—if applicable—block shapes, that is incorporating a set of 17. Corominas, J. et al. Recommendations for the quantitative analysis of
site-specific, realistic rock shapes in hazard assessments. As landslide risk. Bull. Eng. Geol. Environ. 73, 209–263 (2014).
comparable datasets are scarce to non-existent, the now publicly 18. Ferrari, F., Giacomini, A., Thoeni, K. & Lambert, C. Qualitative evolving
available CSEC dataset47 allows the geohazard community to re- rockfall hazard assessment for highwalls. Int. J. Rock Mech. Mining Sci. 98,
88–101 (2017).
evaluate many of the existing models, which have been calibrated 19. De Biagi, V., Napoli, M. L., Barbero, M. & Peila, D. Estimation of the return
based on oversimplified assumptions and data sources. It serves period of rockfall blocks according to their size. Nat. Hazard. Earth Syst. Sci.
as an additional contribution to experimentally dissect rockfall 17, 103–113 (2017).
propagation processes and could serve as a building ground for 20. van Veen, M. et al. Combining temporal 3-d remote sensing data with spatial
more complex impact models due to its high number of recorded rockfall simulations for improved understanding of hazardous slopes within
rail corridors. Nat. Hazard. Earth Syst. Sci. 18, 2295–2308 (2018).
individual impacts. It enables detailed future sub-studies of dif- 21. Bonneau, D. A., Hutchinson, D. J., DiFrancesco, P.-M., Coombs, M. & Sala, Z.
ferent contact models and energy dissipation mechanisms and the Three-dimensional rockfall shape back analysis: methods and implications.
application of advanced machine learning algorithms as test Nat. Hazard. Earth Syst. Sci. 19, 2745–2765 (2019).
ground for suitably tuned neuronal networks for the investigation 22. Mavrouli, O. & Corominas, J. Evaluation of maximum rockfall dimensions
of inertial measurement unit sensor data. At last, the dataset can based on probabilistic assessment of the penetration of the sliding planes into
the slope. Rock Mech. Rock Eng. 53, 2301–2312 (2020).
serve as a calibration landmark for any numerical model and 23. Wegner, K. et al. Assessing the effect of lithological setting, block characteristic
hence leads to more accurate hazard assessment and ultimately and slope topography on the runout length of rockfalls in the alps and
higher safety margins for societies in rockfall prone on the la réunion island. Nat. Hazard. Earth Syst. Sci. Discuss. 2020, 1–27
environments. (2020).
24. Shen, W., Zhao, T., Dai, F., Jiang, M. & Zhou, G. G. D. Dem analyses of rock
block shape effect on the response of rockfall impact against a soil buffering
Data availability layer. Eng. Geol. 249, 60–70 (2019).
The Chant Sura Experimental Campaign dataset generated in this study has been 25. McArdell, B. W. Field measurements of forces in debris flows at the illgraben:
deposited in the EnviDat repository under Caviezel, Andrin et al. (2020). Induced Implications for channel-bed erosion. Int. J. Eros. Control Eng. 9, 194–198
Rockfall Dataset #2 (Chant Sura Experimental Campaign), Flüelapass, Grisons, (2016).
Switzerland. EnviDat. https://doi.org/10.16904/envidat.174. 26. Ash, M. et al. Two-dimensional radar imaging of flowing avalanches. Cold
Reg. Sci. Technol. 102, 41–51 (2014).
Received: 22 December 2020; Accepted: 23 August 2021; 27. Köhler, A., McElwaine, J. N. & Sovilla, B. Geodar data and the flow regimes of
snow avalanches. J. Geophys. Res. 123, 1272–1294 (2018).
28. Azzoni, A. & Defreitas, M. H. Experimentally gained parameters, decisive for
rock fall analysis. Rock Mech Rock Eng. 28, 111–124 (1995).
29. Giani, G. P., Giacomini, A., Migliazza, M. & Segalini, A. Experimental and
theoretical studies to improve rock fall analysis and protection work design.
Rock Mech. Rock Eng. 37, 369–389 (2004).
References 30. Dewez, T., Kobayashi, H., Mathon, C. & Nachbaur, A. Programme arai2. ofai,
1. Dussauge-Peisser, C. et al. Probabilistic approach to rock fall hazard expérience de lâchers d eblocs en polynésie française pour calibrer les modèles
assessment: potential of historical data analysis. Nat. Hazard. Earth Syst. Sci. 2, de trajectographie en contexte volcanique tropical. rapport final. 322 (2010).
15–26 (2002). 31. Asteriou, P. & Tsiambaos, G. Empirical model for predicting rockfall
2. Loye, A., Jaboyedoff, M. & Pedrazzini, A. Identification of potential rockfall trajectory direction. Rock Mech. Rock Eng. 49, 927–941 (2016).
source areas at a regional scale using a dem-based geomorphometric analysis. 32. Dorren, L. K. A., Berger, F. & Putters, U. S. Real-size experiments and 3-d
Nat. Hazard. Earth Syst. Sci. 9, 1643–1653 (2009). simulation of rockfall on forested and non-forested slopes. Nat. Hazard. Earth
3. Brunetti, M. T., Guzzetti, F. & Rossi, M. Probability distributions of landslide Syst. Sci. 6, 145–153 (2006).
volumes. Nonlinear Process. Geophys. 16, 179–188 (2009). 33. Labiouse, V. & Heidenreich, B. Half-scale experimental study of rockfall
4. Krautblatter, M. & Moore, J. R. Rock slope instability and erosion: toward impacts on sandy slopes. Nat. Hazard. Earth Syst. Sci. 9, 1981–1993 (2009).
improved process understanding. Earth Surf. Process. Landform. 39, 34. Giacomini, A., Thoeni, K., Lambert, C., Booth, S. & Sloan, S. W. Experimental
1273–1278 (2014). study on rockfall drapery systems for open pit highwalls. Int. J. Rock Mech.
5. D’Amato, J., Guerin, A., Hantz, D., Rossetti, J.-P. & Jaboyedoff, M. In Mining Sci. 56, 171 – 181 (2012).
Engineering Geology for Society and Territory (eds. Lollino, G et al.) vol. 2, 35. Spadari, M., Giacomini, A., Buzzi, O., Fityus, S. & Giani, G. P. In situ rockfall
1919–1923. (Springer International Publishing, 2015). testing in new south wales, australia. Int. J. Rock Mech. Mining Sci. 49, 84 – 93
6. Hartmeyer, I. et al. A 6-year lidar survey reveals enhanced rockwall retreat and (2012).
modified rockfall magnitudes/frequencies in deglaciating cirques. Earth Surf. 36. Caviezel, A. & Gerber, W. Brief communication: measuring rock decelerations
Dyn. 8, 753–768 (2020). and rotation changes during short duration ground impacts. Nat. Hazard.
7. Agliardi, F. & Crosta, G. B. High resolution three-dimensional numerical Earth Syst. Sci. Discuss. 2018, 1–10 (2018).
modelling of rockfalls. Int. J. Rock Mech. Mining Sci. 40, 455–471 (2003).
8 NATURE COMMUNICATIONS | (2021)12:5546 | https://doi.org/10.1038/s41467-021-25794-y | www.nature.com/naturecommunicationsNATURE COMMUNICATIONS | https://doi.org/10.1038/s41467-021-25794-y ARTICLE
37. Caviezel, A. et al. Reconstruction of four-dimensional rockfall trajectories Author contributions
using remote sensing and rock-based accelerometers and gyroscopes. Earth A.C. conceived the experiment. A.C., A.R., S.E.D., Y.B., M.C., G.M., A.S., E.H., L.A.E.,
Surf. Dyn. 7, 199–210 (2019). D.v.R., K.S. and P.B. carried out the experiments. P.M., P.S.N., T.B., T.A., L.C., M.S., S.R.,
38. Bourrier, F., Toe, D., Garcia, B. et al. Experimental investigations on complex C.S. and M.M. developed StoneNode Sensors and analysed sensor data. A.C., A.R., S.E.D.,
block propagation for the assessment of propagation models quality. C.E.D. and N.K. analysed the data. A.C and P.B. wrote the manuscript with discussions
Landslides 18, 639–654 https://doi.org/10.1007/s10346-020-01469-5 (2021). and improvements from all authors. L.B. and P.B. supervised the work.
39. Niklaus, P. et al. Stonenode: A low-power sensor device for induced rockfall
experiments. In IEEE Sensors Applications Symposium (SAS), 1–6 (2017).
40. Gronz, O. et al. Smartstones: A small 9-axis sensor implanted in stones to
Competing interests
The authors declare no competing interests.
track their movements. CATENA 142, 245–251 (2016).
41. ETAG 027. Guidline for european technical approval of falling rock protection
kits. https://www.eota.eu/etags-archive (2013). Additional information
42. Caviezel, A., Bühler, Y., Christen, M. & Bartelt, P. Induced rockfall dataset Supplementary information The online version contains supplementary material
(small rock experimental campaign), tschamut, grisons, switzerland. https:// available at https://doi.org/10.1038/s41467-021-25794-y.
www.envidat.ch/dataset/experimental-rockfall-dataset-tschamut-grisons-
switzerland (2018). Correspondence and requests for materials should be addressed to Andrin Caviezel.
43. Caviezel, A. et al. Design and evaluation of a low-power sensor device for
induced rockfall experiments. IEEE Trans. Instrum. Measure. 67, 767–779 Peer review information Nature Communications thanks the anonymous reviewer(s) for
(2018). their contribution to the peer review of this work. Peer reviewer reports are available.
44. Lu, G. et al. Modelling rockfall impact with scarring in compactable soils.
Landslides 64, 41 (2019). Reprints and permission information is available at http://www.nature.com/reprints
45. Spadari, M., Giacomini, A., Buzzi, O. & Hambleton, J. P. Prediction of the
bullet effect for rockfall barriers: a scaling approach. Rock Mech. Rock Eng. 45, Publisher’s note Springer Nature remains neutral with regard to jurisdictional claims in
131–144 (2012). published maps and institutional affiliations.
46. Cornwell, P. J., Pierre Beer, F. & Russell Johnston, E. In Vector Mechanics for
Engineers: Dynamics, vol. 2. (McGraw-Hill, 2010).
47. Caviezel, A. et al. Induced Rockfall Dataset #2 (Chant Sura Experimental
Open Access This article is licensed under a Creative Commons
Campaign), Flüelapass, Grisons, Switzerland. EnviDat https://doi.org/
Attribution 4.0 International License, which permits use, sharing,
10.16904/envidat.174 2020.
adaptation, distribution and reproduction in any medium or format, as long as you give
48. Crameri, F., Shephard, G. E. & Heron, P. J. The misuse of colour in science
appropriate credit to the original author(s) and the source, provide a link to the Creative
communication. Nat. Commun. 11, 5444 (2020).
Commons license, and indicate if changes were made. The images or other third party
material in this article are included in the article’s Creative Commons license, unless
indicated otherwise in a credit line to the material. If material is not included in the
article’s Creative Commons license and your intended use is not permitted by statutory
Acknowledgements
We thank the municipality of Zernez, Switzerland, for their continuous support and regulation or exceeds the permitted use, you will need to obtain permission directly from
permission to conduct experiments on the Chant Sura test site. Special thanks go to the copyright holder. To view a copy of this license, visit http://creativecommons.org/
HeliBernina, Heliswiss International AG, and Heli Air AG for their repeated precision licenses/by/4.0/.
slinging work. We thank Matthias Paintner and Kevin Fierz for their support and gui-
dance with the 8K videogrammetry.
© The Author(s) 2021
NATURE COMMUNICATIONS | (2021)12:5546 | https://doi.org/10.1038/s41467-021-25794-y | www.nature.com/naturecommunications 9You can also read