Similar importance of edaphic and climatic factors for controlling soil organic carbon stocks of the world
←
→
Page content transcription
If your browser does not render page correctly, please read the page content below
Biogeosciences, 18, 2063–2073, 2021
https://doi.org/10.5194/bg-18-2063-2021
© Author(s) 2021. This work is distributed under
the Creative Commons Attribution 4.0 License.

Similar importance of edaphic and climatic factors for controlling
soil organic carbon stocks of the world
Zhongkui Luo1 , Raphael A. Viscarra-Rossel2 , and Tian Qian1
1 College   of Environmental and Resource Sciences, Zhejiang University, Hangzhou, Zhejiang 310058, China
2 Soil   and Landscape Science, School of Molecular and Life Sciences, Curtin University, Perth, WA 6845, Australia

Correspondence: Zhongkui Luo (luozk@zju.edu.cn)

Received: 1 August 2020 – Discussion started: 11 August 2020
Revised: 2 February 2021 – Accepted: 15 February 2021 – Published: 22 March 2021

Abstract. Soil organic carbon (SOC) accounts for two-thirds        1   Introduction
of terrestrial carbon. Yet, the role of soil physicochemi-
cal properties in regulating SOC stocks is unclear, inhibit-
ing reliable SOC predictions under land use and climatic           Soil organic carbon (SOC) represents the largest pool of ter-
changes. Using legacy observations from 141 584 soil pro-          restrial carbon (Le Quéré et al., 2016; Batjes, 2016) and plays
files worldwide, we disentangle the effects of biotic, climatic    a key role in combating climate change and ensuring soil pro-
and edaphic factors (a total of 31 variables) on the global        ductivity. To better manage land for maintaining SOC lev-
spatial distribution of SOC stocks in four sequential soil lay-    els or enhancing carbon sequestration, it is vital to eluci-
ers down to 2 m. The results indicate that the 31 variables        date controlling factors of SOC stabilization and stock. As
can explain 60 %–70 % of the global variance of SOC in the         an important soil property, it is reasonable to expect that
four layers, to which climatic variables and edaphic proper-       SOC might be integrally influenced by five predominant fac-
ties each contribute ∼ 35 % except in the top 20 cm soil. In       tors controlling soil development and formation – namely,
the top 0–20 cm soil, climate contributes much more than soil      climate, organisms, topography, parent materials and time
properties (43 % vs. 31 %), while climate and soil properties      (Jenny, 1941). However, climate is usually prioritized and
show the similar importance in the 20–50, 50–100 and 100–          considered to be critical (Carvalhais et al., 2014) because
200 cm soil layers. However, the most important individual         of its direct effect on soil carbon inputs via photosynthetic
controls are consistently soil-related and include soil texture,   carbon assimilation and output via microbial decomposition.
hydraulic properties (e.g. field capacity) and pH. Overall, soil   But climate-driven predictions of SOC dynamics (e.g. using
properties and climate are the two dominant controls. Ap-          Earth system models) remain largely uncertain, particularly
parent carbon inputs represented by net primary production,        across large extents (Todd-Brown et al., 2013; Bradford et
biome type and agricultural cultivation are secondary, and         al., 2016; Luo et al., 2017).
their relative contributions were ∼ 10 % in all soil depths.          A primary source of the uncertainty is our poor under-
This dominant effect of individual soil properties challenges      standing of how edaphic properties regulate SOC stabiliza-
the current climate-driven framework of SOC dynamics and           tion and stock in soil (Davidson and Janssens, 2006; Dun-
needs to be considered to reliably project SOC changes for         gait et al., 2012). For example, SOC can be physically pro-
effective carbon management and climate change mitigation.         tected from decomposition via occlusion within soil aggre-
                                                                   gates and adsorption onto minerals (Six et al., 2000), which
                                                                   create physical barriers preventing microorganisms from de-
                                                                   composing carbon sources (Doetterl et al., 2015; Schimel and
                                                                   Schaeffer, 2012) regardless of climate conditions, but how
                                                                   this protection influences global SOC stocks is unclear. Ad-
                                                                   ditionally, the soil physicochemical environment controls the
                                                                   supply of water, nutrients, oxygen and other resources, which

Published by Copernicus Publications on behalf of the European Geosciences Union.
2064                                           Z. Luo et al.: Global SOC stocks as impacted by edaphic and climatic factors

are required for microbial communities to utilize SOC as            such as the global SoilGrids (Hengl et al., 2017). The WoSIS
well as for plant carbon assimilation to replenish soil carbon      dataset is still growing. When we visited the dataset last
pool. Considering the large spatial variability of soil prop-       on 25 March 2019, there were a total of 141 584 profiles
erties globally, we need to understand the edaphic controls         which were used in this study. These profile observations
of SOC better. By explicitly considering the effect of soil         were quality-assessed and standardized, using consistent pro-
physicochemical properties, we hope to promote a review of          cedures (Batjes et al., 2017). In each soil profile, multiple lay-
climate-driven frameworks of SOC dynamics.                          ers were sampled for determining SOC content and/or other
   In addition to our incomplete understanding of the gen-          soil properties. A total of 48 soil properties were recorded
eral importance of soil properties in regulating SOC stocks,        with multiple variates of the same property (e.g. pH mea-
whether and how their effects vary with soil depth are also         sured in H2 O, CaCl2 , KCl). In the data assessment, we con-
unclear. Most studies focus on topsoil layers (e.g. 0–30 cm),       sidered nine principal soil physicochemical properties other
even though, globally, deeper soil layers (below 30 cm) store       than SOC itself in the data analysis (Table 1). Taking the ad-
more carbon than topsoils (Jobbágy and Jackson, 2000; Bat-          vantage of all measurements, however, other soil properties
jes, 2016). Like the topsoil SOC pool, the subsoil SOC pool         were used for missing data imputation (see the Sect. 2.2).
may actively respond to climate and land use changes. Stud-         The layer depths are inconsistent between soil profiles. We
ies of whole-soil profiles have observed increased loss of          harmonized all soil properties including SOC to four stan-
subsoil SOC under warming (Pries et al., 2017; Melillo et al.,      dard depths (i.e. 0–20, 20–50, 50–100 and 100–200 cm) us-
2017; Zhou et al., 2018) as well as under additional supply of      ing mass-preserving splines (Bishop et al., 1999; Malone
fresh carbon (Fontaine et al., 2007). Land uses such as crop-       et al., 2009). This harmonization enables the calculation of
ping and grazing can also induce substantial subsoil SOC            SOC stock in the defined standard layers, making it possible
loss (Sanderman et al., 2017), which is concerning because of       to directly compare among soil profiles.
the potential adverse effects of climate and land use changes.
It is therefore imperative that we better understand the con-       2.2   SOC stock calculation and filling missing values
trolling factors of SOC in deep soil layers as this will help to
develop unbiased strategies to effectively manage whole-soil        We calculated SOC stock (SOCs , kg C m−2 ) in each standard
profile carbon.                                                     depth as
   Here, we aim to disentangle the relative importance of cli-               OC

                                                                                                 G

matic, biotic and edaphic controls on SOC stocks globally in        SOCs =       · D · BD · 1 −       ,                     (1)
                                                                             100                100
different soil layers. To do so, we assessed data from 141 584
whole-soil profiles across the globe including measurements         where OC is the weight percentage SOC content in the fine
of SOC and other soil physicochemical properties, collated          earth fraction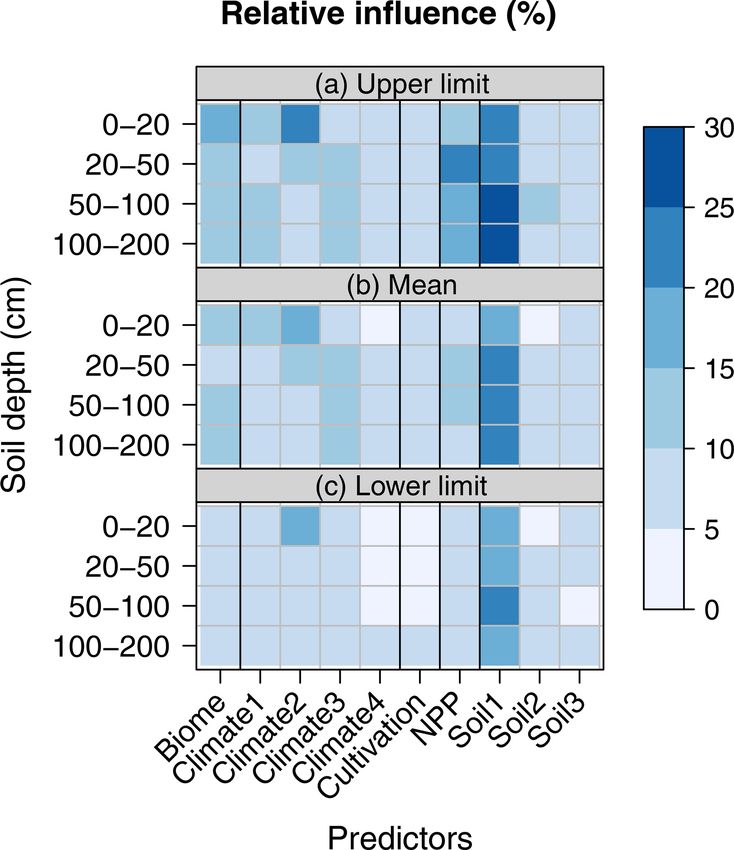
Z. Luo et al.: Global SOC stocks as impacted by edaphic and climatic factors 2065
Table 1. Covariates used in the modelling of soil carbon stocks across the globe.
Covariates Code Description Unit Data sources
Soil TCEQ Calcium carbonate content g kg−1 Batjes et al. (2017)
properties ECEC Effective cation exchange capacity cmol kg−1
ELCO Electrical conductivity dS m−1
Clay Clay content %
Sand Sand content %
Silt Silt content %
pH pH measured in H2 O –
LL15 Lower limit obtained at a matric potential of 1500 kPa %
DUL Drained upper limit obtained at a matric potential of 33 kPa %
Climatic T1 Annual mean temperature ◦C WorldClim (Fick
variables T2 Mean diurnal range ◦C and Hijmans, 2017)
T3 Isothermality (T 2/T 7 × 100) %
T4 Temperature seasonality (standard deviation ×100) ◦C
T5 Max temperature of warmest month ◦C
T6 Min temperature of coldest month ◦C
T7 Temperature annual range (T 5–T 6) ◦C
T8 Mean temperature of wettest quarter ◦C
T9 Mean temperature of direst quarter ◦C
T 10 Mean temperature of warmest quarter ◦C
T 11 Mean temperature of coldest quarter ◦C
P1 Annual precipitation mm
P2 Precipitation of wettest month mm
P3 Precipitation of driest month mm
P4 Precipitation seasonality (coefficient of variation) %
P5 Precipitation of wettest quarter mm
P6 Precipitation of driest quarter mm
P7 Precipitation of warmest quarter mm
P8 Precipitation of coldest quarter mm
Other Biome Biome type – WWF (Olson et
al., 2001)
NPP Net primary productivity kg C m−2 yr−1 MODIS (Zhao and
Running, 2010)
Cultivation Whether the land is cultivated (yes or no) – MODIS (Friedl et
al., 2010)
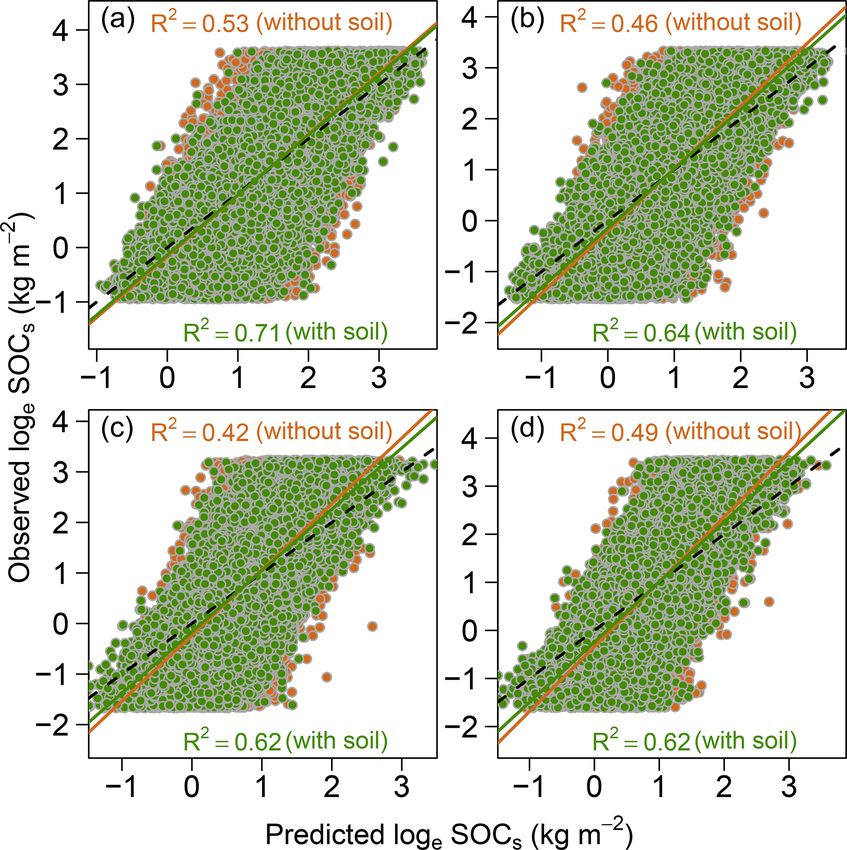
These soil profiles cover 13 major biome groups although the lite data from MODIS using the global MODIS NPP algo-
profile numbers vary from 472 in flooded grasslands and sa- rithm (Zhao et al., 2005; Zhao and Running, 2010). NPP
vannas to 24 382 in temperate broadleaf and mixed forests is the net carbon gained by plants (i.e. the difference be-
(Fig. 1). The profiles also cover various climate conditions tween gross primary productivity and autotrophic respira-
across the globe with the mean annual temperature ranging tion). If assuming a steady state of the vegetation (i.e. no
from −19.6 to 30.7 ◦ C and mean precipitation ranging from long-term directional change of carbon biomass in plants),
0 to 667.4 cm yr−1 (Fig. 1). The prediction error of the GBM NPP will end up in soil via rhizodeposition and litter fall
was propagated into the calculation of SOCs to account for and will be equal to total carbon input into soil. Here we
uncertainty resulting from data imputation (see Sect. 2.4). calculated the average NPP based on the data from 2001
to 2015 and called this average NPP the apparent carbon
2.3 Biotic and climatic covariates input to soil, acknowledging that not all ecosystems are at
strict steady state, particularly those ecosystems (e.g. crop-
For each SOC profile, NPP was extracted from the MODIS lands) actively interacting with human activities. The WWF
NPP product (Zhao and Running, 2010). The NPP prod- (World Wildlife Fund) map of the terrestrial ecoregions of
uct includes the annual NPP from 2001 to 2015 at the res- the world (Olson et al., 2001; https://www.worldwildlife.org/
olution of 1 km2 , which was estimated by analysing satel-
https://doi.org/10.5194/bg-18-2063-2021 Biogeosciences, 18, 2063–2073, 2021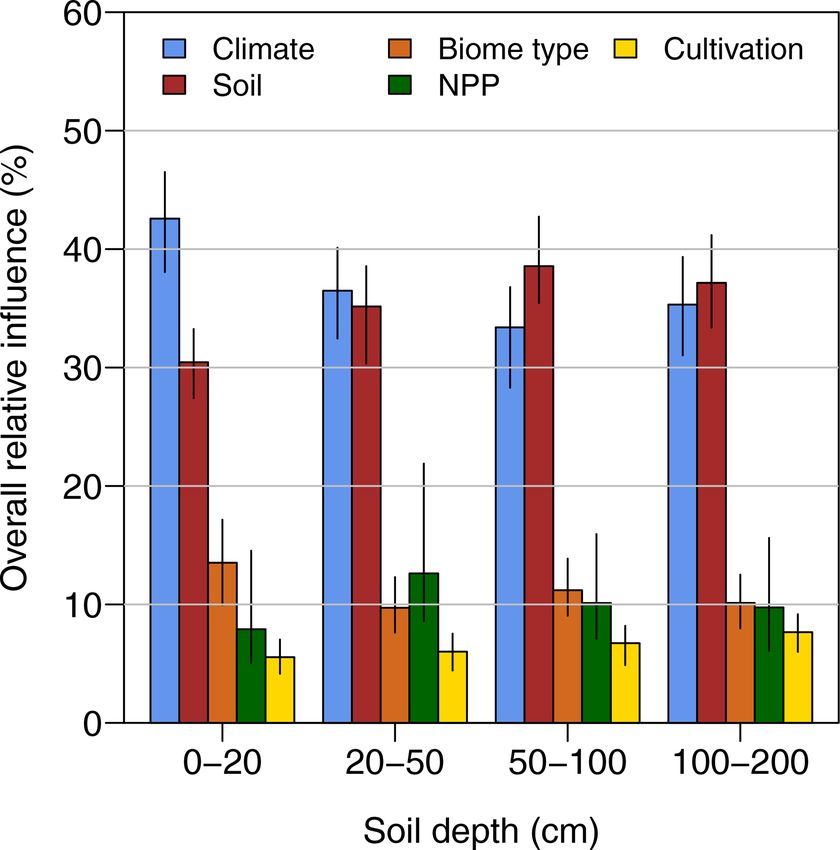
2066                                             Z. Luo et al.: Global SOC stocks as impacted by edaphic and climatic factors

                                                                       to model high-dimensional dataset, taking into account non-
                                                                       linearities and interplay (Elith et al., 2008). Using the BRT
                                                                       model, we modelled SOCs in each standard depth as a func-
                                                                       tion of edaphic variables in that depth, climatic and biotic
                                                                       variables (Table 1):

                                                                       SOCs = f (edaphic, climatic, biome, NPP, cultivation) .
                                                                                                                                     (2)

                                                                       We used a 10-fold cross validation to constrain the BRT
                                                                       model in R 3.6.1 (R Core Team, 2019) using algorithms im-
                                                                       plemented in the R package dismo. The amount of variance in
                                                                       SOCs explained by the model was assessed by the coefficient
                                                                       of determination (R 2 ). To assess the potential uncertainty in-
                                                                       duced by the uneven distribution of soil profiles across the
                                                                       globe as well as the imputation of missing BD and G for es-
                                                                       timating SOCs , we conducted 200 bootstrapping simulations
                                                                       (i.e. resample all soil profiles with replacement). For each
                                                                       bootstrap sample, SOCs , if BD and G are missing, was re-
                                                                       calculated using BD and G imputed by GBM plus an error
                                                                       randomly sampled from the distribution of imputation error.
Figure 1. Distribution of soil profiles with soil carbon data in re-   Using the new SOCs estimations, then, a new BRT model
lation to mean annual air temperature and precipitation. Different     was fitted.
colours show the biome type to which the soil profile belongs to.         Considering the potential collinearity in the 19 climatic
Numbers in parentheses show the number of soil profiles in the rel-
                                                                       variables as well as in the nine soil properties, the BRT model
evant biome. Some soil profiles (1382) were not included as climate
and/or biome type could not be identified for them.
                                                                       was conducted using their principal components. That is, a
                                                                       principal component analysis (PCA) was performed to elim-
                                                                       inate potential correlations in the soil and climatic variables,
publications/terrestrial-ecoregions-of-the-world, last access:         respectively. The important principal components (PCs) with
18 March 2021) was used to extract the biome type for each             variances of greater than 1 were retained in the BRT model
location. The MODIS land cover map (Friedl et al., 2010)               based on Kaiser’s criterion (Kaiser, 1960). The PCA was per-
at the same resolution of NPP databases was used to iden-              formed using the function prcomp in the package stats in
tify whether or not the land is cultivated (i.e. land cover type       R 3.6.1 (R Core Team, 2019). In addition, in order to demon-
of croplands and cropland/natural vegetation mosaic) at the            strate the importance of soil properties, we fitted another set
location of each soil profile.                                         of BRT models without soil properties. The model perfor-
   In addition to NPP, land cover and biome type, 19 cli-              mance with and without soil properties were compared in
matic variables (Table 1) for each SOC profile were obtained           terms of explaining the variance of SOC stocks across the
from the WorldClim version 2 (Fick and Hijmans, 2017). The             globe.
WorldClim version 2 calculates biologically meaningful vari-              The BRT model allows the estimation of the relative in-
ables using monthly temperature and precipitation during the           fluence of each individual variable in predicting SOCs , i.e.
period 1970–2000. The data at the same spatial resolution of           the percentage contribution of variables in the model. The
the NPP data (i.e. ∼ 1 km2 ) were used in this study. Eleven           relative influence is calculated based on the times a vari-
of the 19 climatic variables are temperature-related (Table 1),        able selected for splitting when growing a tree, weighted by
and eight are precipitation-related (Table 1). These variables         squared model improvement due to that splitting, and then
reflect the seasonality, intra- and inter-annual variability of        averaged over all fitted trees which were determined by the
climate, which would have both a direct (via decomposition             algorithm when adding more trees cannot reduce prediction
thus carbon outputs from soil) and an indirect (via carbon             residuals (Elith et al., 2008; Friedman and Meulman, 2003).
assimilation thus carbon inputs to soil) effect on SOC stock.          As such, the larger the relative influence of a variable, the
                                                                       stronger the effect on SOCs . In addition, we also calculated
2.4    Data analysis                                                   the 95 % confidence intervals as the 2.5 % and 97.5 quantiles
                                                                       of the relative influence estimated by 200 bootstrapping sim-
A machine learning-based statistical model – boosted regres-           ulations, which represent the uncertainty in the importance of
sion trees (BRTs) – was performed to explain the variabil-             variables. To facilitate interpretation, the relative influence of
ity of SOCs across the globe and identify important control-           each variable is scaled so that the sum of the influence of all
ling factors. A big advantage of the BRT model is its ability          variables is equal to 100. The overall relative influences of

Biogeosciences, 18, 2063–2073, 2021                                                       https://doi.org/10.5194/bg-18-2063-2021
Z. Luo et al.: Global SOC stocks as impacted by edaphic and climatic factors 2067
Figure 2. Loadings of 19 climatic variables (a) and nine soil properties (b) to the two most important principal components. T 1, annual
mean temperature; T 2, mean diurnal range; T 3, isothermality; T 4, temperature seasonality; T 5, max temperature of warmest month; T 6,
min temperature of coldest month; T 7, temperature annual range; T 8, mean temperature of wettest quarter; T 9, mean temperature of driest
quarter; T 10, mean temperature of warmest quarter; T 11, mean temperature of coldest quarter; P 1, annual precipitation; P 2, precipitation
of wettest month; P 3, precipitation of driest month; P 4, precipitation seasonality; P 5, precipitation of wettest quarter; P 6, precipitation of
driest quarter; P 7, precipitation of warmest quarter; P 8, precipitation of coldest quarter. DUL, drained upper limit of soil; LL15, lower limit
of soil; ELCO, electrical conductivity; ECEC, effective cation exchange capacity; TCEQ, calcium carbonate content; sand, silt and clay, the
fraction of sand, silt and clay content of soil; pH, soil pH. See Table 1 for more details about the variables.
edaphic (i.e. the sum relative importance of all soil-related be considered in order to explain the spatial variability of
variables) and climatic (i.e. the sum relative importance of SOC stocks across the globe. However, it is noteworthy that
all climate-related variables) variables as well as biome type, the fitted model overestimated low SOC stocks and underes-
NPP and cultivation were also calculated and compared. As timated high SOC stocks. This bias of model performance at
we have 200 estimations (i.e. 200 bootstraps) of the relative both ends of observed SOC stocks is common across all four
influence, we calculated a weighted average relative influ- depths (Fig. 3).
ence for each variable with weights based on the R 2 of each The results of the BRT model including soil properties
BRT model. (i.e. Soil1–3) indicated that Soil1 (i.e. the first PC of soil
properties) was consistently the most important individual
control of SOC stocks in the three deeper soil layers (i.e.
3 Results 20–50, 50–100 and 100–200 cm; Fig. 4). On average, Soil1
alone contributed 21 % (with 95 % confidence intervals rang-
The 19 climatic variables could be represented by four prin- ing from 17 %–24 %), 23 % (20 %–28 %) and 22 % (18 %–
cipal components (PCs, i.e. Climate1–4, which were selected 26 %) to the explained variance of SOC stocks in the three
by Kaiser’s criterion) which could explain 88 % of their vari- deeper soil layers, respectively (Fig. 4). In the top 20 cm soil
ance (Fig. 2; only the first two PCs were shown); and 72 % layer, Climate2 was the most important, contributing 19 %
of the variance in nine soil properties could be explained by (15 %–23 %) to the explained variance of SOC stocks, and
three PCs (i.e. Soil1–3, Fig. 2). For Climate1–4, the most im- Soil1 was the second most important and contributed 18 %
portant contributing variables were T 11 (mean temperature (16 %–20 %). In the three deeper layers, the second most im-
of coldest quarter), P 6 (precipitation of driest quarter), T 5 portant contributors were NPP, biome type and Climate3, re-
(max temperature of warmest month) and P 7 (precipitation spectively (Fig. 4).
of warmest quarter), respectively. For Soil1–3, the most im- Summing the relative importance of individual variables,
portant contributing variables were sand content, pH and silt the overall effect of soil properties was relatively consis-
content, respectively (Fig. 2). Using Climate1–4, NPP, biome tent among the four layers, accounting for 30 %–40 % of
type and cultivation as predictors, the BRT model could ex- the overall influence of all assessed variables respectively,
plain 53 %, 46 %, 42 % and 49 % of the variance of SOC but they were more important in the deepest two layers than
stocks in the 0–20, 20–50, 50–100 and 100–200 cm soil lay- in the first top layer (Fig. 5). The overall relative influence
ers across the globe, respectively (Fig. 3). If Soil1–3 were of climate was significantly higher than that of soil in the
included, an additional 18 %, 18 %, 20 % and 13 % of the top 20 cm soil layer (43 % vs. 31 %; Fig. 5). In the three
variance could be explained in the four layers, respectively deeper soil layers, the overall influences of climatic vari-
(Fig. 3). This result demonstrated that soil properties must
https://doi.org/10.5194/bg-18-2063-2021 Biogeosciences, 18, 2063–2073, 20212068 Z. Luo et al.: Global SOC stocks as impacted by edaphic and climatic factors
Figure 4. The relative influence of individual biotic, climatic and
Figure 3. An example of the performance of boosted regression edaphic variables influencing global soil organic carbon stocks. Up-
trees in explaining soil organic carbon stocks in four standard soil per limit (a), mean (b) and lower limit (c) show the 97.5 %, average
depths across the globe. (a) 0–20 cm, (b) 20–50 cm, (c) 50–100 cm and 2.5 % quantiles of 200 bootstrapping simulations, respectively.
and (d) 100–200 cm. The data were natural-logarithm-transformed. Biome, biome type; Climate1–4, the four most important principal
The dashed line shows the 1 : 1 line. Chocolate and green circles components of 19 climatic variables; cultivation, whether or not the
show the results without and with predictors of soil properties, re- land is cultivated (yes or no); NPP, net primary production; Soil1–3,
spectively. the three most important principal components of nine soil proper-
ties.
ables and soil properties were comparable and did not show a
significant difference. Overall, climatic variables accounted
for 43 % (38 %–47 %), 36 % (32 %–40 %), 33 % (28 %–
37 %) and 35 % (31 %–39 %) in the four layers, respectively;
and soil properties accounted for 30 % (27 %–33 %), 35 %
(30 %–39 %), 39 % (35 %–43 %) and 37 % (33 %–41 %), re-
spectively (Fig. 5). The relevant influence of the remaining
three variables (i.e. NPP, biome type and cultivation) was
secondary and marginal (∼ 10 % in terms of relevant influ-
ence) compared to climate and soil variables and together ac-
counted for the remaining ∼ 30 % of the explained variance.
With increasing soil depth, in general, the relevant influence
of climate was decreased, while the influence of soil was in-
creased. However, the overall influences of climate and soil
remained relatively stable at the level of 70 %. These results
demonstrate the comparable and primary effects of climate
and soil properties on SOC stocks.
Figure 5. The overall relative influence of edaphic, climatic and
4 Discussion biotic variables on soil organic carbon stocks in four soil depths
across the globe. The overall relative influence for climate and soil
4.1 The importance of soil properties is calculated as the sum of the relative influence of their individ-
ual variables (which is shown in Fig. 4). Error bars show the 95 %
A series of soil properties may directly or indirectly affect confidence interval estimated based 200 bootstrapping simulations.
SOC dynamic processes via influencing carbon inputs to soil,
microbial activity and accessibility of carbon substrates to
Biogeosciences, 18, 2063–2073, 2021 https://doi.org/10.5194/bg-18-2063-2021Z. Luo et al.: Global SOC stocks as impacted by edaphic and climatic factors 2069
microbes and thereby SOC stocks. Sand content (which is greater importance of climate in surface soils as topsoil is at
the most important contributor to the first PC of soil), for ex- the frontline of the interaction with the atmosphere. But our
ample, has significant effects on the formation and transfor- results do not show a clearly decreasing importance of cli-
mation of soil aggregates which regulate the stability of SOC mate with soil depth. Rather, the overall influence of climatic
as well as soil porosity and thereby oxygen availability for variables on SOC stocks is statistically similar in all soil lay-
microbial decomposition of SOC (Dungait et al., 2012; Six ers. In a forest soil, a recent study found that SOC in the
et al., 2002). In addition, soil properties such as LL15 and whole-soil profile down to 1 m is sensitive to warming (Pries
DUL have dominant control over soil water dynamics, which et al., 2017). This sensitivity may be general across the globe.
further influence water availability for plant growth. Theoret- However, it is noteworthy that neither mean annual tempera-
ically, LL15 is close to the permanent plant wilting point; it ture nor mean annual precipitation was the most important
thus may strongly regulate plant growth therefore carbon in- individual climatic variable. Rather, climatic variables re-
puts into soil and final SOC stocks. Together with DUL (i.e. flecting seasonal variability were more important. This re-
drained upper limit – soil water content obtained at the ma- sult may suggest that, except for average change trend, it is
tric potential of 33 kPa), LL15 determines the available water important to understand the change patterns of temperature
capacity of soil (AWC, i.e. the difference between DUL and and precipitation under climate change. For example, a num-
LL15), and thus LL15 would affect SOC stock via its de- ber of studies have demonstrated that extreme climate events
termination on soil AWC, while AWC couples with a series (e.g. drought and heatwaves) have significant effects on the
of soil hydrological processes such as runoff and drainage, carbon cycle, including soil carbon, due to their dramatic in-
which have direct effects on the vertical/horizontal transloca- fluence on the transport and availability of water and energy
tion of SOC (Luo et al., 2020; Kaiser and Kalbitz, 2012). Soil as well as ecosystem functional processes (Reichstein et al.,
properties are more important for controlling SOC stocks in 2013). Field observations, particularly via manipulative ex-
deeper layers than in upper layers. This phenomenon may be periments of whole-soil profile, are certainly needed to de-
due to the fact that soil structure may have substantial effects tect how deep soil carbon responds to climate change as the
on water and oxygen diffusion in deeper layers. Potentially result may have significant implications on the fate of deep
more frequent waterlogging and low oxygen in subsoil result soil carbon under future climatic conditions.
in additional environmental constraints inhibiting microbial
decomposition of SOC (Huang et al., 2020). 4.3 Secondary role of carbon inputs in determining
Our results demonstrate the primary control of soil prop- spatial variability of SOC stocks
erties on SOC stocks in the whole-soil profile across the
globe. Indeed, the results suggested that soil-related prin- The effect of apparent carbon input, NPP, on SOC stock is
cipal components were consistently the most important in- generally small in all assessed soil layers (Fig. 5). This re-
dividual influential variables in three deeper soil layers ex- sult is in line with findings from a continental-scale study
cept in the assessed 0–20 cm soil layer. Soil physical and across sub-Saharan Africa where climate and geochemistry
chemical properties directly determine the activity of the are more important predictors of SOC content than above-
decomposer community which mediates the decomposition ground carbon inputs (von Fromm et al., 2020). The impor-
of soil carbon (Derrien et al., 2014; Foesel et al., 2014; tance of NPP may largely depend on how much NPP ends
Bernard et al., 2012). More importantly, soil carbon can be up in the soil and how it is translocated to different depths
physically protected from decomposition via occlusion with (Wang et al., 2021). Total NPP may not be a useful indica-
soil aggregates and binding with minerals (Lehmann and tor of actual carbon inputs into different soil depths, partic-
Kleber, 2015; Dungait et al., 2012; Schmidt et al., 2011), ularly in deeper layers. Cultivation, for example, may sub-
while the protection capacity is largely determined by soil stantially change the fate of plant biomass – a large fraction
physicochemical properties (Six et al., 2000). These physi- of plant biomass may be harvested as yield or consumed by
cal protection processes may lead to soil-dependent stabiliza- livestock and thus does not contribute to soil carbon. This
tion/destabilization of different soil carbon substrates (Wal- could explain the phenomena that cultivation (cultivated vs.
drop and Firestone, 2004; Keiluweit et al., 2015; Six et al., non-cultivated in this study) and NPP show the similar im-
2002). However, it should be noted that complex interplays portance in general. In addition, the final importance of car-
of various soil properties are involved in SOC stabilization bon inputs may also depend on their quality (e.g. carbon-to-
and destabilization processes. It is also difficult to obtain a nitrogen ratio), while NPP alone does not bring such infor-
cause–effect conclusion on the relationship between a partic- mation. The quality of carbon inputs represented by their nu-
ular soil physicochemical property and SOC stocks. trient content and chemical structure plays a vital role in SOC
formation and transformation (Hessen et al., 2004; Jastrow
4.2 The importance of climate et al., 2007). In our study, biome type (which shows similar
importance to NPP) would partially reflect the importance
Few studies have paid particular attention to the dynamics of carbon input quality as different biome types have dis-
of SOC in subsoils across large scales. One might expect tinct carbon biomass quality (e.g. wood vs. leaf litter, which
https://doi.org/10.5194/bg-18-2063-2021 Biogeosciences, 18, 2063–2073, 20212070 Z. Luo et al.: Global SOC stocks as impacted by edaphic and climatic factors
are the main component of NPP). However, here we must to only included limited soil properties in our assessment and
point out that the minor role of carbon inputs in determining different soil properties may play different roles at differ-
the global spatial distribution of SOC stocks does not mean ent scales, scale-dependent understanding of controls over
that they are not important for local carbon management. Un- SOC stocks is important to make site-specific management
der the same climatic and edaphic conditions, indeed, carbon practices for sustainable soil use and carbon management.
inputs should be the predominant factor controlling if the soil Finally, soil samples are still limited in some areas (e.g. tun-
is a carbon sink or source (Luo et al., 2017). dra and flooded grasslands and savannas) (Batjes, 2016). We
do not know much about whether some of the relationships
4.4 Limitations and future research we find between SOC stocks and predictor variables are uni-
versal or maybe fundamentally different in less studied soils.
Although we have used a diverse and representative dataset The uneven distribution of soil samples may also help to ex-
across the globe for the analysis, there are still some limi- plain the model bias in explaining low and high SOC stocks
tations in the datasets and assessment. First, our study did (Fig. 3). Our results indicate that there are large uncertainties
not bring detailed land use history and intensity (such as the in the relative importance of climate and soil depending on
time length of cropping and the intensity of grazing) into the data used to fit the model (Fig. 5).
the analysis, which may significantly affect SOC stabiliza-
tion processes and thus SOC stocks in managed landscapes
(Sanderman et al., 2017). As anthropogenic land use may 5 Conclusions
change from year to year, it is challenging to accurately ex-
plain SOC stock changes in those systems that experience Quantitatively, we have demonstrated the primary role of soil
intensive human disturbances across large extents. Second, properties together with climate in regulating SOC stock in
all soil properties including SOC were treated as constant. In the whole-soil profile across the globe. This result has im-
reality, however, some soil properties, particularly chemical portant implications for understanding mechanisms of SOC
variables such as pH, may actively respond to external distur- stabilization and destabilization. Previous modelling and ex-
bance including human activities. Treating these variables as perimental efforts have mostly focused on climatic and bi-
constant may result in under- or overestimations of the vari- otic aspects, and many of the studies are over smaller scales.
able importance if a variable shows marked temporal vari- We argue that soil physicochemical characteristics define the
ability. Third, in managed systems, the apparent carbon input boundary conditions for the climatic and biotic factors. That
represented by NPP may not accurately reflect the real car- is, climatic and biotic factors (e.g. carbon inputs) can regulate
bon input into soil (Luo et al., 2018; Pausch and Kuzyakov, the rate of SOC of shifting from one capacity to another, but
2018) as discussed above, leading to biased estimation of the a soil’s physicochemical properties (e.g. soil structure) may
importance of C inputs. In cropping areas, for example, yield inherently determine the SOC stock capacity of soil. It is thus
harvesting and crop residue removal certainly reduce the critical to understand how soil processes mediated by differ-
fraction of NPP ending up in the soil. Fourth, we would like ent soil properties in different soil layers respond to those cli-
to point out that, albeit edaphic factors appear to be the dom- matic and biotic factors and land management practices and
inant individual controls on SOC stock, climate might have feed this information into the prediction of SOC stock capac-
an impact on those edaphic factors and hence SOC stocks in ity in the whole-soil profile. However, individual soil vari-
the long term (Jenny, 1941). Indeed, Luo et al. (2017) have ables work together involving complex interactions and non-
provided evidence that climate not only directly but also indi- linear relationships with each other as well as with climate to
rectly (via its effect on edaphic factors) exerts significant ef- regulate SOC stock (Figs. 2 and 4). We need more and better
fect on SOC dynamics. All these limitations should be over- quality data (e.g. following the same soil sampling and mea-
come to provide more robust predictions on the role of differ- suring procedure and using a novel approach for monitoring
ent factors in SOC stabilization and stock, which will be par- of soil properties) and innovative methods (Viscarra Rossel
ticularly important for understanding long-term SOC dynam- et al., 2017) for representing soil heterogeneity to facilitate
ics in managed systems. Fourth, we would like to note that robust prediction of SOC dynamics over large extents. Re-
this study focused on the controls over the global spatial pat- sults of this study further demonstrate that globally the influ-
tern of SOC stocks and did not explicitly assess the potential ence of individual climatic variables on SOC stock is weaker
variability of controls at small scales. Under different land than the influence of individual soil properties regardless of
use types, for example, factors controlling SOC stock would soil depth. Current Earth system models are mostly driven by
change. A recent study focused on SOC component fractions climate, with few cases having approximated the regulation
has found that continental drivers of SOC stocks were mod- of soil properties on carbon stabilization and destabilization
ulated by regional environmental factors (Viscarra Rossel et (Tang and Riley, 2014; Riley et al., 2014). Undoubtedly, cli-
al., 2019). In order to better understand regional-scale fac- mate has direct effect on plant growth and thus potential car-
tors controlling SOC dynamics, we should further explore bon inputs to the soil, but our results demonstrate that soil
the controls over different spatial scales. Considering that we properties are also primary controls of global SOC stocks.
Biogeosciences, 18, 2063–2073, 2021 https://doi.org/10.5194/bg-18-2063-2021Z. Luo et al.: Global SOC stocks as impacted by edaphic and climatic factors 2071
Our research highlights the urgent need to consider soil prop- Bishop, T., McBratney, A., and Laslett, G.: Modelling soil attribute
erties and their interactions with climate to provide more re- depth functions with equal-area quadratic smoothing splines,
liable predictions of SOC stock and changes under climatic Geoderma, 91, 27–45, 1999.
and land use changes. Bradford, M. A., Wieder, W. R., Bonan, G. B., Fierer, N., Raymond,
P. A., and Crowther, T. W.: Managing uncertainty in soil carbon
feedbacks to climate change, Nat. Clim. Change, 6, 751–758,
2016.
Code availability. Code used to generate the results in this study
Carvalhais, N., Forkel, M., Khomik, M., Bellarby, J., Jung, M.,
can be reasonably requested from the corresponding author.
Migliavacca, M., Mingquan, M., Saatchi, S., Santoro, M.,
Thurner, M., Weber, U., Ahrens, B., Beer, C., Cescatti, A., Ran-
derson, J. T., and Reichstein, M.: Global covariation of carbon
Data availability. Soil data including soil organic carbon and the turnover times with climate in terrestrial ecosystems, Nature,
considered soil properties from WoSIS are available at http://www. 514, 213–217, 2014.
isric.org/explore/wosis/accessing-wosis-derived-datasets, last ac- Davidson, E. A. and Janssens, I. A.: Temperature sensitivity of soil
cess: 18 March 2021. Climate data including 19 bioclimatic vari- carbon decomposition and feedbacks to climate change, Nature,
ables from WorldClim are available at https://www.worldclim.org/ 440, 165–173, https://doi.org/10.1038/nature04514, 2006.
data/worldclim21.html, last access: 18 March 2021. Derrien, D., Plain, C., Courty, P. E., Gelhaye, L., Moerdijk-
Poortvliet, T. C. W., Thomas, F., Versini, A., Zeller, B., Koutika,
L. S., Boschker, H. T. S., and Epron, D.: Does the addition of
Author contributions. ZL conceived the study and assessed the labile substrate destabilise old soil organic matter?, Soil Biol.
data; ZL interpreted the results and wrote the manuscript with the Biochem., 76, 149–160, 2014.
contribution of RAVR; TQ contributed to data assessment and cre- Doetterl, S., Stevens, A., Six, J., Merckx, R., van Oost, K., Pinto,
ating figures. M. C., Casanova-Katny, A., Muñoz, C., Boudin, M., and Vene-
gas, E. Z.: Soil carbon storage controlled by interactions be-
tween geochemistry and climate, Nat. Geosci., 8, 780–783,
Competing interests. The authors declare that they have no conflict https://doi.org/10.1038/ngeo2516, 2015.
of interest. Dungait, J. A. J., Hopkins, D. W., Gregory, A. S., and Whitmore, A.
P.: Soil organic matter turnover is governed by accessibility not
recalcitrance, Global Change Biol., 18, 1781–1796, 2012.
Acknowledgements. We thank the people who originally collected Elith, J., Leathwick, J. R., and Hastie, T.: A working guide to
the data and made this invaluable data publicly available. boosted regression trees, J. Anim. Ecol., 77, 802–813, 2008.
Fick, S. E. and Hijmans, R. J.: WorldClim 2: new 1 km spatial reso-
lution climate surfaces for global land areas, Int. J. Climatol., 37,
Financial support. This research has been supported by the Na- 4302–4315, https://doi.org/10.1002/joc.5086, 2017.
tional Natural Science Foundation of China (grant no. 41930754), Foesel, B. U., Nagele, V., Naether, A., Wust, P. K., Weinert, J.,
Fundamental Research Funds for the Central Universities (grant no. Bonkowski, M., Lohaus, G., Polle, A., Alt, F., Oelmann, Y., Fis-
2020FZZX001-06), and Research Innovation Foundation for Young cher, M., Friedrich, M. W., and Overmann, J.: Determinants of
Scholars (grant no. K20200203). Acidobacteria activity inferred from the relative abundances of
16S rRNA transcripts in German grassland and forest soils, Env-
iron. Microbiol., 16, 658–675, 2014.
Fontaine, S., Barot, S., Barré, P., Bdioui, N., Mary, B., and Rumpel,
Review statement. This paper was edited by Michael Bahn and re-
C.: Stability of organic carbon in deep soil layers controlled by
viewed by two anonymous referees.
fresh carbon supply, Nature, 450, 277–280, 2007.
Friedl, M. A., Sulla-Menashe, D., Tan, B., Schneider, A., Ra-
mankutty, N., Sibley, A., and Huang, X.: MODIS Collection 5
References global land cover: Algorithm refinements and characterization of
new datasets, Remote Sens. Environ., 114, 168–182, 2010.
Batjes, N. H.: Harmonized soil property values for broad-scale Friedman, J. H. and Meulman, J. J.: Multiple additive regression
modelling (WISE30sec) with estimates of global soil carbon trees with application in epidemiology, Stat. Med., 22, 1365–
stocks, Geoderma, 269, 61–68, 2016. 1381, 2003.
Batjes, N. H., Ribeiro, E., van Oostrum, A., Leenaars, J., Hengl, Hengl, T., Mendes de Jesus, J., Heuvelink, G. B., Gonzalez, M.
T., and Mendes de Jesus, J.: WoSIS: providing standardised R., Kilibarda, M., Blagotić, A., Shangguan, W., Wright, M. N.,
soil profile data for the world, Earth Syst. Sci. Data, 9, 1–14, Geng, X., and Bauer-Marschallinger, B.: SoilGrids250m: Global
https://doi.org/10.5194/essd-9-1-2017, 2017. gridded soil information based on machine learning, PLoS One,
Bernard, L., Chapuis-Lardy, L., Razafimbelo, T., Razafindrakoto, 12, e0169748, https://doi.org/10.1371/journal.pone.0169748,
M., Pablo, A. L., Legname, E., Poulain, J., Bruls, T., O’Donohue, 2017.
M., Brauman, A., Chotte, J. L., and Blanchart, E.: Endogeic Hessen, D. O., Ågren, G. I., Anderson, T. R., Elser, J. J., and
earthworms shape bacterial functional communities and affect De Ruiter, P. C.: Carbon sequestration in ecosystems: the role
organic matter mineralization in a tropical soil, ISME J., 6, 213– of stoichiometry, Ecology, 85, 1179–1192, 2004.
222, 2012.
https://doi.org/10.5194/bg-18-2063-2021 Biogeosciences, 18, 2063–2073, 20212072 Z. Luo et al.: Global SOC stocks as impacted by edaphic and climatic factors Huang, W., Ye, C., Hockaday, W. C., and Hall, S. J.: Trade-offs in Strand, H. E., Morrison, J. C., Loucks, C. J., Allnutt, T. F., Rick- soil carbon protection mechanisms under aerobic and anaerobic etts, T. H., Kura, Y., Lamoreux, J. F., Wettengel, W. W., Hedao, conditions, Global Change Biol., 26, 3726–3737, 2020. P., and Kassem, K. R.: Terrestrial ecoregions of the world: a new Jastrow, J. D., Amonette, J. E., and Bailey, V. L.: Mechanisms map of life on Earth, Bioscience, 51, 933–938, 2001. controlling soil carbon turnover and their potential application Pausch, J. and Kuzyakov, Y.: Carbon input by roots into the soil: for enhancing carbon sequestration, Climatic Change, 80, 5–23, Quantification of rhizodeposition from root to ecosystem scale, 2007. Global Change Biol., 24, 1–12, 2018. Jenny, H.: Factors of soil formation, a system of quantitative pedol- Pries, C. E. H., Castanha, C., Porras, R., and Torn, M.: The whole- ogy, McGraw-Hill, New York, USA, 300 pp., 1941. soil carbon flux in response to warming, Science, 355, 1420– Jobbágy, E. G. and Jackson, R. B.: The vertical distribution of soil 1423, 2017. organic carbon and its relation to climate and vegetation, Ecol. R Core Team: A language and environment for statistical comput- Appl., 10, 423–436, 2000. ing, R Foundation for Statistical Computing, Vienna, Austria, Kaiser, H. F.: The application of electronic computers to factor anal- 2019. ysis, Educat. Psychol. Meas., 20, 141–151, 1960. Reichstein, M., Bahn, M., Ciais, P., Frank, D., Mahecha, M. D., Kaiser, K. and Kalbitz, K.: Cycling downwards – dissolved organic Seneviratne, S. I., Zscheischler, J., Beer, C., Buchmann, N., matter in soils, Soil Biol. Biochem., 52, 29–32, 2012. Frank, D. C., Papale, D., Rammig, A., Smith, P., Thonicke, K., Keiluweit, M., Bougoure, J. J., Nico, P. S., Pett-Ridge, J., Weber, van der Velde, M., Vicca, S., Walz, A., and Wattenbach, M.: Cli- P. K., and Kleber, M.: Mineral protection of soil carbon counter- mate extremes and the carbon cycle, Nature, 500, 287–295, 2013. acted by root exudates, Nat. Clim. Change, 5, 588–595, 2015. Riley, W. J., Maggi, F., Kleber, M., Torn, M. S., Tang, J. Y., Le Quéré, C., Andrew, R. M., Canadell, J. G., Sitch, S., Kors- Dwivedi, D., and Guerry, N.: Long residence times of rapidly bakken, J. I., Peters, G. P., Manning, A. C., Boden, T. A., Tans, decomposable soil organic matter: application of a multi-phase, P. P., Houghton, R. A., Keeling, R. F., Alin, S., Andrews, O. D., multi-component, and vertically resolved model (BAMS1) to Anthoni, P., Barbero, L., Bopp, L., Chevallier, F., Chini, L. P., soil carbon dynamics, Geosci. Model Dev., 7, 1335–1355, Ciais, P., Currie, K., Delire, C., Doney, S. C., Friedlingstein, P., https://doi.org/10.5194/gmd-7-1335-2014, 2014. Gkritzalis, T., Harris, I., Hauck, J., Haverd, V., Hoppema, M., Sanderman, J., Hengl, T., and Fiske, G. J.: Soil carbon debt of Klein Goldewijk, K., Jain, A. K., Kato, E., Körtzinger, A., Land- 12 000 years of human land use, P. Natl. Acad. Sci. USA, 114, schützer, P., Lefèvre, N., Lenton, A., Lienert, S., Lombardozzi, 9575–9580, 2017. D., Melton, J. R., Metzl, N., Millero, F., Monteiro, P. M. S., Schimel, J. P. and Schaeffer, S. M.: Microbial control Munro, D. R., Nabel, J. E. M. S., Nakaoka, S., O’Brien, K., over carbon cycling in soil, Front. Microbiol., 3, 348, Olsen, A., Omar, A. M., Ono, T., Pierrot, D., Poulter, B., Rö- https://doi.org/10.3389/fmicb.2012.00348, 2012. denbeck, C., Salisbury, J., Schuster, U., Schwinger, J., Séférian, Schmidt, M. W. I., Torn, M. S., Abiven, S., Dittmar, T., Guggen- R., Skjelvan, I., Stocker, B. D., Sutton, A. J., Takahashi, T., Tian, berger, G., Janssens, I. A., Kleber, M., Kogel-Knabner, I., H., Tilbrook, B., van der Laan-Luijkx, I. T., van der Werf, G. Lehmann, J., Manning, D. A. C., Nannipieri, P., Rasse, D. P., R., Viovy, N., Walker, A. P., Wiltshire, A. J., and Zaehle, S.: Weiner, S., and Trumbore, S. E.: Persistence of soil organic mat- Global Carbon Budget 2016, Earth Syst. Sci. Data, 8, 605–649, ter as an ecosystem property, Nature, 478, 49–56, 2011. https://doi.org/10.5194/essd-8-605-2016, 2016. Six, J., Elliott, E. T., and Paustian, K.: Soil macroaggregate turnover Lehmann, J. and Kleber, M.: The contentious nature of soil organic and microaggregate formation: a mechanism for C sequestration matter, Nature, 528, 60–68, 2015. under no-tillage agriculture, Soil Biol. Biochem., 32, 2099–2103, Luo, Z., Wang, E., Feng, W., Luo, Y., and Baldock, J.: The im- 2000. portance and requirement of belowground carbon inputs for ro- Six, J., Conant, R. T., Paul, E. A., and Paustian, K.: Stabilization bust estimation of soil organic carbon dynamics: Reply to Keel mechanisms of soil organic matter: Implications for C-saturation et al. (2017), Global Change Biol., 24, 397–398, 2018. of soils, Plant Soil, 241, 155–176, 2002. Luo, Z., Luo, Y., Wang, G., Xia, J., and Peng, C.: Warming-induced Tang, J. and Riley, W. J.: Weaker soil carbon–climate feedbacks global soil carbon loss attenuated by downward carbon move- resulting from microbial and abiotic interactions, Nat. Clim. ment, Global Change Biol., 26, 7242–7254, 2020. Change, 5, 56–60, https://doi.org/10.1038/nclimate2438, 2014. Luo, Z. K., Feng, W. T., Luo, Y. Q., Baldock, J., and Wang, E. Todd-Brown, K. E. O., Randerson, J. T., Post, W. M., Hoffman, F. L.: Soil organic carbon dynamics jointly controlled by climate, M., Tarnocai, C., Schuur, E. A. G., and Allison, S. D.: Causes carbon inputs, soil properties and soil carbon fractions, Global of variation in soil carbon simulations from CMIP5 Earth system Change Biol., 23, 4430–4439, 2017. models and comparison with observations, Biogeosciences, 10, Malone, B. P., McBratney, A., Minasny, B., and Laslett, G.: Map- 1717–1736, https://doi.org/10.5194/bg-10-1717-2013, 2013. ping continuous depth functions of soil carbon storage and avail- Viscarra Rossel, R. A., Lobsey, C. R., Sharman, C., Flick, P., and able water capacity, Geoderma, 154, 138–152, 2009. McLachlan, G.: Novel proximal sensing for monitoring soil or- Melillo, J. M., Frey, S. D., DeAngelis, K. M., Werner, W. J., ganic C stocks and condition, Environ. Sci. Technol., 51, 5630– Bernard, M. J., Bowles, F., Pold, G., Knorr, M., and Grandy, 5641, 2017. A.: Long-term pattern and magnitude of soil carbon feedback to Viscarra Rossel, R. A., Lee, J., Behrens, T., Luo, Z., Baldock, J., the climate system in a warming world, Science, 358, 101–105, and Richards, A.: Continental-scale soil carbon composition and 2017. vulnerability modulated by regional environmental controls, Nat. Olson, D. M., Dinerstein, E., Wikramanayake, E. D., Burgess, N. Geosci., 12, 547–552, https://doi.org/10.1038/s41561-019-0373- D., Powell, G. V. N., Underwood, E. C., D’Amico, J. A., Itoua, I., z, 2019. Biogeosciences, 18, 2063–2073, 2021 https://doi.org/10.5194/bg-18-2063-2021
Z. Luo et al.: Global SOC stocks as impacted by edaphic and climatic factors                                                        2073

von Fromm, S. F., Hoyt, A. M., Acquah, G. E., Aynekulu, E.,            Zhao, M. and Running, S. W.: Drought-Induced Reduction in
  Berhe, A. A., Haefele, S. M., Lange, M., McGrath, S. P.,               Global Terrestrial Net Primary Production from 2000 Through
  Shepherd, K. D., Sila, A. M., Six, J., Towett, E. K., Trum-            2009, Science, 329, 940–943, 2010.
  bore, S. E., Vågen, T.-G., Weullow, E., Winowiecki, L. A.,           Zhao, M., Heinsch, F. A., Nemani, R. R., and Running, S. W.: Im-
  and Doetterl, S.: Continental-scale controls on soil organic           provements of the MODIS terrestrial gross and net primary pro-
  carbon across sub-Saharan Africa, SOIL Discuss. [preprint],            duction global data set, Remote Sens. Environ., 95, 164–176,
  https://doi.org/10.5194/soil-2020-69, in review, 2020.                 2005.
Waldrop, M. P. and Firestone, M. K.: Altered utilization patterns of   Zhou, X., Xu, X., Zhou, G., and Luo, Y.: Temperature sensitivity of
  young and old soil C by microorganisms caused by temperature           soil organic carbon decomposition increased with mean carbon
  shifts and N additions, Biogeochemistry, 67, 235–248, 2004.            residence time: Field incubation and data assimilation, Global
Wang, G., Xiao, L., Mao, X., Guo, X., Cowie, A., Zhang,                  Change Biol., 24, 810–822, 2018.
  S., Wang, M., Chen, S., Zhang, G., Shi, Z., and Luo, Z.:
  Most root-derived carbon inputs do not contribute to the
  global bulk soil carbon pool, Research Square [preprint],
  https://doi.org/10.21203/rs.3.rs-65178/v1, in review, 2021.

https://doi.org/10.5194/bg-18-2063-2021                                                        Biogeosciences, 18, 2063–2073, 2021
You can also read