The Welland River Eutrophication Study in the Niagara River Area of Concern in Support of the Beneficial Use Impairment: Eutrophication and ...
←
→
Page content transcription
If your browser does not render page correctly, please read the page content below
The Welland River Eutrophication Study in the
Niagara River Area of Concern in Support of the Beneficial
 Use Impairment: Eutrophication and Undesirable Algae

                                         March 2011

                                     Niagara River RAP
                                       Welland River
                                    Eutrophication Study
                                  Technical Working Group
The Welland River Eutrophication Study in the
Niagara River Area of Concern in Support of the Beneficial
 Use Impairment: Eutrophication and Undesirable Algae

                       March 2011

                Written by: Joshua Diamond
          Niagara Peninsula Conservation Authority

                        On behalf of:
    Welland River Eutrophication Technical Working Group
The Welland River Eutrophication Study in the Niagara River Area of Concern in Support of the
Beneficial Use Impairment: Eutrophication and Undesirable Algae

Written By: Joshua Diamond
            Niagara Peninsula Conservation Authority

On Behalf: Welland River Eutrophication Technical Working Group
           Niagara River Remedial Action Plan

For more information contact:
Niagara Peninsula Conservation Authority

Valerie Cromie, Coordinator
Niagara River Remedial Action Plan
Niagara Peninsula Conservation Authority
905-788-3135
vcromie@npca.ca
The Welland River Eutrophication Study in the Niagara River Area of Concern

 Welland River Eutrophication Study Technical Working Group

Ilze Andzans              Region Municipality of Niagara
Valerie Cromie            Niagara Peninsula Conservation Authority
Sarah Day                 Ontario Ministry of the Environment
Joshua Diamond            Niagara Peninsula Conservation Authority
Martha Guy                Environment Canada
Veronique Hiriart-Baer    Environment Canada
Tanya Labencki            Ontario Ministry of the Environment
Dan McDonell              Environment Canada
Annie Michaud             Niagara College (formerly Niagara Peninsula Conservation Authority)
Mary Ellen Scanlon        Ontario Ministry of the Environment
Michael Spencer           Ontario Ministry of the Environment
Lara Widdifield           City of Welland
Anne Yagi                 Ontario Ministry of Natural Resources

 Acknowledgements
 Work by several staff at the Niagara Peninsula Conservation Authority (NPCA) was instrumental
 to the completion of this study and their efforts are gratefully acknowledged:
         Ryan Kitchen, Andrea Larsen (formerly NPCA) and Lisa Moreira who assisted with
         collection of water samples and flow monitoring.
         Jayme Campbell, Jeff Lee (formerly NPCA), and Geoff Verkade for contributing
         watershed land use data and mapping for this study
 Water sampling and flow monitoring by Brian Thornburn of the Ontario Ministry of the
 Environment (MOE) was very valuable during this study and is recognized.
 The technical advice regarding nutrients export coefficients from Dr. Jenny Winter at the MOE
 and Sandra Cooke at the Grand River Conservation Authority (GRCA) was appreciated.
 In addition, discussions with Katherine Beehler of St. Lawrence River Restoration Council and
 Andrew Morley (MOE) were also helpful.
 Administrative support from Debbie Gullett (NPCA) is recognized.

 _____________________________________________________________________________________________
 Niagara River Remedial Action Plan
                                                                                                |i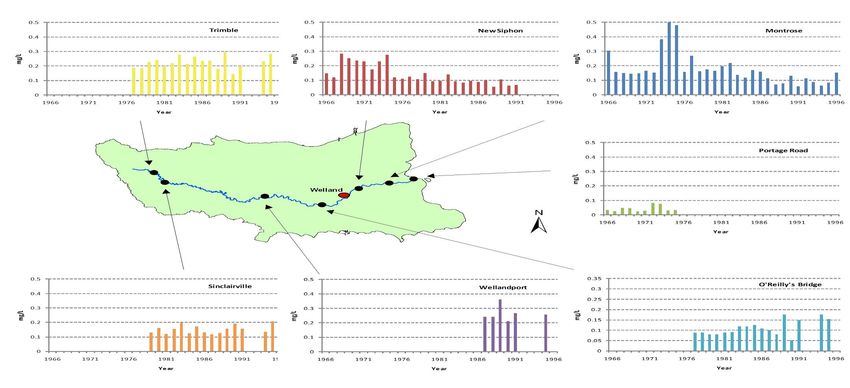
The Welland River Eutrophication Study in the Niagara River Area of Concern

Table of Acronyms
AOC             Area of Concern
BMPs            Best Management Practices
BOD             Bio-chemical (or biological) oxygen demand
BUI             Beneficial Use Impairment
CCME            Canadian Council of Ministers of the Environment
chla            Chlorophyll-a
COD             Chemical Oxygen Demand
CSO             Combined Sewer Overflow
DO              Dissolved Oxygen
EC              Environment Canada
GRCA            Grand River Conservation Authority
HEC-HMS         Hydrologic Engineering Centre-Hydrologic Modeling System
MISA            Municipal-Industrial Strategy for Abatement
MNR             (Ontario) Ministry of Natural Resources
MOE             (Ontario) Ministry of the Environment
NAESI           National Agricultural Environmental Standards Initiative
NH3             Total Ammonia
NOD             Nitrogenous Oxygen Demand
NPCA            Niagara Peninsula Conservation Authority
PWQMN           Provincial Water Quality Monitoring Network
PWQO            Provincial Water Quality Objectives
RAP             Remedial Action Plan
RMN             Regional Municipality of Niagara
SEL             Severe Effect Level (of provincial sediment quality guideline)
SOD             Sediment Oxygen Demand
SOLRIS          Southern Ontario Land Resource Information System
SW              Storm Water
TKN             Total Kjeldahl Nitrogen
TOC             Total Organic Carbon
TP              Total Phosphorus
TSS             Total Suspended Solids
TWG             Technical Working Group
WWTP            Waste Water Treatment Plant

_____________________________________________________________________________________________
Niagara River Remedial Action Plan
                                                                                           | ii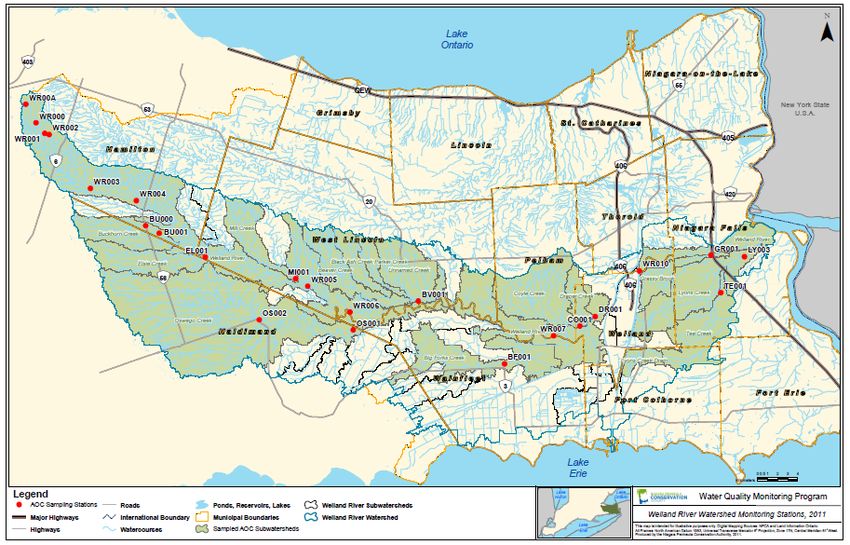
The Welland River Eutrophication Study in the Niagara River Area of Concern

Table of Contents

Welland River Eutrophication Study Technical Working Group .................................................... i
Acknowledgements ...................................................................................................................... i
Table of Acronyms ...................................................................................................................... ii
Table of Contents....................................................................................................................... iii
List of Figures ............................................................................................................................ iv
List of Tables ............................................................................................................................. vi
Appendices ............................................................................................................................... vii
1.0 Introduction .......................................................................................................................... 1
   1.1 Study Context................................................................................................................... 1
   1.2 Welland River Background ............................................................................................... 1
   1.3 Historic Welland River Water Quality ................................................................................ 4
   1.4 Water Quality Improvement Programs.............................................................................11
   1.5 Welland River Eutrophication Study Objectives ...............................................................12
2.0 Welland River Eutrophication Study ....................................................................................13
   2.1 Study Design ...................................................................................................................13
   2.2 Study Results ..................................................................................................................16
   2.3 Data Summary ................................................................................................................40
3.0 Delisting Criteria ..................................................................................................................42
   3.1 Background .....................................................................................................................42
   3.2 Delisting Criteria Definition ..............................................................................................42
   3.3 Rationale for New Delisting Total Phosphorus Criteria ....................................................43
   3.4 Development of New TP Delisting Criteria .......................................................................45
   3.5 Consideration for Use of the Revised TP Delisting Criteria ..............................................55
4.0. Recommendations to RAP Coordinating Committee ..........................................................58
   4.1 Dissolved Oxygen Study .................................................................................................58
   4.2 Target Specific Subwatersheds for Restoration ...............................................................58
   4.3 TP Delisting Criteria ........................................................................................................59
   4.4 Continued Water Quality Monitoring in Niagara River AOC ............................................62
5.0 Conclusions ........................................................................................................................63
6.0 References..........................................................................................................................65

_____________________________________________________________________________________________
Niagara River Remedial Action Plan
                                                                                                                                          | iii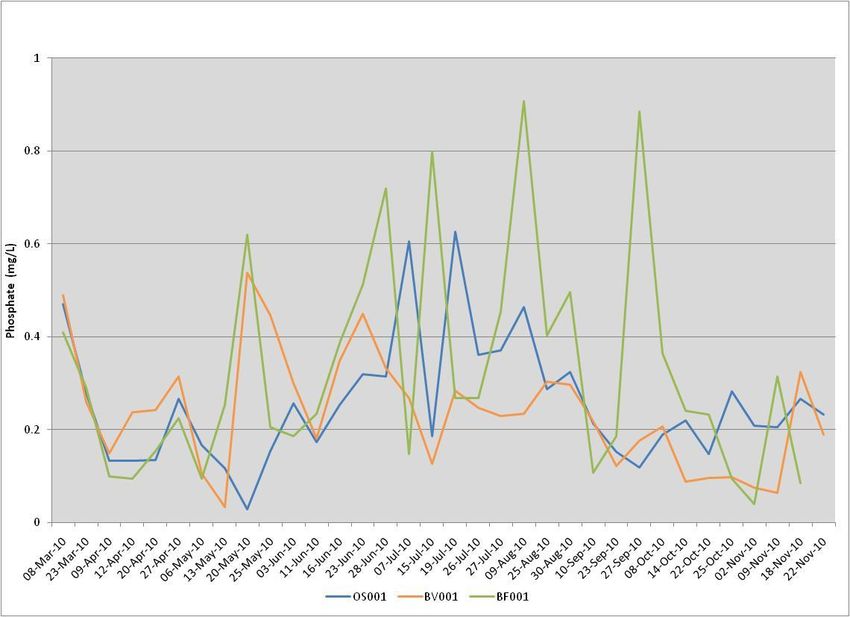

The Welland River Eutrophication Study in the Niagara River Area of Concern

List of Figures
Figure 1: Extent of the Niagara River Remedial Action Plan and Welland River Watershed

Figure 2: Historic PWQMN Total Phosphorus Concentrations (mg/L) in the Welland River from 1966 to
1996.

Figure 3: Historic PWQMN Phosphate Concentrations (mg/L) in the Welland River from 1966 to 1996.

Figure 4: Combined Sewer Overflows in the City of Welland

Figure 5: Welland River Eutrophication Study (2008-2010) water quality monitoring station locations

Figure 6: Box and Whisker Plot of total phosphorus concentrations (mg/L) of Welland River watershed
monitoring stations for 2008-2010 (n=24 for each station). The box length of the box-and-whisker plots
represents the inter-quartile range that contains the median value shown as a horizontal line. The
whiskers represent the minimum and maximum values. Red line represents PWQO (1994) for total
phosphorus.

Figure 7: Box and Whisker Plot of phosphate concentrations (mg/L) of Welland River watershed
monitoring stations for 2008-2010 (n=24 for each station). The box length of the box-and-whisker plots
represents the inter-quartile range that contains the median value shown as a horizontal line. The
whiskers represent the minimum and maximum values.

Figure 8: Box and Whisker Plot of Total Phosphorus (mg/L) of Welland River watershed monitoring
stations for 2008-2010 accounting for dry vs. wet weather sampling events (n=16 for dry and n=8 for wet
at each station). The box length of the box-and-whisker plots represents the inter-quartile range that
contains the median value shown as a horizontal line. The whiskers represent the minimum and
maximum values. Star symbols of the same colour denote significant differences (Mann Whitney U-Test,
p
The Welland River Eutrophication Study in the Niagara River Area of Concern

Figure 14: Box and Whisker Plot of Un-ionized Ammonia concentrations (mg/L) of Welland River
watershed monitoring stations for 2008-2010 (n=69 for each station). The box length of the box-and-
whisker plots represents the inter-quartile range that contains the median value shown as a horizontal
line. The whiskers represent the minimum and maximum values. Red line represents PWQO (1994) of
0.02 mg/L for Un-ionized Ammonia.

Figure 15: Box and Whisker Plot of Total Nitrogen concentrations (mg/L) of Welland River watershed
monitoring stations for 2008-2010 (n=69 for each station). The box length of the box-and-whisker plots
represents the inter-quartile range that contains the median value shown as a horizontal line. The
whiskers represent the minimum and maximum values. Red line represents published concentration for
eutrophic water quality conditions for streams (Dodds et al. 1998) of 1.5mg/L for total nitrogen.

Figure 16: Box and Whisker Plot of uncorrected Chlorophyll-a concentrations (µg/L) of the Welland River
watershed monitoring stations for 2008-2010 (n=69 for each station). The box length of the box-and-
whisker plots represents the inter-quartile range that contains the median value shown as a horizontal
line. The whiskers represent the minimum and maximum values. Red line represents NASEI (2008)
sestonic chla target of 5 µg/L.

Figure 17: Box and Whisker Plot of monthly uncorrected Chlorophyll-a concentrations (µg/L) of pooled
watershed monitoring stations for 2008-2010 (n=69 for each month except April n=46, July n=46). The
box length of the box-and-whisker plots represents the inter-quartile range that contains the median value
shown as a horizontal line. The whiskers represent the minimum and maximum values. Red line
represents NASEI (2008) sestonic chla target of 5 µg/L.

Figure 18: Dissolved Oxygen Data Logger Locations 2008-2010.

Figure 19: Scatter plot of mean surface water TP concentrations (µg/L) 2008-2009 and Sediment TP
concentrations (µg/g dry) 2008-2009 for select monitoring stations in the Welland River watershed.

Figure 20: Nomogram of Actual and Target (urban – green line; crops – blue line; pasture – red line)
Annual Average Phosphorus Concentrations at Tributary Mouths for a Given Percentage of Disturbance
in the Watershed, Based on Export Coefficients for Crops and Pasture from Winter and Duthie (2000).

_____________________________________________________________________________________________
Niagara River Remedial Action Plan
                                                                                                       |v
The Welland River Eutrophication Study in the Niagara River Area of Concern
List of Tables
Table 1: Total phosphorus, ammonia, and total Kjeldahl nitrogen loadings and proportions of loadings
from different land-uses within the Welland River watershed. Source - RMN, 2003 and MOE, 2005
Table 2: Phosphorus, ammonia, and total Kjeldahl nitrogen loadings to the Welland River from different
2
land-use types, normalized by area (km ) of that land-use type within the watershed. Source - RMN, 2003
and MOE, 2005
Table 3: Summary of monitoring stations sampled during the 2008-2010 field seasons
Table 4: Mean TP, mean phosphate and mean percent phosphate for Welland River watershed stations
(2008-2010)
Table 5: Summary of calculated TP export coefficients calculated using two different conditions: 1)
modeled runoff and mean TP for 2003-2010, and 2) empirical flow data and mean TP for 2008-2010
Table 6: Summary of ranked TP export coefficients (highest to lowest) calculated using two different
conditions (as described in Table 5)
Table 7: Provincial Water Quality Objectives for Dissolved Oxygen (1994).
Table 8. Pearson Correlation Coefficient Summary (n=573 for all other combinations) for pooled 2008-
2010 data. Yellow highlighted cells represent significant relationship to 0.05 level.
Table 9. Station Specific Pearson Correlation Coefficient Summary (n=24 for all other combinations) for
2008-2010 data. Yellow highlighted cells represent significant relationship to 0.05 level. Green highlighted
cells represent significant relationship to 0.01 level.
Table 10: MOE sediment sampling results for 2008 and 2009. Yellow cells indicate that MOE Lowest
Effect Level has been exceeded and Red cells indicate Severe Effect Level has been exceeded.
Table 11: Published Stream Total Phosphorus Criteria for riverine Systems in Canada.
Table 12: Total phosphorus export Coefficients (kg/ha/yr) in well managed systems for Urban, Crops,
Pasture, and Woodland Land Uses (Winter and Duthie 2000) and mean TP concentration for a fictitious
watershed with runoff of 0.30 m/yr.
Table 13: Percentage of Land Disturbance for Each Subwatershed based on SOLRIS (2006 & 2007)
#
Table 14: Total Phosphorus Delisting Criteria derived from Export Coefficient Approach 1 using TP
Export Coefficients from Winter and Duthie (2000) and runoff values from Natural Resources Canada
mapping (2009).
Table 15: Welland River Subwatershed Delisting Criteria and Loading Target using Export Coefficient
#
Approach 1.
_____________________________________________________________________________________________
Niagara River Remedial Action Plan
| viThe Welland River Eutrophication Study in the Niagara River Area of Concern
Table 16: Subwatershed Run-off Values from Niagara Peninsula Conservation Authority and
AquaResources Inc. 2010.
Table 17: Welland River Subwatershed Delisting Criteria and Loading Target using Export Coefficient
#
Approach 2.
Table 18: Welland River Subwatershed Delisting Criteria and Loading Target using Export Coefficient
#
Approach 3.
th
Table 19: Welland River Subwatershed Delisting Criteria and Loading Target using 25 Percentile of
Long-Term water quality monitoring data (2003-2010) for each subwatershed
Table 20: Welland River Subwatershed Delisting Criteria using Reference Watersheds (Twenty Mile
Creek and Grand River) of Long-Term water quality monitoring data (2003-2010) for each subwatershed
Appendices
Appendix A: Terms of Reference
Appendix B: Technical Working Group Meeting Minutes
Appendix C: Monitoring Stations
Appendix D: Area of Concern Water Quality Data Summary Tables
Appendix E: Total Phosphorus & Phosphate Charts
Appendix F: Precipitation 2008 – 2010
Appendix G: Total Phosphorus Loads
Appendix H: Chlorophyll 2008 – 2010
Appendix I: Dissolved Oxygen Profiles
Appendix J: Correlations
Appendix K: Regression Equations
_____________________________________________________________________________________________
Niagara River Remedial Action Plan
| viiThe Welland River Eutrophication Study in the Niagara River Area of Concern
1.0 Introduction
1.1 Study Context
The Welland River Eutrophication Study was conducted in response to an Environment Canada
(EC) Technical Review (2007) of the Beneficial Use Impairments (BUIs) and delisting criteria
identified in the Niagara River Area of Concern (AOC) Stage 2 Report (1995). This review
recognized that the existing delisting criteria for the BUI: Eutrophication and Undesirable Algae
required updating, but also recognized the need for further study to fill data gaps. These
recommendations are summarized in Appendix H of the Technical Review (2007). The Terms of
Reference and subsequent Workplan for the Welland Eutrophication Study were written and
implemented in late 2007 to address these data gaps and to outline the various monitoring
requirements and study deliverables. These documents are found in Appendix A.
The Welland River Eutrophication Study was a three year study (2008-2010) led by the Niagara
Peninsula Conservation Authority (NPCA) in partnership with the City of Welland, EC, Ontario
Ministry of the Environment (MOE), Ontario Ministry of Natural Resources (MNR), and the
Regional Municipality of Niagara (RMN). The Study was overseen by a Technical Working
Group (TWG) comprising of study partners with relevant expertise in Eutrophication and Algae
ecology. The TWG approved the Study Work Plan and met annually to discuss yearly results
compiled by the NPCA in Technical Reports. The Minutes for all TWG meetings are found in
Appendix B.
1.2 Welland River Background
The Welland River is the largest river tributary to the Niagara River Area of Concern (AOC).
Located above the Niagara Escarpment, the Welland River watershed is a dense network of
smaller tributaries with similar characteristics to the main river. It flows in an easterly direction,
from its headwaters south-west of Hamilton in the Mount Hope area, and meanders over a
course of 132 km until it reaches the Queenston-Chippawa Power Canal into which it presently
discharges. It drains lands in Haldimand, Norfolk and Niagara over an area of approximately
880 km2 and its watershed encompasses over 80% of the Canadian portion of the AOC (Figure
1). The Welland River watershed is in the Haldimand Clay Plain. The basin is very flat with an
average gradient of 0.58 metres/kilometres and, due to the clay soils, it is imperfectly drained.
In 1792, the river was described as “a dull muddy river running through a flat swampy country”
by Mrs. Simcoe, wife of the first Lieutenant Governor of Upper Canada. Within the watershed,
the major economic activity is agriculture and there are no major industries located upstream of
the City of Welland.
Niagara River Remedial Action Plan
1The Welland River Eutrophication Study in the Niagara River Area of Concern
Figure 1: Extent of the Niagara River Remedial Action Plan and Welland River Watershed
Niagara River Remedial Action Plan
2The Welland River Eutrophication Study in the Niagara River Area of Concern
Historically, the Welland River drained into the Niagara River at the Town of Chippawa. Along
its entire route, the Welland River has been greatly altered by humans. In 1971, the NPCA
constructed a dam on the river near Binbrook in the upper reaches of the watershed which
created Lake Niapenco, also known as the Binbrook Reservoir. The dam was created for the
purpose of low flow augmentation as the river often experienced periods of zero flow during
drought conditions. Continuing eastward the river also flows through the City of Welland where it
is siphoned under the Old and New Welland Ship Canals. The final outlet of Welland River
water is via the Power Canal to the lower Niagara River at Sir Adam Beck generating stations.
Considerable alterations made to the Welland River since European settlements have created
an extremely complex system. The river has been channelized, relocated, dredged and diverted
for both shipping and hydroelectric production. It has been described as one of the most
complex river systems in Ontario, with seven physically different sections (Upper Welland River,
Lake Niapenco (Binbrook Reservoir), Welland River upstream of Port Davidson Weir, Welland
River West of Welland to the Port Davidson Weir, Between the Two Canals (Lake Erie
Diversion), Downstream of the New Canal to Power Canal and the Power Canal to Niagara
River (Chippawa Channel, Niagara River Diversion). The net result of these activities causes
flow barriers to the Welland River which, in turn, creates water dilution, sediment and pollutant
trapping, and flow reversal patterns in the river. This situation makes it difficult to determine
both the source and fate of sediment, phosphorous, bacteria and other pollutants entering the
Welland River. The river exhibits all of the qualities of a degraded system (i.e. impaired water
quality, and impaired fish & wildlife habitat and their communities).
In summary, the significant changes since European settlement include:
Significant reduction of forest cover from urban development and agricultural practices;
Draining of the land for agriculture;
Increased erosion related to construction, agriculture and cattle access;
Nutrient loading from Waste Water Treatment Plant and Combined Sewer Overflows;
Impacts from the development and management of Binbrook Reservoir;
Installation of weirs along various creeks and tributaries to the River;
Changes associated with the construction of the Welland shipping canals;
Historical dredging of the river channel from Port Davidson to the Niagara section of the
River;
Changes in flow regimes arising from diversions of water into and out of the Welland
River and the flow reversal in the lower portion of the River due to hydroelectric
operations; and
Daily fluctuations in levels and flows from the control of the Chippawa-Grass Island Pool
levels.
Niagara River Remedial Action Plan
3The Welland River Eutrophication Study in the Niagara River Area of Concern
1.3 Historic Welland River Water Quality
Ambient water quality monitoring of the Welland River dates back to 1966 and continues to
1991 with water samples collected through the Provincial Water Quality Monitoring Network
(PWQMN). The MOE continued monitoring at the Montrose Road station until 2003. In 1994 to
1996 the NPCA received a sampling allotment for continued water quality monitoring in the
Welland River watershed.
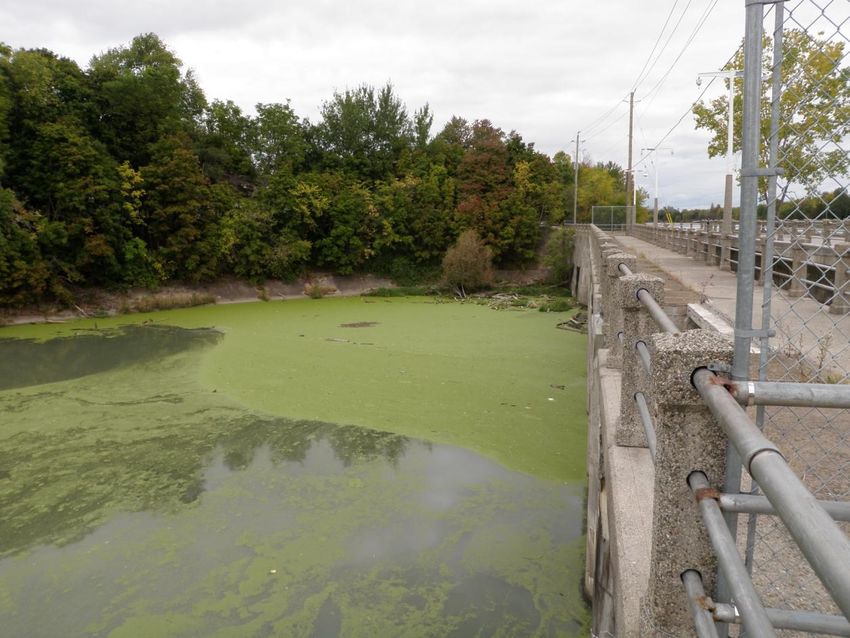
The greatest problem identified in the historic water quality dataset of the Welland River
upstream of the City of Welland is the chronically high phosphorus concentrations and its
related effects throughout the watershed (RAP 1995). Total phosphorus (TP) concentrations
(Figure 2) during this historic data set regularly exceeded the Provincial Water Quality Objective
(PWQO) of 0.03 mg/L (MOE 1994). Generally, TP concentrations increase in the Welland River
watershed from the headwater sections to the lower reaches near the City of Welland. It is at
this point where the redirection of Niagara River water down the Welland River in Chippawa for
Ontario Power Generation causes a dilution effect on water quality parameters. Historic
phosphate concentrations (Figure 3) in the Welland River follow a similar trend to TP
concentrations.
Niagara River Remedial Action Plan
4The Welland River Eutrophication Study in the Niagara River Area of Concern
Figure 2: Historic PWQMN Total Phosphorus Concentrations (mg/L) in the Welland River from 1966 to 1996.
Niagara River Remedial Action Plan
5The Welland River Eutrophication Study in the Niagara River Area of Concern
Figure 3: Historic PWQMN Phosphate Concentrations (mg/L) in the Welland River from 1966 to 1996.
Niagara River Remedial Action Plan
6The Welland River Eutrophication Study in the Niagara River Area of Concern
The Welland River is the largest tributary of the Canadian portion of the Niagara River AOC and
was identified through the RAP Stage 1 (Remedial Action Plan 1993) and RAP Stage 2
(Remedial Action Plan 1995) reports as a potential source for various contaminants to the
Niagara River. The RAP evaluated the impairment status of several BUIs in the Niagara River
RAP including the BUI: Eutrophication and Undesirable Algae. This evaluation designated the
BUI: Eutrophication and Undesirable Algae in the Niagara River AOC as impaired.
In 2001, the NPCA initiated a Water Quality Monitoring Program with the purpose of gathering
long-term surface water quality data. The funding for this program is supported through multiple
partnerships. Within the Niagara River AOC, the MOE has reactivated two dormant PWQMN
stations. The City of Hamilton and RMN provide funding for staff and lab analysis. EC has
provided funding for this program for lab analysis through the Great Lakes Sustainability Fund.
The current network of 73 water quality monitoring stations represents the largest and most
comprehensive water quality monitoring program in the Niagara Peninsula. Water quality data
collected through this program has been summarized in NPCA Annual Water Quality Reports
(NPCA 2006-2010) and other Niagara River RAP reporting requirements (NPCA 2003, NPCA
2004). Water quality monitoring of the Welland River through this program continues to
regularly find total phosphorus concentrations in the Welland River in exceedence of the PWQO
(MOE 1994).
Between 2005 and 2007, a 10-year review of the framework for implementation of remedial
actions was undertaken as part of the Niagara River (Ontario) RAP. This included review and,
where applicable, revision of the status of BUIs. The EC (2007) Technical Review of
Impairments and Delisting Criteria. Niagara River (Ontario) RAP reported anecdotal evidence of
persistent and reoccurring algal blooms in the Welland River from the mid-1990s until 2007.
This anecdotal evidence was mainly based on comments made by residents living in the
Welland River watershed often in the summer. However, there is very little scientific data to
verify that algae blooms are regularly occurring in the Welland River as a consequence of high
nutrient concentrations. A water quality study of Binbrook Reservoir by the MOE staff (Gemza
1993) included an algae assessment and this study concluded the occurrences of algae blooms
were very infrequent. But there were some blue-green algae blooms noted in mid to late
summer. This generally agrees with NPCA field and technical staff observations over the years.
The EC Technical Review (2007) reported dissolved oxygen (DO) conditions were found in
several sections of the Welland River were below PWQO (MOE 2004). This was mainly based
on DO monitoring the NPCA conducted in the night-time of August 1994 to determine if low DO
conditions were occurring. The NPCA determined that 86% of the night-time results were below
the PWQO (MOE 2004). The EC Technical Review (2007) also used daytime supersaturation
of DO as an indicator of the risk of oxygen depletion due to algal or macrophyte respiration. At
NPCA Welland River water quality stations in 2003 and 2004, percent saturation of DO
exceeded 100% in 19% of (25 of 129) samples. The EC Technical Review suggested DO
impairments are likely caused by algae blooms and decomposition, macrophyte overgrowth and
bio-chemical oxygen demand (BOD) from the City of Welland Combined Sewer Overflows
(CSOs) and Waste Water Treatment Plant (WWTP). In 2007, NPCA deployed a DO logger in
Niagara River Remedial Action Plan
7The Welland River Eutrophication Study in the Niagara River Area of Concern
the Welland River at E.C. Brown Conservation Area and observed sustained DO conditions that
were below the PWQO for parts of the summer. This supports EC Technical Review of the
existing data that concentrations of DO are below the PWQO in some sections of the Welland
River. Further data was still needed to determine the spatial range of these DO impairments.
In 2003, the RMN retained consultants as part of the Niagara Water Quality Protection Strategy
(RMN 2003). These consultants carried out a simple mass balance modeling of contaminant
loads in watersheds across the Niagara Peninsula and the Welland River. This analysis was
incorporated into the EC Technical Review (2007) of the BUI for Eutrophication and Undesirable
Algae. Modeling was conducted for TP, total Kjeldahl nitrogen (TKN), and total ammonia (NH3),
as well as other contaminants (E. coli, copper, Total Suspended Solids (TSS). Results were
categorized by land area or effluent source including, CSO, urban storm water (SW), urban
WWTP, agricultural lands, and parks/open space/forest (classed as “other”). Additional nutrient
loading data was supplied by the MOE (2005) through Municipal-Industrial Strategy for
Abatement (MISA) contaminant load calculations based on recent (2000-2002) effluent
monitoring at WWTPs within the Welland watershed. Results of this work are shown in Table 1
and Table 2 below.
Table 1: Total phosphorus, ammonia, and total Kjeldahl nitrogen loadings and proportions of loadings
from different land-uses within the Welland River watershed. Source - RMN, 2003 and MOE, 2005
Land-Use TP (kg/yr) % NH3 (kg/yr) % TKN (kg/yr) %
Urban SW 2192.00 3.03 2192.00 0.78 1461.40 0.36
Urban CSO 867.00 1.20 N/A 0.00 N/A 0.00
Urban WWTP 7442.83 10.30 131813.43 46.68 156670.87 38.65
Agriculture 58993.63 81.67 145610.65 51.56 226823.84 55.95
Other 2738.54 3.79 2786.06 0.99 20417.65 5.04
Total 72234.00 100.00 282402.14 100.00 405373.76 100.00
Table 2: Phosphorus, ammonia, and total Kjeldahl nitrogen loadings to the Welland River from different
2
land-use types, normalized by area (km ) of that land-use type within the watershed. Source - RMN, 2003
and MOE, 2005
2 2 2 2
Land-Use Area (km ) TP (kg/km /yr) NH3 (kg/km /yr) TKN (kg/km /yr)
Urban 20.50 512.18 6535.57 7712.26
Agriculture 760.37 77.59 191.50 298.31
Other 417.03 6.57 6.68 48.96
Niagara River Remedial Action Plan
8The Welland River Eutrophication Study in the Niagara River Area of Concern
A summary of RMN 2003 study results are as follows:
Phosphorus loading from urban stormwater, agricultural land, and other lands was
determined by mass balance modeling (RMN 2003). Loadings from CSOs were
estimated using the XP-SWMM model and 1980 rainfall data (RMN 2003). Loadings
from the City of Welland and Port Robinson Lagoon WWTPs were provided by MOE
(MOE 2005);
Agricultural land uses are the greatest source of phosphorus to the Welland River;
Urban areas contribute a much greater load of nutrients per unit area based on the data
shown above;
Modeling results have not been calibrated with observed water quality.
The City of Welland is serviced by a complex collection system that includes a total of 18 CSO
locations, a deep interceptor sewer, a storage facility, and two major pumping stations (RV
Anderson and Associates and XCG Consultants LTD 2003). Figure 4 shows the location of the
CSOs in the City of Welland. A review conducted by RV Anderson and Associates and XCG
Consultants LTD. (2003) found surcharge data along the interceptor sewer indicated
surcharging conditions frequently occurred in the interceptor sewer during wet weather events.
They also reported that during these wet weather events the hydraulic grade line in the
interceptor sewer would exceed the overflow elevations at a number of CSO locations.
Overflows at other locations were occurring due to the limited capacity of the diversion
structures.
CSOs continue to affect the water quality of the Welland River. In 2009, the City of Welland and
the RMN initiated a project to complete major sewer separation works in various areas of the
City and to become compliant with the Ontario Ministry of the Environment Procedure F-5-5
(MOE 2001). It is anticipated that through this project 100% of the remaining CSOs will be
separated within the next 8-10 years and 75% of wet weather flows will be captured upon
completion of this separation.
Niagara River Remedial Action Plan
9The Welland River Eutrophication Study in the Niagara River Area of Concern
Figure 4: Combined Sewer Overflows in the City of Welland
Niagara River Remedial Action Plan
10The Welland River Eutrophication Study in the Niagara River Area of Concern
1.4 Water Quality Improvement Programs
Since the establishment of the Niagara River AOC there have been many efforts to improve
water quality in the Welland River watershed. The following items highlight the progress towards
Implementing Priority RAP Actions to improve Welland River water quality. These include:
The NPCA’s Water Quality and Habitat Improvement Program received over $2.6M from
Environment Canada’s Great Lakes Sustainability Fund over 15 years (1994-2009) and
restored wetland (147 ha), riparian (54 km) and forest (338 ha) habitats. It has also
funded the containment of 81,776 m3/yr of manure and fenced 2,515 livestock;
Completion of the detailed assessment for the 14 potentially contaminated sediment
areas identified in the Stage 1 and Stage 2 documents;
Completion of the Welland River Reef Cleanup Project to address Recommendation #16
in the RAP Stage 2 report (1995);
The City of Welland’s new Official Plan incorporates RAP supported policies for
contaminated sediments in Lyon’s Creek East; Natural Heritage; urban stormwater,
reduction of CSOs, etc;
Stormwater Management, Erosion and Sediment Policies completed through the
Niagara Water Strategy for implementation by municipalities;
Removal and mitigation of barriers to fish migration completed by the Niagara
Restoration Council;
Establishment of the Niagara Peninsula Conservation Authority’s (NPCA) GIS
restoration database;
Natural Heritage Inventory of the Niagara River AOC report and mapping completed;
Development of Natural Heritage Strategy for entire Niagara Region underway in
collaboration with stakeholders;
Ongoing implementation of the agreement between NPCA and Ontario Power
Generation to mitigate the effects of Welland River flow reversal through restoration
strategies such as wetland securement, riparian plantings, fish spawning improvements,
etc;
Ongoing sanitary/storm sewer separation in the City of Welland to reduce bypasses at
the Water Pollution Control Plant;
Regional and municipal infrastructure upgrades;
Fisheries Community Monitoring and Implementation of the Walleye restoration project
in the Welland River West and habitat enhancement projects planned (with some
already implemented);
Completion of the Niagara River Watershed Fish Community Assessment (2003 to
2007) by the MNR. This draft report indicates that the Welland River Fish Community
has begun moving along the path to recovery from the severe pollution in the 1960s
(partially due to uncontrolled sewage discharge) and implementation of MOE policy
F-5-5.
Niagara River Remedial Action Plan
11The Welland River Eutrophication Study in the Niagara River Area of Concern
1.5 Welland River Eutrophication Study Objectives
The purpose of the Welland River Eutrophication Study is to refine and implement the
Recommendations for Monitoring and Assessment as formulated by the 2007 Technical Review
Committee in Appendix H Eutrophication and Undesirable Algae. This is accomplished by
addressing the following study objectives:
1) Characterize the biological response of the Welland River to high phosphorus inputs
including the type, frequency, location and timing of algal blooms, and whether oxygen
depletion (anoxia) is occurring in relation to aquatic plant and algae overgrowth;
2) Characterize concentrations of plant-available phosphorus versus sediment-bound
phosphorus along the length of the Welland River;
3) Develop delisting criteria for the Welland River upstream of the Old Welland Canal which
identify the desired conditions in the river with regard to dissolved oxygen and
abundance of algae/aquatic plants;
4) Develop phosphorus loading targets for different subwatersheds of the Welland River
upstream of the Old Welland Canal to meet delisting criteria, and;
5) Monitor success in meeting ambient targets for the Welland River through alterations to
the existing AOC Tributary Monitoring Program.
The information found within this report is intended to assist the Niagara River RAP
Coordinating Committee in determining the current Welland River watershed conditions relative
to what the TWG believes are desirable and achievable goals for the BUI: Eutrophication and
Undesirable Algae. Recommendations and conclusions are provided at the end of this report
based on the data examined by the TWG.
Niagara River Remedial Action Plan
12The Welland River Eutrophication Study in the Niagara River Area of Concern
2.0 Welland River Eutrophication Study
2.1 Study Design
In January 2008, the Technical Working Groups (TWG) approved the Study Work Plan found in
Appendix A. As part of this Work Plan the results of each field season were reviewed by the
TWG at the end of each field season. The Niagara Peninsula Conservation Authority (NPCA)
produced annual Technical Reports (2008, 2009, and 2010) to summarize each field season’s
results. This allowed the TWG group an opportunity to adjust the next field season’s monitoring
to address any identified data gaps.
As part of the Work Plan, the NPCA continued to collect surface water quality grab samples at
23 monitoring stations in the Welland River watershed (Figure 5). Photos of the sample
stations can be found in Appendix C. Samples were collected monthly from April to November
each year of 2008, 2009 and 2010, and a mix of both dry and wet weather sampling was
conducted. All samples were analyzed for nutrients, metals, bacteria, suspended solids, and
general chemistry. These samples were sent for analysis at one or in some cases multiple
laboratories, including the City of Hamilton Environmental Laboratory, Exova Accutest
Laboratory in Ottawa, and the Ontario Ministry of the Environment (MOE) laboratory in Toronto.
All three labs are accredited and the location where each sample was sent for analysis can be
found in Table 3. The use of multiple labs for analysis reflects the funding arrangements and in-
kind contributions that the NPCA has with its partners. To account for any potential differences
in lab analysis for key study parameters, the TWG required duplicate samples be collected at all
23 stations and sent to the MOE lab for nutrient analysis as a quality assurance/quality control
measure.
Niagara River Remedial Action Plan
13The Welland River Eutrophication Study in the Niagara River Area of Concern
Figure 5: Welland River Eutrophication Study (2008-2010) water quality monitoring station locations
Niagara River Remedial Action Plan
14The Welland River Eutrophication Study in the Niagara River Area of Concern
Table 3: Summary of monitoring stations sampled during the 2008-2010 field seasons
Station Watershed Laboratory Municipality Sample Location
WR00A Welland River Hamilton City of Hamilton Book Street
WR000 Welland River Hamilton City of Hamilton Butter Road
WR001 Welland River Hamilton City of Hamilton Airport Road
WR002 Welland River Hamilton City of Hamilton Airport Road
WR003 Welland River Hamilton City of Hamilton Tyneside Road
WR004 Welland River Hamilton City of Hamilton Harrison Road
WR005 Welland River Exova West Lincoln Church Road
WR006 Welland River Exova Township of West Lincoln Port Davidson Weir
WR007 Welland River MOE City of Welland O'Reilly's Bridge
WR010 Welland River MOE City of Welland Bigger Road
BF001 Big Forks Creek Exova Township of Wainfleet Gents Road
BU000 Buckhorn Creek Hamilton City of Hamilton Trimble Road
BU001 Buckhorn Creek Hamilton City of Hamilton Haldibrook Road
BV001 Beaver Creek Exova Township of West Lincoln Canborough Road
CO001 Coyle Creek Exova City of Welland Pelham Road
DR001 Drapers Creek Exova City of Welland Colbeck Road
EL001 Elsie Creek Exova Township of West Lincoln Regional Road #9
GR001 Grassy Brook Exova City of Niagara Falls Montrose Road
LY003 Lyons Creek Exova City of Niagara Falls Stanley Avenue
MI001 Mill Creek Exova Township of West Lincoln Regional Road #14
OS001 Oswego Creek Exova Haldimand County Diltz Road
OS002 Oswego Creek Exova Haldimand County Canborough Road
TE001 Tee Creek Exova City of Niagara Falls Schisler Road
The TWG identified the need to collect sestonic chlorophyll-a (chla) samples to provide an
estimate of algae concentrations in the Welland River. To do this, supplementary grab samples
were collected monthly from April to November 2008, from May to November 2009 and from
April to November 2010 (no results from July 2010) at all 23 stations. All samples collected were
sent to the Canada Centre for Inland Waters laboratory for analysis. Chla samples were
corrected when pheophytin, a degradation product of chlorophyll, had become high enough to
show up at the same absorption peak as chla. The correction involves acidifying the sample and
re-running the analysis. However, to be conservative for this analysis only the uncorrected
concentrations are reported in this section. The TWG also identified the need to collect
Dissolved Oxygen (DO) in the Welland River watershed as part of this study. The NPCA and
MOE deployed DO loggers in the main Welland River channel and in various subwatersheds
each field season. Specific details regarding sample location will be discussed later in the
report. For the 2010 field season, weekly water samples at three tributaries (BV001, BF001 and
OS001) were collected to capture a larger number of wet weather events.
The NPCA and MOE recorded flow measurements during grab sampling where conditions
permitted safe access. Depth and velocity measurements were recorded along a single transect
at each station. Where watercourse conditions were too deep for access, a stage measurement
was recorded and a discharge was determined using NPCA rating curves where available.
Niagara River Remedial Action Plan
15The Welland River Eutrophication Study in the Niagara River Area of Concern
2.2 Study Results
Sections 2.2.1 to 2.2.7 summarize the water quality data collected by the TWG during the 2008
to 2010 field seasons. Water quality parameters that are examined in this study include total
phosphorus, phosphate, total nitrogen, nitrate, un-ionized ammonia, sestonic chlorophyll-a, and
DO in the Welland River and its tributaries. Concentrations of nutrients in stream sediment are
also summarized for select locations. All water quality data for each station is found in
Appendix D.
2.2.1 Phosphorus
Phosphorus is a natural element found in rocks, soils and organic material and is an essential
nutrient for plant growth (Smith 1992). Phosphorus clings tightly to soil particles and is often
associated with suspended sediment. In natural and minimally impacted aquatic ecosystems
phosphorus is generally in short supply and limits biological growth. However, in human
impacted aquatic ecosystems excessive phosphorus concentrations can stimulate overgrowth
of algae and other aquatic plants. The decomposition of this organic matter in turn depletes DO
concentrations and stresses aquatic organisms such as fish and benthic invertebrates.
Anthropogenic sources of phosphorus include fertilizers, and sewage discharges.
Total phosphorus is a measure of all forms of phosphorus in a water sample, and includes
biologically available forms. This section will report on total phosphorus and phosphate. The
interim Ontario Provincial Water Quality Objective (PWQO) for total phosphorus in streams and
rivers is 30 µg/L (MOE 1994). This interim guideline represents the concentration of total
phosphorus required to eliminate excessive plant growth in rivers and streams. There is no
PWQO for phosphate, but the relative proportion of phosphate to total phosphorus can provide
some understanding of potential biological response of the aquatic ecosystem system to this
nutrient.
Both total phosphorus (TP) and phosphate were analyzed in samples collected from April to
November in 2008-2010 for all stations. To achieve appropriate detection limits for this study
total phosphorus samples were sent to Exova Laboratories and phosphate samples were
analyzed at the MOE lab as filtered reactive phosphate (PO43).
Ninety-nine percent of the grab samples collected in the 2008-2010 study failed to meet the
interim PWQO of 30 µg/L for total phosphorus. Box and whisker plots of total phosphorus and
phosphate concentrations are illustrated in Figure 6 and Figure 7 for each station. Monthly
concentrations for total phosphorus and phosphate were plotted together to illustrate seasonal
phosphorus variation at each station and are provided in Appendix E. The Welland River
watershed has a significant phosphorus problem with mean TP concentrations for each station
ranging from 200% to 1500% greater than the PWQO. The highest total phosphorus
concentrations were observed at Big Forks Creek (BF001), Buckhorn Creek (BU000 & BU001),
Beaver Creek (BV001), Oswego Creek (OS001 & OS002) and Tee Creek (TE001). Generally,
Niagara River Remedial Action Plan
16The Welland River Eutrophication Study in the Niagara River Area of Concern
TP concentrations in the main Welland River channel were similar except for station WR010
where a decline in TP concentration was observed. This is likely due to mixing and dilution from
the Niagara River. The agricultural watersheds of Coyle Creek (CO001), Lyons Creek (LY003)
and Mill Creek (MI001) as well as the urbanized watershed of Drapers Creek (DR001) had the
lowest observed TP concentrations.
Figure 6: Box and Whisker Plot of total phosphorus concentrations (mg/L) of Welland River watershed
monitoring stations for 2008-2010 (n=24 for each station). The box length of the box-and-whisker plots
represents the inter-quartile range that contains the median value shown as a horizontal line. The
whiskers represent the minimum and maximum values. Red line represents PWQO (1994) for total
phosphorus.
Niagara River Remedial Action Plan
17The Welland River Eutrophication Study in the Niagara River Area of Concern
The proportion of mean phosphate of mean total phosphorus concentrations for samples
collected in the main Welland River channel ranged from 4% - 58% (Table 4). Phosphate
concentrations increased sharply in the Welland River between stations WR004 and WR005
(Figure 7). This increase in phosphate concentrations continues downstream and peaks at
station WR007 before decreasing at station WR010 likely due to mixing with the Niagara River
(Figure 6). The proportion of phosphate observed in the Welland River tributaries ranged from
24% to 68% with most of these stations exceeding 50% (Table 4). The highest concentrations
of phosphate were observed in Big Forks (BF001), Beaver Creek (BV001), Oswego Creek
(OS001), and Tee Creek (TE001).
Figure 7: Box and Whisker Plot of phosphate concentrations (mg/L) of Welland River watershed
monitoring stations for 2008-2010 (n=24 for each station). The box length of the box-and-whisker plots
represents the inter-quartile range that contains the median value shown as a horizontal line. The
whiskers represent the minimum and maximum values.
Niagara River Remedial Action Plan
18The Welland River Eutrophication Study in the Niagara River Area of Concern
Table 4: Mean TP, mean phosphate and mean percent phosphate for Welland River watershed stations
(2008-2010)
Station Mean TP (mg/L) Mean Phosphate (mg/L) % Phosphate
WR00A 0.35 0.05 15
WR000 0.24 0.03 12
WR001 0.21 0.01 5
WR002 0.21 0.01 4
WR003 0.27 0.04 16
WR004 0.22 0.01 6
WR005 0.21 0.08 38
WR006 0.25 0.10 40
WR007 0.24 0.14 58
WR010 0.08 0.05 58
BF001 0.36 0.24 68
BU000 0.39 0.11 27
BU001 0.45 0.11 24
BV001 0.44 0.31 69
CO001 0.16 0.08 46
DR001 0.15 0.07 49
EL001 0.21 0.11 52
GR001 0.26 0.15 56
LY003 0.16 0.09 54
MI001 0.17 0.09 55
OS001 0.39 0.23 58
OS002 0.28 0.13 46
TE001 0.38 0.26 67
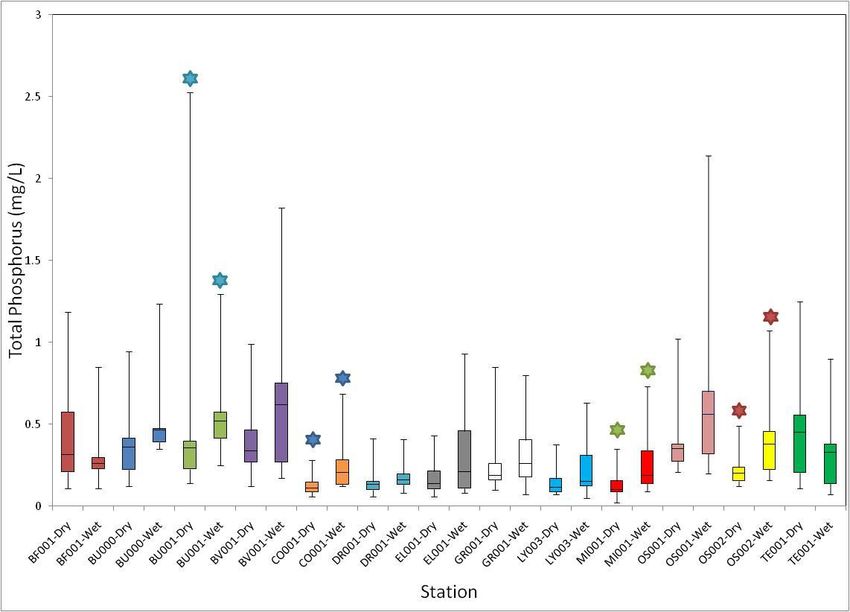
Based on field staff observations and precipitation data (Appendix F), water quality sampling
dates were identified as dry or wet weather events. Dry and wet-weather TP concentrations for
the Welland River and subwatershed tributaries are shown in Figures 8 and 9. Based on these
data, it was found only the mid-sections of the Welland River (WR005, WR006, and WR007)
and four subwatershed tributaries (BU001, CO001, MI001 and OS002) had significantly greater
TP concentrations (pThe Welland River Eutrophication Study in the Niagara River Area of Concern Figure 8: Box and Whisker Plot of Total Phosphorus (mg/L) of Welland River watershed monitoring stations for 2008-2010 accounting for dry vs. wet weather sampling events (n=16 for dry and n=8 for wet at each station). The box length of the box-and-whisker plots represents the inter-quartile range that contains the median value shown as a horizontal line. The whiskers represent the minimum and maximum values. Star symbols of the same colour denote significant differences (Mann Whitney U-Test, p
The Welland River Eutrophication Study in the Niagara River Area of Concern

Figure 9: Box and Whisker Plot of Total Phosphorus (mg/L) of Welland River subwatershed monitoring
stations for 2008-2010 accounting for dry vs. wet weather sampling events (n=16 for dry and n=8 for wet
at each station). The box length of the box-and-whisker plots represents the inter-quartile range that
contains the median value shown as a horizontal line. The whiskers represent the minimum and
maximum values. Star symbols of the same colour denote significant differences (Mann Whitney U-Test,
p
The Welland River Eutrophication Study in the Niagara River Area of Concern

In 2010, additional weekly sampling was initiated by MOE and NPCA staff in the three most
nutrient enriched tributaries (BV001, BF001 & OS001) to better characterize their TP and
phosphate concentrations in terms of potential seasonal differences. Weekly TP concentrations
are shown in Figure 10. Generally, like the less frequent monitoring conducted at the other
stations, TP concentrations were substantially greater than the PWQO (1994) for all three
watersheds. There was a summertime increase in TP at all three stations with Big Forks
(BF001) having the highest single concentration of 2.5 mg/L. Phosphate concentrations (Figure
10) in all three tributaries were highly variable with greater summertime concentrations
observed at stations BF001 and OS001.

Figure 10: Weekly Total Phosphorus (TP) Concentrations for Oswego (OS001), Beaver (BV001) and Big
Forks (BF001) Creek Stations from March to November 2010 (n=34 for each station). Red line represents
PWQO (1994) for total phosphorus.

Niagara River Remedial Action Plan
                                                                                                  22
The Welland River Eutrophication Study in the Niagara River Area of Concern
Figure 11: Weekly Phosphate Concentrations for Oswego (OS001), Beaver (BV001) and Big Forks
(BF001) Creek Stations from March to November 2010 (n=34 for each station).
2.2.2 Phosphorus Loads
TP loads were calculated for each tributary station using two methods. The first method was the
empirical flow measurements obtained at the time of sampling and the second method was
using modeled runoff estimates from the computer program Hydrologic Engineering Centre -
Hydrologic Modeling System (HEC-HMS). HEC-HMS is the U.S Army Corps of Engineers’
Hydrologic Engineering Center Hydrologic Modeling System and a standard modelling program
for water resource practitioners. HEC-HMS is a numerical simulation model designed to
simulate the precipitation-runoff process of a watershed. The HEC-HMS surface water models
were run in continuous mode at hourly intervals and calibrated to stream gauges where
available.
Niagara River Remedial Action Plan
23The Welland River Eutrophication Study in the Niagara River Area of Concern For the first method, median annual TP loads from the 2008-2010 were used to calculate a mean TP load for each tributary station. The mean annual TP load was then divided by the tributary catchment area to obtain a unit area load or export coefficient for each tributary in kg/ha/yr. The TP loads for 2008-2010 using this method are summarized in Appendix G. A similar exercise was repeated using second method but with modeled runoff estimates. The modeled data was prepared by the NPCA and AquaResource Inc. (2010) as part of the NPCA Source Protection Area Tier 1 Water Budget. For each NPCA tributary stations, modeled runoff values from NPCA and AquaResources (2010) and annual TP concentrations were used to calculate annual TP loads. The calculated export coefficients using empirical and modelled flow methods are summarized in Table 5 and ranked in Table 6. The TP export coefficients calculated using the empirical flows were found to differ considerably from those determined using the modeled flows, differing by two to three orders of magnitude at some stations (i.e. BF001). The high degree of variability observed in the export coefficients calculated using the empirical flows is likely attributed to the skewed nature of the flow data. The empirical flow data contains a combination of zero and extreme flows at most stations, and many stations have a very limited number of data points (n
The Welland River Eutrophication Study in the Niagara River Area of Concern

Table 6: Summary of ranked TP export coefficients (highest to lowest) calculated using two different
conditions (as described in Table 5)

                                                                         Empirical
                                Rank              Modeled Runoff            Flow
                                  1                  BV001                 DR001
                                  2                  TE001                 OS001
                                  3                  BF001                 TE001
                                  4                  OS001                 BV001
                                  5                  DR001                CO001
                                  6                  GR001                GR001
                                  7                  BU001                 BU001
                                  8                   LY003                BF001
                                  9                   MI001                MI001
                                 10                   EL001                EL001
                                 11                  CO001              N/A (LY003)

Phosphorus loads (kg/ha/yr) of the Welland River subwatersheds were compared to the loads of
Combined Sewer Overflows (CSOs) found in the City of Welland as well as the loads of other
Non-Area of Concern (AOC) watersheds such as Twenty Mile Creek (NPCA unpublished data)
and the Grand River (Cooke 2004). Generally three tiers (greater than non-AOCs, equal to non-
AOCs, less than non-AOCs) of phosphorus export coefficients for the Welland River
subwatersheds were apparent and these are summarized in Figure 12. As shown in Figure 12,
Big Forks Creek (BF001), Beaver Creek (BV001), and Tee Creek (TE001) subwatersheds had
substantially greater phosphorus loads than the non-AOC watershed. Phosphorus loadings in
Buckhorn Creek (BU001), Drapers Creek (DR001), Grassy Brook (GR001) and Oswego Creek
(OS001) subwatersheds were approximately equal to non-AOC watersheds. The Welland River
also receives a significant load of phosphorus from CSOs in urban areas of the City of Welland.
Coyle Creek (CO001), Elsie Creek (EL001), Lyons Creek (LY003) and Mill Creek (MI001) had
phosphorus loads less than non-AOCs (Figure 12). These data suggest that although all
Welland River subwatersheds contribute a significant phosphorus load, there is a subgroup of
subwatersheds that can be identified as the greatest phosphorus contributors in terms of their
watershed size and these warrant special priority.

Niagara River Remedial Action Plan
                                                                                                       25
The Welland River Eutrophication Study in the Niagara River Area of Concern
Figure 12: Total Phosphorus Loads (kg/ha/yr) for Welland River subwatersheds, City of Welland CSOs,
Non-Niagara River AOC stations Twenty Mile Creek and Grand River (Fairchilds Creek, Boston Creek
and McKenzie Creek) using actual water quality data (2003-2010) and modelled runoff.
2.2.3 Nitrogen
Nitrogen is one of the most abundant elements. About 80 % of the air we breathe is nitrogen. It
is found in the cells of all living things and is a major component of proteins. The importance of
nitrogen in the aquatic environment varies according to the relative amounts of the forms of
nitrogen present such as ammonia, ammonium, nitrite, nitrate, or organic nitrogen. Nitrate is the
most common form of nitrogen that occurs in surface water. In aerobic or oxygen-rich water,
bacteria convert ammonium and nitrite to nitrate through a process known as nitrification. In
anaerobic or oxygen-depleted water, these forms of nitrogen are converted to molecular
nitrogen through denitrification, and this gas is released to the atmosphere. At elevated
concentrations, nitrate, nitrite and un-ionized ammonia can be toxic to aquatic organisms and
can contribute to excessive plant and algae growth in surface water. Anthropogenic sources of
nitrogen include sewage discharges, animal waste, fertilizers and pesticides. This section will
report on monthly nitrate-nitrogen, un-ionized ammonia (based on total ammonia) and total
Niagara River Remedial Action Plan
26You can also read