Title: Time variability and heterogeneity in the coma of 67P/Churyumov-Gerasimenko
←
→
Page content transcription
If your browser does not render page correctly, please read the page content below
Submitted Manuscript: Confidential

     Title: Time variability and heterogeneity in the coma of 67P/Churyumov-
                                   Gerasimenko
 Authors: M. Hässig1,2*, K. Altwegg1,3, H. Balsiger1, A. Bar-Nun4, J.J. Berthelier5, A. Bieler1,6,
 P. Bochsler1, C. Briois7, U. Calmonte1, M. Combi6, J. De Keyser8,9, P. Eberhardt1†, B. Fiethe10,
S. A. Fuselier2, M. Galand11, S. Gasc1, T. I. Gombosi6, K. C. Hansen6, A. Jäckel1, H. U. Keller12,
 E. Kopp1, A. Korth13, E. Kührt14, L. Le Roy3, U. Mall13, B. Marty15, O. Mousis16, E. Neefs17, T.
 Owen18, H. Rème19,20, M. Rubin1, T. Sémon1, C. Tornow14, C.-Y. Tzou1, J. H. Waite2, P. Wurz1

Affiliations:
1
    Physikalisches Institut, University of Bern, Sidlerstr. 5, CH-3012 Bern, Switzerland.
2
    Southwest Research Institute, 6220 Culebra Rd., San Antonio, TX 78238, USA.
3
 Center for Space and Habitability (CSH), University of Bern, Sidlerstr. 5, CH-3012 Bern,
Switzerland.
4
    Department of Geosciences, Tel-Aviv University, Ramat-Aviv, Tel-Aviv, Israel.
5
    LATMOS/IPSL-CNRS-UPMC-UVSQ, 4 Avenue de Neptune F-94100 SAINT-MAUR, France
6
 Department of Atmospheric, Oceanic and Space Sciences, University of Michigan, 2455
Hayward Street, Ann Arbor, MI 48109, USA.
7
 Laboratoire de Physique et Chimie de l'Environnement et de l'Espace (LPC2E), UMR 7328
CNRS – Université d'Orléans, France.
8
    Belgian Institute for Space Aeronomy, BIRA-IASB, Ringlaan 3, B-1180 Brussels, Belgium.
9
    Center for Plasma Astrophysics, K.U. Leuven, Celestijnenlaan 200D, 3001 Heverlee, Belgium.
10
  Institute of Computer and Network Engineering (IDA), TU Braunschweig, Hans-Sommer-
Straße 66, D-38106 Braunschweig, Germany.
11
 Department of Physics, Imperial College London, Prince Consort Road, London SW7 2AZ,
United Kingdom.
12
 Institute for Geophysics and Extraterrestrial Physics, TU Braunschweig, 38106 Braunschweig,
Germany.
13
 Max-Planck-Institut für Sonnensystemforschung, Justus-von-Liebig-Weg 3, 37077 Göttingen,
Germany.
14
 German Aerospace Center, Institute of Planetary Research, Asteroids and Comets,
Rutherfordstraße 2, 12489 Berlin, Germany.
15
  Centre de Recherches Pétrographiques et Géochimiques, 15 rue Notre Dame des Pauvres, BP
20, 54501 Vandoeuvre lès Nancy, France.
16
  Aix Marseille Université, CNRS, LAM (Laboratoire d'Astrophysique de Marseille) UMR
7326, 13388, Marseille, France.
17
     Engineering Division, BIRA-IASB, Ringlaan 3, B-1180 Brussels, Belgium.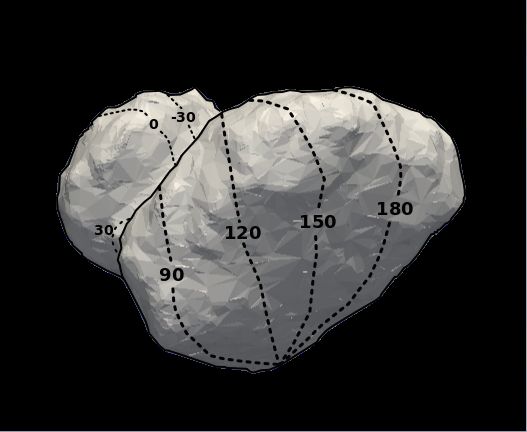
18
     Institute for Astronomy, University of Hawaii, Honolulu, HI 96822, USA.
19
     Université de Toulouse; UPS-OMP; IRAP, Toulouse, France.
20
     CNRS; IRAP; 9 avenue du colonel Roche, BP 44346, F-31028 Toulouse cedex 4, France.
*
    Correspondence to: E-Mail: myrtha.haessig@swri.org
†
    deceased
Abstract: Comets contain the best-preserved material from the beginning of our planetary
system. Their nuclei and comae composition reveal clues about physical and chemical conditions
during the early Solar system when comets formed. ROSINA (Rosetta Orbiter Spectrometer for
Ion and Neutral Analysis) onboard the Rosetta spacecraft has measured the coma composition of
comet 67P/Churyumov-Gerasimenko with well sampled time resolution per rotation.
Measurements were made over many comet rotation periods and a wide range of latitudes. These
measurements show large fluctuations in composition in a heterogeneous coma that has diurnal
and possibly seasonal variations in the major outgassing species: H2O, CO, and CO2. These
results indicate a complex coma-nucleus relationship where seasonal variations may be driven by
temperature differences just below the comet surface.
One Sentence Summary: ROSINA/DFMS shows that 67P/Churyumov-Gerasimenko has a
highly heterogeneous coma with large diurnal and possibly seasonal variations.

Main Text: Initially, comets were classified depending on the location where they formed in the
protoplanetary disc (1, 2). This classification assumed a similar composition of the nucleus
within a given formation region. No cometary nucleus composition has been sampled in situ.
Rather, it is implicitly assumed that measurements of the outgassing of comets reveal the
composition of the volatile components of the nucleus. However, compositional homogeneity of
at least one comet was confirmed by studying outgassing from the fragments of the broken up
comet Schwassmann-Wachmann 3 (3). Detailed observations of other cometary comae indicated
that there is evidence of heterogeneity. Missions to comet Halley detected release of volatiles in
multiple jet-like features that were dominantly seen on the sunlit side of the nucleus (4, 5). The
Deep Impact mission detected asymmetries in composition in the coma of Tempel 1 (6). In
particular, these remote sensing observations at Tempel 1 indicated an absence of correlation
between H2O and CO2 in the coma.

Detailed, close up cometary images have also showed visible differences between different areas
of cometary nuclei. These images suggested that heterogeneity in the coma of a comet may be
related to heterogeneity of the nucleus. Observations by EPOXI at Hartley 2 in 2010 near
perihelion indicated that the nucleus is complex, with two different sized lobes separated by a
middle waist region that is smoother and lighter in color (7). Outgassing from sunlit surfaces of
the nucleus revealed that the waist and one of the lobes were very active. A CO2 source was
detected at the small lobe of the comet, while the waist was more active in H2O and had a
significantly lower CO2 content. Based on these coma observations, it has been tentatively
suggested that the heterogeneity in the comet’s nucleus was primordial (7). Seasonal effects
could not be ruled out because the observations also showed a complex rotational state for the
comet (7). The smaller of the two lobes may have been illuminated differently because of this
complex rotation (7). In support of the findings at Hartley 2, there are indications of a
heterogeneous nucleus for comet Tuttle and a heterogeneous coma (7, 8).
The Stardust mission to comet P81/Wild 2, on the other hand, showed a large mixing of materials on the scale of grains and therefore a homogenized mix of the refractory material in the comet (9). The results at Hartley 2 and at P81/Wild 2 raise the larger question of whether heterogeneity in the coma is a common feature in comets and whether this reveals an underlying heterogeneity in the composition of the nucleus, which would point to general transport of cometesimals in the early Solar System. In August, the European Space Agency’s mission Rosetta arrived at its target comet 67P/Churyumov-Gerasimenko (67P) after a ten-year journey (10). Rosetta provides an excellent opportunity for long-term study during the comet’s sunward approach to perihelion. The observations presented here are from a two-month period beginning near the initial encounter at about 3.5 AU from the Sun. Like Hartley 2, the nucleus of 67P appears complex in shape. 67P consists of two lobes of different sizes, connected by a neck region. The lobes are much larger, more rugged, and darker than the neck region and the overall shape has been compared to a rubber duck (11). The structural similarities of 67P and Hartley 2 suggest the possibility of another heterogeneous comet and, by virtue of the extended observations at 67P, a chance to determine whether heterogeneity in the coma and nucleus are related. Here we show compositional variations in H2O, CO, and CO2 at comet 67P observed with ROSINA/DFMS (Rosetta Orbiter Spectrometer for Ion and Neutral Analysis / Double Focusing Mass Spectrometer) (12). ROSINA/DFMS is a mass spectrometer that measures the in situ neutral and plasma coma composition at the position of the spacecraft [see Supplementary material]. During Rosetta’s approach to 67P, ROSINA/DFMS measured the neutral coma composition with a time resolution (>10 measurements per rotation) much finer than the rotation period of the comet of ~12.4 hours (13). In August, the spacecraft scanned the comet at northern summer hemisphere (positive latitudes) from about 10º up to almost 90º (Coordinates: Cheops System (14)). In September, the spacecraft made a similar scan at southern winter hemisphere (negative latitudes) down to about -50º. Two data sets are shown in Fig. 1 and 2 to illustrate the diurnal and latitudinal variations and heterogeneity of the cometary coma. During this approach and latitude scan, the H2O, CO, and CO2 signals from the comet increased by more than an order of magnitude, roughly in agreement with a 1/R2 dependence on the coma density, where R is the distance from comet center. Overall, the H2O signal is the strongest; however, there are clearly periods when the CO or CO2 signals rival that of H2O. Superposed on this general increase in signal are large, diurnal variations for all three neutral species. For H2O, these variations are periodic, initially with half the rotation rate of the comet (~6.2 hours) and then, after August 6, at the rotation rate (~12.4 hours). This change in periodicity in the signal is interpreted as a latitudinal effect of the sampling position. Peaks occur at ±90º longitude. For the most part, the CO signal follows the H2O signal, but the variations are smaller. CO2 shows a different periodicity. Initially, a CO2 peak is observed in association with an H2O peak and a second CO2 peak occurs approximately 3 hours later. After August 6, a single CO2 peak is observed; however, this peak is not exactly coincident with the H2O peak. The two CO2 peaks merge, resulting in a shoulder on the main peak and a slight shift of the main CO2 peak relative to that of H2O (~45 min or one measurement point). Statistical uncertainties
( particles) in the signal detected by ROSINA/DFMS are smaller than dots in Figures 1-3 and
contributions to the signal due to spacecraft outgassing (15) are subtracted.
The diurnal variations at half the rotation rate of the comet that are seen in August are also
observed at southern latitudes in the September timeframe (Fig. 2). The H2O peaks in Fig. 3 are
nearly equal and there is a deep minimum between the two peaks. As in the first dataset, CO
follows H2O. However, there is much less variation in CO than in H2O, resulting in times when
the CO signal is greater than that for H2O. The best example of the differences between H2O and
CO2 are seen just after September 18 (Figs. 2 and 3). The nearly equal H2O peaks and the deep
minimum in the H2O signal are evident as is the clear offset between the second CO2 and H2O
peaks.
We have combined the signal and the spacecraft perspective over the September 18 to 19, 2014
window to illustrate which side of the comet is in view when the peaks occur (Fig. 3). The peaks
in H2O signal are observed when the neck of the comet is in view of the spacecraft. The deep
minimum in H2O signal is observed when the spacecraft views the southern hemisphere of the
larger of the two lobes. This large lobe blocks a direct view of the neck of the comet. The
separate, second CO2 enhancement is observed when the spacecraft views the underside of the
body of the larger of the two lobes of the comet. The CO signal in the second rotation of the
comet follows the CO2 profile, and CO and CO2 have very similar intensities.

We see from this data (Figs. 1-3) that the coma composition of 67P is highly heterogeneous.
H2O, CO, and CO2 variations are strongly tied to the rotation period of the comet and to the
observing latitude. At large negative latitudes, the H2O signal varies by at least two orders of
magnitude (Fig. 3). Also, the H2O minima are not as deep when the spacecraft is at mid and high
positive latitudes because there is a view of the neck region over the edge of the larger lobe (see
Fig. 1 and the observations on Sept 15 in Fig. 2).
The separate CO2 peak also occurs when the spacecraft views the bottom of the larger of the two
lobes of the comet (see Fig. 3 at 5 hours). CO follows H2O at positive latitudes and follows both
H2O and CO2 at negative latitudes.
The separate CO2 peak, the large variations in the H2O signal, and the weaker variations in CO
result in large changes in the relative concentration of H2O, CO, and CO2 in the heterogeneous
coma of 67P [see Supplementary Material]. For example, the CO/H2O number density ratio is
0.13±0.07 and the CO2/H2O ratio is 0.08±0.05 in the last H2O peak on August 7 at 18 hours in
Fig. 1 (measured high in the northern summer hemisphere). However, The CO/H2O ratio
changes from 0.56±0.15 to 4±1 and back to 0.38±0.15 within the second cometary rotation Fig.
3, between 12 and 24 h on September 18, measured low in the southern winter hemisphere.
Similarly, the CO2/H2O ratio changes from 0.67±0.15 to 8±2 and back to 0.39±0.15 over the
same rotation. These are large changes within a short amount of time, which indicate a strongly
heterogeneous and time variable coma.
The similarities in the structure of the nuclei and the heterogeneous comae of 67P and Hartley 2
are striking. The behavior in terms of the H2O dominant outgassing at the neck versus CO2
outgassing at one of the lobes described here was also found for Hartley 2 (7).
The compositional differences in the Hartley 2 coma were interpreted as evidence for a
heterogeneous cometary nucleus (7). However, seasonal effects could not be ruled out. With
observations over a wide range of latitudes at 67P, we can distinguish between compositional
differences and seasonal effects; to do so, we have mapped the CO2/H2O density ratio from
August 17 through September 22 onto the shape model (Fig. 4).
Although a direct mapping of the signal observed in the coma onto the comet surface is
oversimplified, a generalized interpretation reveals features of the outgassing of the comet.
Seasonal effects on the CO2/H2O ratio are clearly evident (Fig. 4). On the upper half of the
comet, the CO2/H2O ratio is less than 1, indicating a higher sublimation of H2O from positive
latitude regions that receive more illumination during northern hemisphere summer on the
comet. A broad region of high CO2/H2O ratio occurs at negative latitudes in the winter
hemisphere, likely the result of deep minima in the H2O signal (such as the one shown in Fig. 3
on September 18 at 4 hours). This winter hemisphere of the comet is poorly illuminated by the
Sun. With limited illumination, this region of the comet nucleus may be significantly colder than
other regions, including the neck and smaller lobe. The temperature at and below the surface of
the nucleus may be sufficient to sublimate CO and CO2, but not sufficient to sublimate water.
The weak, periodic illumination of this region may be sufficient to drive CO and CO2
sublimation, producing the separate CO and CO2 peak (Fig. 3 at 18 hours). However, the
compositional asymmetry in the two H2O peaks can’t be explained in a similar way and might be
the strongest indication for heterogeneity in the comet nucleus. The strong heterogeneity in the
coma of comet 67P is likely driven by seasonal effects on the comet nucleus. However, the
smaller variation of CO and CO2 compared to H2O might indicate that CO and CO2 ices
sublimate from a greater depth, while H2O ice sublimates closer to the surface and experiences
more direct temperature differences due to sunlight. Furthermore, that lack of overall correlation
between H2O, CO and CO2 implies that the outgassing from the nucleus is not correlated, or that
CO and CO2 are not strictly embedded in H2O. For Temple 1, material was found in layers and
supports the above idea (16).
In summary, the coma composition has been measured over many rotational periods of the comet
and a wide range of latitudes with high time resolution and compositional detail. Concentrations
of the three molecules change over the rotational period of the comet and indicate a strongly
heterogeneous coma. For the most part, H2O dominates, but CO and CO2 can at times dominate
in the coma. These observations also indicate that there are substantial diurnal and latitudinal
variations in the coma. Peaks in the H2O signal are observed, along with deep minima at high
negative latitudes when the neck region of the nucleus is blocked from view of the spacecraft. A
separate peak in CO2 signal occurs when the winter hemisphere of the larger lobe of the comet
faces the spacecraft. The diurnal and latitudinal variations suggest that compositional
differences in the coma may be a seasonal and may indicate different sub-surface temperatures in
the nucleus.
Further observations may distinguish seasonal effect from nucleus heterogeneity. As the comet
approaches the Sun, the overall temperature of the nucleus will increase, and as the seasons
change, there may be significant changes in the H2O, CO, and CO2 outgassing, with the current
high CO2/H2O ratio region shown in Fig. 4. In addition, differences in the sublimation of species
similar in sublimation temperatures could demonstrate the extend of heterogeneity in the nucleus
independent of seasonal changes.
References and Notes:
1. M. F. A'Hearn, R. C. Millis, D. O. Schleicher, D. J. Osip, R. V. Birch, The Ensemble
   Properties of Comets- Results from Narrowband Photometry of 85 Comets, 1976-1992,
   Icarus 118, 223-270 (1995).
2. M. J. Mumma and S. B. Starnely, The Chemical Composition of Comets - Emerging
   Taxonomies and Natal Heritage, Annu Rev. Astron. Astrophys 49, 471-524 (2011).
3. N. Dello Russo et al., Compositional homogeneity in the fragmented comet 73P-
Schwassmann–Wachmann 3, Nature 448, 172-175 (2007).
4. H. U. Keller et al., First Halley Multicolour Camera imaging results from Giotto., Nature
    321, 320–326 (1986).
5. H. A. Weaver, M. J. Mumma, H. P. Larson, D. S. Davis, Postperihelion observations of
    water in comet Halley., Nature 324, 441-444 (1986).
6. L. M. Feaga, M. F. A'Hearn, J. M. Sunshine, O. Groussin, T. L. Farnham, Asymmetreis in
    the distribution of H2O cann CO2 in the inner coma of Comet Tempel 1 as observed by Deep
    Impact, Icarus 190, 345-356 (2007).
7. M. F. A'Hearn et al., EPOXI at Hartley 2, Science 332, 1396-1400 (2011).
8. B. P. Bonev et al., The peculiar volatile composition of comet 8P/Tuttle: a contact binary of
    chemically distinct cometesimals?, The Astrophysical Journal 680, 61-64 (2008).
9. M. F. A'Hearn, Whence Comets?, Science 314, 1708-1709 (2006).
10. K.-H. Glassmeier et al., The Rosetta Mission: Flying Towards the Origin of the Solar
    System, Space Science Reviews 128, 745-801 (2007).
11. N. Thomas et al., Science, submitted (2014).
12. H. Balsiger et al., ROSINA-ROSETTA-orbiter-spectrometer-for-ion-and-neutral-analysis,
    Space Science Reviews 128, 745-801 (2007).!
13. S. Mottola et al., The rotation state of 67P/Churyumov-Gerasimenko from approach
    observations with the OSIRIS cameras on Rosetta, Astron. Astrophys 569, L2 (2014).
14. L. Jorda et al., Shape models of 67P/Churyumov-Gerasimenko. RO-C-OSINAC/OSIWAC-
    5-67P-SHAPE-V1.0, NASA Planetary Data System and ESA Planetary Science Archive. In
    preparation (2015)
15. B. Schläppi et al., Influence of spacecraft outgassing on the exploration of tenuous
    atmospheres with in situ mass spectrometry, Journal of Geophysical Research (Space
    Physics) 115, 12313 (2010).
16. M. F. A'Hearn et al., Deep Impact Excavating Comet Tempel 1, Science 310, 258-264
    (2005). !
Acknowledgments: The authors would like to thank the following institutions and agencies,
     which supported this work: Work at UoB was funded by the State of Bern, the Swiss
     National Science Foundation and by the European Space Agency PRODEX Program.
     Work at MPS was funded by the Max-Planck Society and BMWI under contract
     50QP1302. Work at Southwest Research institute was supported by subcontract
     #1496541 from the Jet Propulsion Laboratory and under NASA prime contract
     NNX148F71G. Work at BIRA-IASB was supported by the Belgian Science Policy Office
     via PRODEX/ROSINA PEA 90020. Work at Imperial College London has been partially
     funded by the Science and Technology Facilities Council (STFC). This work has been
     carried out thanks to the support of the A*MIDEX project (n° ANR-11-IDEX-0001-02)
     funded by the « Investissements d’Avenir » French Government program, managed by
     the French National Research Agency (ANR). This work was supported by CNES grants
     at IRAP, LATMOS, LPC2E, UTINAM, CRPG, and by the European Research Council
     (grant no. 267255). A. Bar-Nun thanks the Ministry of Science and the Israel Space
     agency. Work at the University of Michigan was funded by NASA under contract JPL-
     1266313. Work by JHW at SwRI was supported by NASA JPL subcontract
     NAS703001TONMO710889. ROSINA would not give such outstanding results without
     the work of the many engineers, technicians, and scientists involved in the mission, in the
     Rosetta spacecraft and in the ROSINA instrument over the last 20 years whose
contributions are gratefully acknowledged. Rosetta is an ESA mission with contributions from its member states and NASA. We would like to thank the OSIRIS team for giving permission to use the shape model. We acknowledge herewith the work of the ESA Rosetta team. All ROSINA data is available on request until it is released to the PSA archive of ESA and to the PDS archive of NASA.
M18 LR ions/sample - bkgd
                                                                        M28 LR ions/sample - bkgd
                                                                        M44 LR ions/sample - bkgd

                                                                              M18 28 44 LR 1-31 Aug 2014
            LR ions/sample(particles/20s)
                                                               250 km                  180 km                   120 km   90 km         80 km

                                                              10106
                                                                  6
                           - bkgd

                                                                                                         H 2O                    CO
        M18 signal

                                                              10105
                                                                  5
 detector

                                                                                                                                 CO2

                                                              104
                                            Longitude (deg)

                                                                10
                                                               180
                                                                  4
                                                                                                                                           60

                                                                                                                                                Latitude (deg)
                                                                   72                         96                  120

                                                                                                                                           40
                                                                  0                   M18 LR hrs since 1 Aug
                                                                                                                                           20
                                                              -180                                                                         0
                                                              4 Aug 2014                   5 Aug                 6 Aug   7 Aug         8 Aug

Fig. 1. H2O, CO, and CO2 measurements for August 4 to 8, 2014. The upper panel shows the
signal on the DFMS detector for H2O, CO, and CO2 and the lower panel shows the latitude and
longitude of the nadir view of the spacecraft. At the top is the distance from the spacecraft to the
comet. The signal increases with decreasing distance to the comet, while diurnal variations are
also visible. CO2 has a different periodicity than H2O as seen around August 4 to 6.
H 2O
106
detector signal (particles/20s)
CO
105
CO2
104
103 0
Longitude (deg)
180
Latitude (deg)
-20
0
-40
-180 -60
15 Sept 2014 16 Sept 17 Sept 18 Sept 19 Sept
Fig. 2. H2O, CO, and CO2 measurements for September 15 to 19, 2014. Over this 4-day period,
the spacecraft remained at a nearly fixed distance from the comet and executed a southern
latitude scan from about 0º to -45º latitude. H2O and CO2 have different periodicities and there
are deep minima in the H2O signal. CO follows the CO2 profile with less variation.18 Sept 6h 12 h 18 h 19 Sept
106
detector signal (particles/20s)
H 2O
105
CO2 CO
104
103
00:53 h (0) 03:58 h (1/4) 05:13 h (1/3) 07:43 h (1/2) 16:33 h (5/4)
Fig. 3. H2O, CO, CO2 profiles for September 18, 2014. The Sun is shining on the comet from the
top middle of the pictures. The snap shots of the spacecraft view of the comet show that H2O
peaks are observed when the neck region is in view. The separate CO2 peak and the deep
minimum in H2O occur when the spacecraft views the larger of the two lobes and the neck
region is blocked. (Shape model credit: ESA/Rosetta/MPS for OSIRIS Team
MPS/UPD/LAM/IAA/SSO/INTA/UPM/DASP/IDA, OSINAC/OSIWAC SHAP1 (14)).Longitudes
Latitudes
30˚
0˚
- 30˚
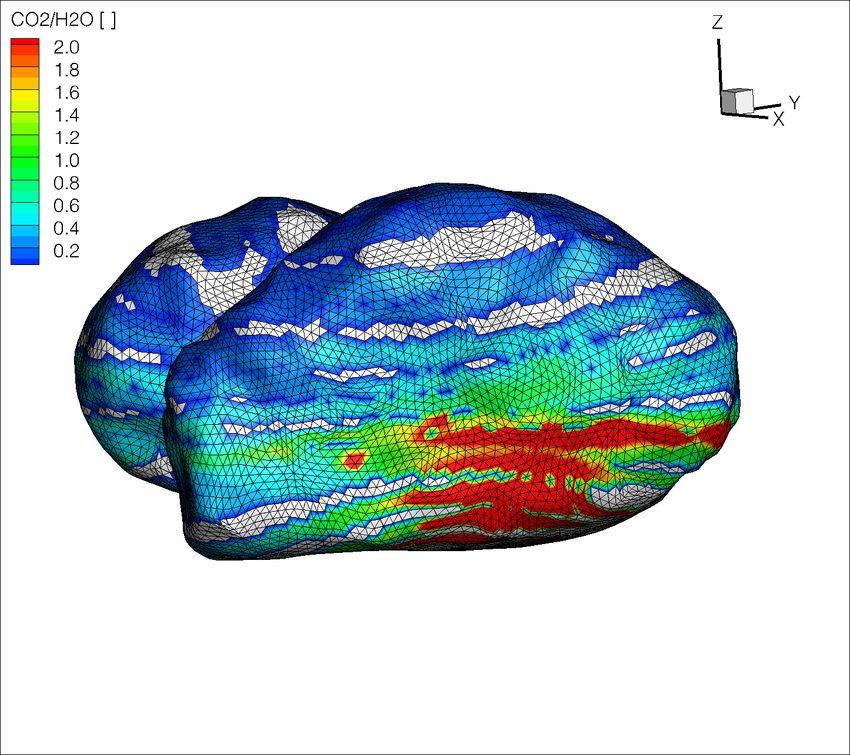
Fig. 4. The nadir point for each pair of CO2/H2O measurements over the time period from
August 17 through September 22 was mapped to the model surface. The mapping is shown for
the bottom side of the larger of the two lobes of the comet and cometary latitudes run
approximately vertically in this. The layering is due to spacecraft rastering above the comet
nucleus. A high ratio is measured for the lower part that is poorly sunlit in northern hemisphere
summer. (Shape model credit: ESA/Rosetta/MPS for OSIRIS Team
MPS/UPD/LAM/IAA/SSO/INTA/UPM/DASP/IDA, OSINAC/OSIWAC SHAP1 (14)).Supplementary Materials for
Time variability and heterogeneity in the coma of 67P/Churyumov-
Gerasimenko
M. Hässig, K. Altwegg, H. Balsiger, A. Bar-Nun, J.J. Berthelier, A. Bieler, P. Bochsler,
C. Briois, U. Calmonte, M. Combi, J. De Keyser, P. Eberhardt†, B. Fiethe, S. A. Fuselier,
M. Galand, S. Gasc, T. I. Gombosi, K. C. Hansen, A. Jäckel, H. U. Keller, E. Kopp, A.
Korth, E. Kührt, L. Le Roy, U. Mall, B. Marty, O. Mousis, E. Neefs, T. Owen, H. Rème,
M. Rubin, T. Sémon, C. Tornow, C.-Y. Tzou, J. H. Waite, P. Wurz
correspondence to: myrtha.haessig@swri.org
This PDF file includes:
Materials and Methods
Supplementary Text
1Materials and Methods
Instrumentation and Data Analysis
The Rosetta orbiter caries an instrument package, ROSINA (12) designed for in situ
measurements of the cometary coma composition. In the instrument package is a high
resolution, high sensitivity mass spectrometer, the Double Focusing Mass Spectrometer
(DFMS). ROSINA/DFMS measures the neutral and plasma coma composition.
ROSINA/DFMS steps through a mass spectrum m/z 13-100 in ~ 45 min, the integration
time per mass is 20 s, and ROSINA/DFMS can detect neutral particle densities down to 1
cm-3. However, the spacecraft background (15) is around 106 cm-3 depending on mass. In
this paper, we focus exclusively on the measurement of neutral molecules. The radial
outflow of molecules from the cometary nucleus enters the instruments field of view of
20˚ x 20˚, when pointing generally in the direction of the comet. A neutral entering the
instrument is ionized by electron impact and then analyzed by a combination of and
electro static analyzer focusing in energy and angle. The electrostatic analyzer is
followed by a magnet resulting in a mass per charge separation and finally detected. This
mass spectrometer is operated in a variety of modes covering a wide range of masses, but
typically measures the major neutral species including H2O, CO, and CO2. ROSINA
detected and characterized a gaseous background due to spacecraft outgassing from the
Rosetta spacecraft (15), which is present even after ten years of cruise in space including
nearly two years in hibernation. For the following measurements described in this paper,
this background was determined from a time period when the spacecraft was far (>800
km) from the comet and subtracted from the total signal.
Derivation of relative concentrations
The number densities for these three species considered are related to the signals in
Figure 1 after different sensitivities for the different molecules are taken into account.
The sensitivities for H2O and CO are nearly the same, but the sensitivity for CO2 is 30%
lower. These sensitivities were determined through calibration of the instrument and the
nearly identical flight spare in the laboratory. Uncertainties are due to statistical
uncertainties in the detection, calibration uncertainties for relative sensitivities (~17%),
and calibration uncertainties (~10%) such as the detector gain. The instrument specific
signal contribution of CO2 due to fragmentation in the ion source for CO was taken into
account. The contributions of the spacecraft background for those three species due to
spacecraft outgassing were derived earlier in the mission, when no cometary signal was
detected and subtracted from the total signal. The relative concentrations of CO, and CO2
to H2O that are derived from these data are discussed in the main text.
Supplementary Text
Additional description of Figure 1
The instrument is bore sighted with the nadir direction. The latitude and longitude
of the sub-spacecraft point on the comet are derived from the OSIRIS shape model. Over
the 4-day period in Figure 1, the spacecraft approached the comet as the comet rotated
beneath it (as seen by the longitude changes). During the last 2 days, the latitude of the
nadir point increased from about 20º to 60º. Low mass resolution data are used here
because they provide the highest instrument sensitivity and show the best evidence of the
2comet at these relatively far distances. Nearly continuous measurements of all three
molecules were made over this 4-day period with data gaps mainly due to times when the
instrument was off because of spacecraft reaction-wheel offloading.
Additional description of Figure 2
During this period, the instrument was almost exclusively in high mass resolution
mode with a factor of approximately 10 reduction in sensitivity when compared to low
resolution mode. After 18 September, the instrument was operated in a special water
species and CO2 mode for about 12 hours. Although there are no CO measurements at
that time, there are many more measurements of H2O and CO2, and the two species have
nearly the same overall signal.
Additional description of Figure 3
The upper part shows the counts on the DFMS detector for H2O and CO2 for a
timespan of two rotations of the comet. CO is only measured during the second rotation.
The lower part of Figure 3 shows spacecraft views of the comet (using the OSIRIS shape
model) for different times within the first rotational period. Because the neck of the
comet is also in view, the H2O signal is higher than its minimum when the neck region is
completely blocked. Although there are no CO measurements in this first comet rotation,
the CO signal in the second rotation of the comet follows the CO2 profile and, in this case
the CO and CO2 have very similar intensities. This effect seen at Hartley 2 with a high
outgassing of H2O at the waist and CO2 at one of the lobes was interpreted as an
evolutionary effect associated with re-deposition and sublimation of ice in the waist
region (7). ‘Chunks’ of nearly pure water ice are drag out by super volatiles (mainly CO2)
from the lobe; fall in onto the waist, where it resublimes driven by heat absorption of the
dark nucleus surface (7). However, the overall CO2 activity that drives this mechanism
for Hartley 2 is much higher than the water/ice driver at the current position of 67P. The
observations at Hartley 2 were conducted when the comet was one week past perihelion
at 1.06 AU, hence at the comet’s most active time. In contrast, 67P is currently at 3.5 AU,
far away from the Sun. The CO2 activity is much lower at this distance from the Sun and
there must be far fewer ice chunks that are dragged out by the CO2 gas.
3You can also read