Towards Autonomous Process Control-Digital Twin for CHO Cell-Based Antibody Manufacturing Using a Dynamic Metabolic Model
←
→
Page content transcription
If your browser does not render page correctly, please read the page content below

processes
Article
Towards Autonomous Process Control—Digital Twin for CHO
Cell-Based Antibody Manufacturing Using a Dynamic
Metabolic Model
Heribert Helgers, Axel Schmidt                   and Jochen Strube *

                                          Institute for Separation and Process Technology, Clausthal University of Technology, Leibnizstr. 15,
                                          38678 Clausthal-Zellerfeld, Germany; helgers@itv.tu-clausthal.de (H.H.); schmidt@itv.tu-clausthal.de (A.S.)
                                          * Correspondence: strube@itv.tu-clausthal.de

                                          Abstract: The development of new biologics is becoming more challenging due to global competition
                                          and increased requirements for process understanding and assured quality in regulatory approval.
                                          As a result, there is a need for predictive, mechanistic process models. These reduce the resources and
                                          time required in process development, generating understanding, expanding the possible operating
                                          space, and providing the basis for a digital twin for automated process control. Monoclonal antibodies
                                          are an important representative of industrially produced biologics that can be used for a wide range of
                                          applications. In this work, the validation of a mechanistic process model with respect to sensitivity, as
                                          well as accuracy and precision, is presented. For the investigated process conditions, the concentration
                                          of glycine, phenylalanine, tyrosine, and glutamine have been identified as significant influencing
                                          factors for product formation via statistical evaluation. Cell growth is, under the investigated process
                                          conditions, significantly dependent on the concentration of glucose within the investigated design
                                          space. Other significant amino acids were identified. A Monte Carlo simulation was used to simulate

                                   the cultivation run with an optimized medium resulting from the sensitivity analysis. The precision
Citation: Helgers, H.; Schmidt, A.;       of the model was shown to have a 95% confidence interval. The model shown here includes the
Strube, J. Towards Autonomous             implementation of cell death in addition to models described in the literature.
Process Control—Digital Twin for
CHO Cell-Based Antibody                   Keywords: dynamic metabolic model; digital twin; advanced process control; CHO; monoclonal
Manufacturing Using a Dynamic             antibody; validation
Metabolic Model. Processes 2022, 10,
316. https://doi.org/10.3390/
pr10020316

Academic Editor: Florian M. Wurm          1. Introduction

Received: 20 January 2022
                                               In biopharmaceutical production, the time-to-market for new, innovative products is
Accepted: 4 February 2022
                                          growing shorter and shorter [1,2]. In this context, process development in the upstream,
Published: 7 February 2022
                                          which typically involves optimization of the medium, feeding strategy, and various process
                                          parameters such as pH, power input, etc., is very costly, as a large number of lengthy culti-
Publisher’s Note: MDPI stays neutral
                                          vation experiments, often based on statistical experimental design, have to be performed [3].
with regard to jurisdictional claims in
                                          Although the application of statistical experimental designs reduces the necessary number
published maps and institutional affil-
                                          of experiments, in contrast to classical one-factor-at-a-time experiments, it is still very
iations.
                                          resource and time intensive due to the high number of process parameters and possible
                                          media compositions [4,5]. In addition to high-throughput screening using miniaturized
                                          and parallelized cultivation [6–8], a mechanistic, predictive process model is available
Copyright: © 2022 by the authors.
                                          as an alternative process optimization method [9–11]. Compared with the experimental
Licensee MDPI, Basel, Switzerland.        approach, this offers the advantage that many parameter combinations can be screened
This article is an open access article    within a short time [12,13]. For later automation, the process model also serves as the
distributed under the terms and           basis of the digital twin [14]. In the course of validating the process model, mechanistic
conditions of the Creative Commons        understanding of the process can also be generated, which reduces hurdles in approval and
Attribution (CC BY) license (https://     expands the possible operating range [15]. A typical example of biopharmaceuticals for
creativecommons.org/licenses/by/          the regulated market is monoclonal antibodies (mAb). These are usually produced using
4.0/).

Processes 2022, 10, 316. https://doi.org/10.3390/pr10020316                                                  https://www.mdpi.com/journal/processes
Processes 2022, 10, 316                                                                                              2 of 16

                          animal cells, mostly Chinese hamster ovary (CHO) cells [16,17]. This system is thus very
                          suitable for the development and validation of a process model.
                                Simple Monod models with static yield coefficients are often used [10,18]. Although
                          these are easy to determine from an already performed cultivation, there is no causality
                          between the metabolism of the cell and biomass, as well as product formation. However,
                          these processes are usually the actual subject of media optimization. The trend towards
                          automated processes requires a validated, mechanistic process model that represents the
                          processes in the cell in sufficient detail and causally [19,20]. In this work, the application
                          of a dynamic metabolic model to mAb-producing CHO-DG44 cells is investigated and
                          a procedure for model validation is presented. Models of this kind are published in the
                          literature; recently, a metabolic model has been presented by Robitaille for CHO cells [21].
                          The model used in this work additionally includes the implementation of cell death and
                          is, to our knowledge, the first adaption to CHO-DG44 for mAb production in fed-batch
                          cultivation.

                          1.1. QbD-Based Process Development
                                The quality-by-design (QbD) concept has become an established pillar in modern
                          process development of biologics [22–24]. In contrast to classical quality-by-testing, this
                          approach, based on the use of process understanding and quantitatively defined nor-
                          mal operating range, enables the process to be readjusted for optimization, even after
                          approval [25].
                                The basic principles of QbD-based process development are laid down in the ICH
                          guidelines Q8–Q12 [26–30]. Figure 1 graphically illustrates the most important steps and
                          development phases. Once the most important product properties have been determined
                          and the quality target product profile (QTPP) thus defined, it is possible to derive related
                          critical product properties [31,32]. If the focus is on process development, traditional
                          process parameters such as productivity are often chosen as critical quality attributes (CQA),
                          in addition to toxicity, bioavailability, etc. [33]. This enables an initial risk assessment to be
                          carried out [34]. If predictive, mechanistic models are to be developed alongside or instead
                          of resource-intensive experiments and subsequently used for optimization and control, the
                          risk assessment of the model must be carried out according to the same principles as those
                          used in an experimental process development [35]. Part of this procedure is the collection
                          and quantitative evaluation of risk severity and risk probability, which together result in
                          a risk rank that forms the decision-making basis for the design of multi- and univariate
                          investigations [36].
be carried out [34]. If predictive, mechanistic models are to be developed alongside or
                                 instead of resource-intensive experiments and subsequently used for optimization and
                                 control, the risk assessment of the model must be carried out according to the same prin-
                                 ciples as those used in an experimental process development [35]. Part of this procedure
                                 is the collection and quantitative evaluation of risk severity and risk probability, which
Processes 2022, 10, 316                                                                                                 3 of 16
                                 together result in a risk rank that forms the decision-making basis for the design of multi-
                                 and univariate investigations [36].

                                                                                                                       Real time
                                                                                           PAT
                                                                                                                    release testing
                                                                                                                        (RTRT)

      Define Quality      Determine Critical
                                                                                                                           Continuous
      Target Product      Quality Attributes    Risk Assessment          Design Space            Control Strategy
                                                                                                                          Improvement
      Profile(QTPP)           (CQAs)

                                                                  DoE

                                                              Modeling

                                               Part of process model validation workflow

                                 Figure 1. Workflow of model validation based on a QbD-oriented approach [37]. In a first step, the
                                 QTPPs are defined. Subsequently, the CQAs are defined and a risk assessment of the influence of
                                 various process parameters on the CQAs is carried out. The risk assessment results in a design space
                                 for the process parameters to be investigated, which can be examined either via experiments or by
                                 means of a rigorous process model. Based on the results, a control strategy is defined, which can be
                                 continuously compared online via PAT with the actual state of the system. Strict implementation of
                                 this strategy allows for continuous process optimization.

                                      In analogy to the experimental development, design-of-experiments (DoE) can also be
                                 used in the model validation. This allows the evaluation of the criticality of the investigated
                                 parameters, and additionally the definition of a design space [38].
                                      The following steps in QbD-based process development deal with the feasibility
                                 of a control strategy [39]. The control strategy lists the critical process parameters and
                                 the CQAs depending on them, which have to be measured continuously in order to
                                 achieve QTTP assurance. Key enabling technologies for continuous monitoring are grouped
                                 under the umbrella term process-analytical-technology (PAT). Real time release testing
                                 (RTRT) could be realized based on full QbD-based process development and validated
                                 PAT, eliminating bottlenecks in the production of critical biopharmaceuticals [40]. The
                                 continuous monitoring of process variables by PAT as well as the achieved and documented
                                 process understanding allow the process to be continuously improved based on new process
                                 data [41].

                                  1.2. Model Validation
                                       The feasibility of the continuous monitoring, control, and optimization of the process
                                  described above requires a digital twin of the process. This should be based on the model
                                  used in the process development. The distinction between a predictive process model and
                                  a digital twin is made in the literature on the basis of the model depth and the degree of
                                  information exchange with the physical process. Figure 2 shows the intermediate stages
                                  from a simple steady-state model to a fully fledged digital twin for predictive, model-
                                  based control.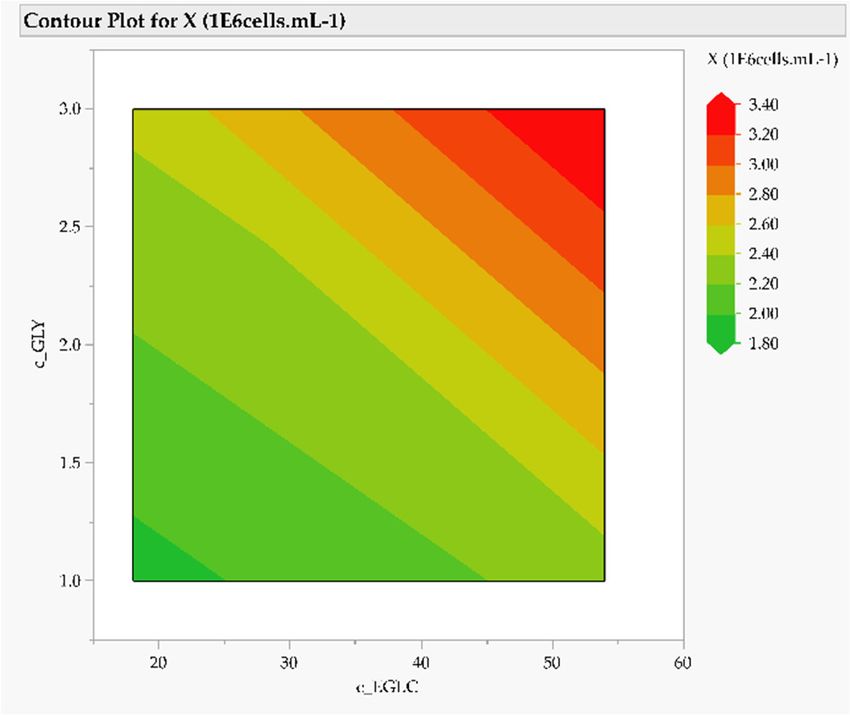
The feasibility of the continuous monitoring, control, and optimization of the process
described above requires a digital twin of the process. This should be based on the model
used in the process development. The distinction between a predictive process model and
a digital twin is made in the literature on the basis of the model depth and the degree of
information exchange with the physical process. Figure 2 shows the intermediate stages
Processes 2022, 10, 316 4 of 16
from a simple steady-state model to a fully fledged digital twin for predictive, model-
based control.
Digital Models Digital Twins
Model-Based
Steady-State Model Dynamic Model Validated Model Digital Shadow
Control
Parameter Process Real-time data
Parameter Real-time
estimates data for & control
estimates data
validation
25 Biomass concentration 25 Biomass concentration 25
Simulated Biomass (g/L) Human Process 25 Biomass concentration
Substrate concentration
95 % Confidence interval
Model Pedictive 25 Biomass concentration
Substrate concentration
95 % Confidence interval
Simulated Substrate (g/L)
Concentration (g/L)
Concentration (g/L)
20 95 % Confidence interval 20 95 % Confidence interval
Substrate concentration Substrate concentration 95 % Confidence Interval Decisions Process Control
Concentration (g/L)
Concentration (g/L)
15 15
20 20 20 95 % Confidence Interval 10 10
Measured Biomass Conc.
Concentration (g/L)
Measured Substrate Conc. 5 5
15 15 15 0 0
0 20 40 60 80 100 0 20 40 60 80 100
Time (h) Time (h)
10 10 10
5 5 5
0 0 0
0 20 40 60 80 100 0 20 40 60 80 100 0 20 40 60 80 100 Feed Filtrate Bleed Feed Filtrate Bleed
Time (h) Time (h) Time (h)
Steady-state mass System behavior Inclusion of more Execution in real-time Closed-loop process
and energy over time complex based on automated control and on-line
balances phenomena, e.g. input through data optimization
Identify optimal feed-back inhibition link with process
First pass operational
optimization and conditions Validation against
calculation process data
Scaling up of design
procedures at and process control
initial design stage
Figure 2. Levels of a digital twin, starting from a steady-state-model, over a dynamic model, a
validated model, and a digital shadow to a model-based control [42].
A prerequisite for the use of digital twins in regulated industries in a QbD-based
process is a quantitative and unambiguous validation of the process model [43], as shown
in Figure 3. The procedure for this is described several times in the literature for different
upstream and downstream processes. Here, the specifics of a dynamic metabolic model
for cell cultivation are addressed. First, after defining the model task and application, the
model must be verified. In this case, it must be verified whether the model can reasonably
represent the fundamental processes, such as cell growth, substrate consumption and
product formation. Due to the large number of Monod-based formation and consumption
rates, particular attention must be paid to the correct implementation of stoichiometry. If
the model is plausible according to the assessment of an experienced process engineer, the
sensitivity of the model should be quantified in the next step. For this purpose, DoE can
be used to compare sensitivities from the model prediction with those from the process
development. If the sensitivity is known, a rough design space can be defined, for example
in the form of contour plots, which can also be used for further process optimization. For
use as a digital twin, the model must be accurate and precise. For different states, the
model predictions must match the target variables measured in the process (accuracy). For
robust control, sufficient precision in the prediction is also necessary. The final validation
milestone tests whether the model in the design space under investigation is at least as
precise and accurate as the measurement in the physical process.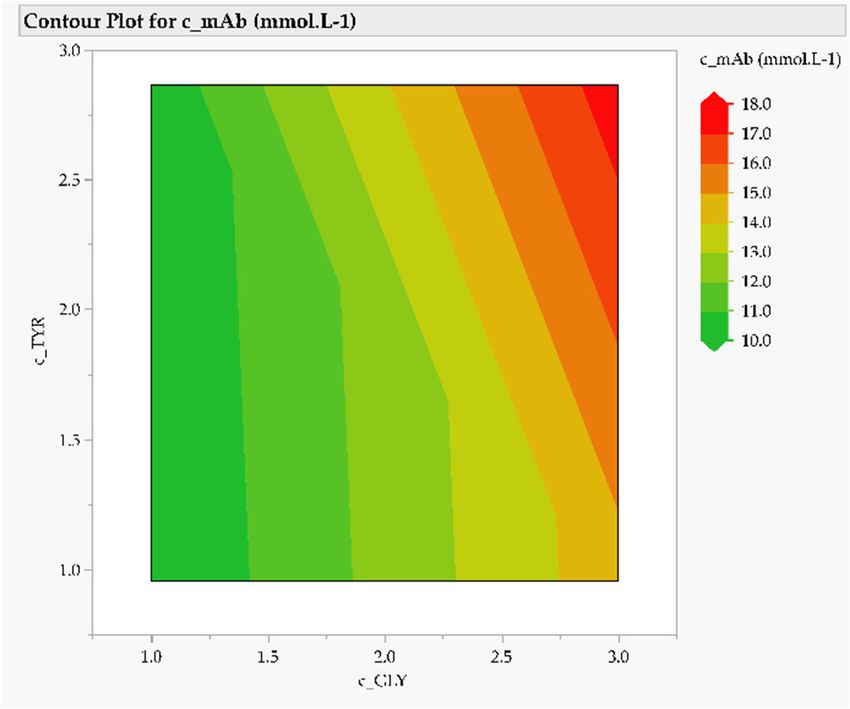
Processes 2022,2022,
Processes 10, x10,FOR
316 PEER REVIEW 5 of 16
Define model task and
application
Derive conceptual model
Derive conceptual model
(modeling depth)
Tools:
1. Literature data
2. Prior knowledge
3. Risk Assessment Implement conceptual
model
Tools: Decision criteria I -
Check equations for Plausability:
1. Syntax Verify
Verifycomputerized
conceptual model
model 1. Characteristic
2. Dimensional analysis numbers
3. Mass and energy balances 2. Simulation of
No
simplified case studies
No Tools: and comparison with
Sensitivity according to RA: Model verified? analytical short cuts
1. One-parameter-at-a-time 3. Closed balances
study (OFAT) to detect gross
errors for low risk scores Yes proofs the model is not
2. Multi-parameter-at-a-time obviously wrong
(MFAT) for high risk scores,
e.g., by Design of Experiments Sensitivity Study
including model and
operating parameters to
determine interactions and
narrow down the design space Decision criteria II -
Sensitivity fits sensitivity:
expectations? Check for effect
Tools: strength and direction
1. Physical properties
Yes
(database)
No 2. Correlations
3. Lab-scale experiments & Establish model parameter 1
0.8
error propagation determination concept 0.6
0.4
K m
4. Lab-scale experiments for
0.2
Factor-2 (1%)
a
0
-0.2 V
model validation at different -0.4
d
q
-0.6
points of operation (DoE) -0.8
-1
-1 -0.8 -0.6 -0.4 -0.2 0 0.2 0.4 0.6 0.8 1
Factor-1 (99%)
Tools (stepwise assembling Separation of effects and
Precision not reached
of equations): experimental determination
1. Energy balance equipment
2. Fluid dynamics (Tracer)
3. Phase equilibrium
4. Mass transfer kinetics As expected by an
(5. Reaction, equilibrium and experienced engineer
Assess impact of
kinetics) Assess influcences of errors
experimental model
in model parameter Decision criteria III-
parameter determination
determination on model accuracy & precision:
Tools: errors on model
1. DoE/MC-based
1. Error propagation of comparison of model
experiments and experimental error
2. Monte Carlo simulations to (multi-parameter)
detect the impact of parameter
determination error on Precision and Accuracy
Capped mRNA concentrartion (礛 )
simulation result precision of model higher than 4,5
and accuracy experimental data to be 3,0
substituted? 1,5
0,0 Mean
Min./max.
Sensitivity = accuracy not reached 0 150 300 450 600
Time (min)
Yes
Simulate experimental data Modeling error <
Tools: obtained through DoE plan experimental error
1. Field experiments for model and perform statistical
validation at individual points evaluation =
inside the design space, eg, cp proof of model accuracy
and oop and precision
2. Data reconciliation Decision criteria IV:
1. Parameter
interactions and
strength as in
experiments
Accuracy and precision
of model equals reality
Yes
Model is verified and
distinctively, quantitatively
validated
and can be used for design
space definition and control
strategy development
Comparison of regression
efficiency (R2)
Figure
Figure 3.3.Decision
Decisiontreetree
for a for a process
process model validation
model validation according toaccording to application
Sixt et al. The Sixt et al. allows
The applicatio
a
aquantitative
quantitative evaluation
evaluation of thequality
of the model modelbased
quality based onand
on mechanistic mechanistic and statistical
statistical decision criteria. Adecision
Arigorous execution
rigorous of the of
execution procedure leads to aleads
the procedure distinctively and quantitatively
to a distinctively validated rigorous
and quantitatively validated
process model.
process model.
2. Modeling of the Intracellular Metabolism of CHO Cells
The mathematical description of intracellular metabolism was adapted from
lished dynamic metabolic model [21]. A detailed overview of model equations
Processes 2022, 10, 316                                                                                             6 of 16

                          2. Modeling of the Intracellular Metabolism of CHO Cells
                               The mathematical description of intracellular metabolism was adapted from a pub-
                          lished dynamic metabolic model [21]. A detailed overview of model equations can be
                          found in the original publication [21]. The reaction equations are based on modified
                          Michaelis–Menten-type reaction equations. Multiplicative Michaelis–Menten equations
                          are used when multiple substrates are involved. Feedback inhibition and activation were
                          considered by using formulations 1 and 2, respectively.
                                                                       vmax·[S]
                                                             v=                   ,                                  (1)
                                                                           [I]
                                                                  KS · 1 + KI + [S]

                                                                               β · [A]
                                                             vmax · [S] · 1 + α · [K ]
                                                      v=                       A         ,                         (2)
                                                                    [A]                 [A]
                                                         KS · 1 + KA + [S] · 1 + KA

                          where vmax is the maximal reaction rate, [S], [A], and [I] are the concentrations of sub-
                          strate, activator, and inhibitor, respectively, and KS , KA , and KI , are the Michaelis–Menten
                          constants for substrate, activator, and inhibitor, respectively.
                                The cell-specific growth rate, as well as the mAb formation rate, were also formulated
                          as multiplicative Monod kinetics, with all amino acids, ATP, and, in the case of the growth
                          rate, additionally glucose-6-phosphate and ribulose-5-phosphate, each being considered
                          with a separate term. A separate Monod constant was also defined for each of the substrates
                          for both the growth and the mAb formation.
                                The reaction network, shown in Figure 4, covers the major metabolic pathways of
                          central metabolism, namely glycolysis, TCA cycle, pentose phosphate pathway, and oxida-
                          tive phosphorylation as well as energy-consuming pathways in the form of ATPases, and
                          anabolic reactions for cell division and mAb synthesis. Additionally, the model includes the
                          most relevant metabolic pathways for amino acid metabolism, especially glutaminolysis as
                          a central contributor to the TCA cycle. In addition, aspartate and alanine transaminase, the
                          conversion of serine to pyruvate and formation of alpha ketoglutarate and succinate from
                          two different reactions is covered in the model.
                                The composition of cells and the result he literature [44]. An average molecular weight
                          of 107.5 g mol−1 was assumed for the proteins composing the biomass. The IgG1 sequence
                          was assumed to be the average sequence as proposed in the literature [45], and the amino
                          acid consumption for mAb synthesis was set accordingly. Lipid metabolism was not
                          considered separately in the model; hence, the assumption was made that the entire lipid
                          content of the cells was derived from citrate in the citric acid cycle. Similarly, the synthesis
                          of nucleic acids was modeled as a lumped reaction and the synthesis was assumed to be
                          derived from ribulose-5-phosphate and glucose-6-phosphate. The ATP requirements for the
                          synthesis of biomass and mAb were adopted from the literature [19]. From the literature, a
                          conversion factor of 3.15 × 10⁻⁴ gDW 10−6 cells was adopted [21].
tified substrates.
- -The cell volume was assumed to be constant. The concentration of intrace
strates depends on the volume of the cell, whereas the substrate mass rem
stant. Changes in the concentration of intracellular substrates due to chan
Processes 2022, 10, 316 volume were not considered. 7 of 16
- -The composition of the cells was assumed to be constant.
Figure network
Figure 4. Metabolic 4. Metabolic network
described described
by the by the
model. Solid model.
lines Solid
represent thelines represent
biochemical the biochemic
reactions,
dashed linesdashed lines the
the inhibition inhibitionand
mechanisms, mechanisms,
dotted lines and dotted
describe lines describe
activation [21]. activation [21].
For dynamicInmodeling
additiontheto following assumptions
the description were made:
of substrate consumption and the associate
- Ideallyformation
mixed stirred tankgrowth,
and cell reactor, described
i.e., no spatial differences
by the metabolicin model,
pH, temperature,
fluid dynamics a
concentration of chemical species. Constant pH, constant temperature,
balance are necessary for a complete process model in order to be no oxygen
scale-able d
limitation.
- The model is an unsegregated, structured model, meaning the entire cell population
was assumed to be an “average cell” and cell cycle differences were not considered.
- Limited number of metabolites: primarily metabolites were used that represent a
branch in a metabolic pathway, or that are taken up directly from the medium into the
cell. In this approach, subsequent reactions are often grouped together, allowing theProcesses 2022, 10, 316 8 of 16
number of metabolites, and thus model complexity, to be reduced without sacrificing
predictive power.
- Constant enzyme amounts: the maximum reaction rate of an enzyme-catalyzed re-
action depends on the enzyme amount. The enzyme amount depends on the tran-
scription and translation rates, which may depend on substrate concentration and
other influencing variables. In order to represent the dependence of transcription and
translation rates, “omics” data are required, which were not available in the context of
this work. Therefore, constant enzyme amounts were assumed in this model.
- New cells and monoclonal antibodies were assumed to be directly formed from
precursors present in the cell (amino acids, citrate (representing lipids), and R5P
(representing nucleotides).
- Analytically undetermined media components such as vitamins, trace elements, phos-
pholipid precursors, growth factors, etc., were assumed to be non-limiting. Thus, it
implicitly follows that the growth rate depends only on the number of quantified
substrates.
- The cell volume was assumed to be constant. The concentration of intracellular
substrates depends on the volume of the cell, whereas the substrate mass remains
constant. Changes in the concentration of intracellular substrates due to changes in
cell volume were not considered.
- The composition of the cells was assumed to be constant.
In addition to the description of substrate consumption and the associated product
formation and cell growth, described by the metabolic model, fluid dynamics and energy
balance are necessary for a complete process model in order to be scale-able due to fluid
dynamics and energy management non-idealities due to scale. In the context of this work,
work was carried out at the 1 L scale standardized defined laboratory equipment. At this
small scale, fluid dynamics non-idealities do not play a significant role in terms of mixing
time and residence time behavior. Details on the implementation of such an approach, i.e.,
residence time and energy balancing non-idealities for stirred reactors at different scales,
can be found in [46], for example.
Here, the balance space for the energy balance includes the accumulation as the
difference of the heat energy removed and added (see Equation (3)). The power input
of the stirrer can be described by Equation (4). Here, the Ne number describes the ratio
of flow resistance to inertial force. To keep the bioreactor at 37 ◦ C, the reactor must be
tempered. The heat supplied or dissipated via the double jacket depends on the heat
transfer coefficient and the exchange surface (see Equation (5)).
dT . .
ρS ·cp ·Vs = QSt − QCool (3)
dt
.
QSt = Ne · n3 · dR · ρS (4)
.
QCool = kw ·AM ·∆T (5)
3. Model Parameter Determination
As usual, at first the equipment setup is characterized fluid dynamically and due to
its energy management [46]. The metabolic flux model parameters were initially taken
from the original publication. Since the model predictions did not apply to the cell line
used, the model parameters were newly determined for the different CHO DG 44 cell
line. A total of 12 key parameters had to be determined specifically in order to sufficiently
describe the cultivation of those CHO DG 44 cells. Table 1 shows the modified parameters
and the only slightly updated parameter values. With the exception of the first parameter,
Kgrowth,NH4 , which is the Michaelis–Menten constant of growth inhibition by ammonium,
all of the parameters are maximal reaction rates. Maximal reaction rates are dependent on
the amount of enzyme present. Since a different cell line was used, expression of different
enzymes may differ, leading to a different metabolic phenotype.Processes 2022, 10, 316 9 of 16
Table 1. Modified parameters and new parameter values.
Parameter. Value Unit
K_growth_dNH4 20 mM
v_mab_max 3.30 × 10⁻⁴ mM 10−6 cells h−1
v_AAtoSUC_max 6.50 × 10⁻⁵ mM 10−6 cells h−1
v_AlaTA_fmax 3.40 × 10⁻³ mM 10−6 cells h−1
v_AlaTA_rmax 0.24 mM 10−6 cells h−1
v_ASTA_max 7.80 × 10⁻⁶ mM 10−6 cells h−1
v_GlnT_fmax 1.91 × 10⁻⁴ mM 10−6 cells h−1
v_GlnT_rmax 1.27 × 10⁻⁵ mM 10−6 cells h−1
v_HK_max 6.60 × 10⁻⁵ mM 10−6 cells h−1
v_LDH_fmax 8.50 × 10⁻⁷ mM 10−6 cells h−1
v_LDH_rmax 0.48 mM 10−6 cells h−1
v_SDHH_max 5.10 × 10⁻⁶ mM 10−6 cells h−1
4. Model Validation
4.1. Sensitivity Analysis
Part of the model validation process is the execution of the model verification. As
described in the introduction, it is examined here whether the plausibility is given. For
this purpose, the syntax and the stoichiometry are checked for errors. Likewise, the
plausibility of the model has been tested with regard to the correct implementation of
substrate consumption, cell growth, and product formation (see Section 4.1.1). In the
following, the sensitivity of the model parameters, which is the second decision criterion,
is investigated. The results are discussed in Section 4.1.2. The quantification of accuracy
and precision of the model predictions is presented using Monte Carlo simulations in
Section 4.2.
4.1.1. Plausibility
Figure 5 shows the model prediction for cell growth, product formation as well as the
different substrate courses. The model prediction qualitatively agrees with the experimental
courses. The characteristic decrease in VCD after 200 h is correctly reproduced. The
sigmoidal course of the product concentration as well as the turnover of the substrates is
reproduced sufficiently accurately by the model within the experimental accuracy.
From the progression of, e.g., Gln (d) and ASN (f), it can be seen that these amino
acids are consumed faster in cultivation than they are supplied by feeding. Furthermore,
from the progression of GLY concentration (h), a slight overfeeding of this component can
be predicted by the model.Figure 5 shows the model prediction for cell growth, product formation as well as
the different substrate courses. The model prediction qualitatively agrees with the exper-
imental courses. The characteristic decrease in VCD after 200 h is correctly reproduced.
ProcessesThe
2022,sigmoidal
10, 316 course of the product concentration as well as the turnover of the substrates10 of 16
is reproduced sufficiently accurately by the model within the experimental accuracy.
30 5.0 50
VCD (1E6 cells/mL) 4.5
mAb (g/L)
Glc (mM)
25 X (1E6cells.mL-1) mAb (g/L)
4.0 40 c_EGLC (mmol.L-1)
Concentration (g/L)
Concentration (g/L)
VCD (106 cells/mL)
3.5
20
3.0 30
15 2.5
2.0 20
10
1.5
10
5 1.0
0.5
0 0
0.0
0 50 100 150 200 250 300 -50 0 50 100 150 200 250 300 350 400 -50 0 50 100 150 200 250 300 350 400
Time (h) Time (h) Time (h)
(a) (b) (c)
20 40 20
18 c_EGLN (mmol.L-1) c_EGLU (mmol.L-1) 18 c_ASN (mmol.L-1)
Gln Glu Asn
16 16
30
c_EGLN (mmol.L-1)
c_EGLU (mmol.L-1)
c_ASN (mmol.L-1)
14 14
12 12
10 20 10
8 8
6 6
10
4 4
2 2
0 0 0
0 50 100 150 200 250 300 0 50 100 150 200 250 300 0 50 100 150 200 250 300
Time (h) Time (h) Time (h)
(d) (e) (f)
20 50 10
18 c_ASP (mmol.L-1) c_GLY (mmol.L-1) 9 c_ARG (mmol.L-1)
Asp Gly Arg
16 40 8
c_ARG (mmol.L-1)
c_GLY (mmol.L-1)
c_ASP (mmol.L-1)
14 7
12 30 6
10 5
8 20 4
6 3
4 10 2
2 1
0 0 0
0 50 100 150 200 250 300 0 50 100 150 200 250 300 0 50 100 150 200 250 300
Time (h) Time (h) Time (h)
(g) (h) (i)
20 10 20
19 c_SER (mmol.L-1)
18 c_HIS (mmol.L-1) 9 c_MET (mmol.L-1) 18
17 Ser
His Met
16 8 16
15
c_MET (mmol.L-1)
c_SER (mmol.L-1)
c_HIS (mmol.L-1)
14 7 14
13
12 6 12
11
10 5 10
9
8 4 8
7
6 3 6
5
4 2 4
3
2 1 2
1
0 0 0
0 50 100 150 200 250 300 0 50 100 150 200 250 300 0 50 100 150 200 250 300
Time (h) Time (h) Time (h)
(j) (k) (l)
Figure 5. Simulation results ofSimulation
Figure 5. (a) viableresults
cell concentration, (b) mAb concentration,
of (a) viable cell concentration, (c) glucose
(b) mAb concentration, con- con-
(c) glucose
centration, (d) glutamine concentration, (e) glutamic acid concentration, (f) asparagine concentra-
centration, (d) glutamine concentration, (e) glutamic acid concentration, (f) asparagine concentration,
tion, (g) aspartic acid (g)
concentration, (h) glycine concentration,
aspartic acid concentration, (i) arginine
(h) glycine concentration, concentration,
(i) arginine (j) histi-
concentration, (j) histidine
dine concentration, (k)concentration,
methionine(k) concentration, and (l) serine
methionine concentration, concentration.
and (l) serine concentration.
4.1.2. Sensitivity
The sensitivity of the model parameters in terms of strength and direction was de-
termined using a partial factorial experimental design. This shows the main factors andFrom the progression of, e.g., Gln (d) and ASN (f), it can be seen that these amino
From the progression of, e.g., Gln (d) and ASN (f), it can be seen that these amino
acids are consumed faster in cultivation than they are supplied by feeding. Furthermore,
acids are consumed faster in cultivation than they are supplied by feeding. Furthermore,
from the progression of GLY concentration (h), a slight overfeeding of this component can
from the progression of GLY concentration (h), a slight overfeeding of this component can
be predicted by the model.
be predicted by the model.
Processes 2022, 10, 316 4.1.2. Sensitivity 11 of 16
4.1.2. Sensitivity
The sensitivity of the model parameters in terms of strength and direction was deter-
The sensitivity of the model parameters in terms of strength and direction was deter-
mined using a partial factorial experimental design. This shows the main factors and their
mined using a partial factorial experimental design. This shows the main factors and their
interactions
their withwith
interactions eacheach
other. BothBoth
other. product formation
product (see
formation Error!
(see Reference
Figure source
6a) and cell not
growth
interactions with each other. Both product formation (see Error! Reference source not
(Figure
found.a) 6b) cancell
and be growth
represented sufficiently
(Error! Reference reliably
sourcewith a p-value can
not found.b) of less than 0.0001 using
be represented suffi-
found.a) and cell growth (Error! Reference source not found.b) can be represented suffi-
the regression
ciently reliablymodel
with acreated.
p-value of less than 0.0001 using the regression model created.
ciently reliably with a p-value of less than 0.0001 using the regression model created.
(a) (b)
(a) (b)
Figure 6.
6. Actual by
by predicted plot
plot of
of DoE
DoE simulations
simulations for
for (a)
(a) mAb, and
and (b)
(b) viable
viable cell
cell concentration.
concentration.
FigureActual
Figure 6. Actual predicted
by predicted plot of DoE simulations for mAb,
(a) mAb, and (b) viable cell concentration.
In the experimental design,
In design, the
the concentration
concentrationin inthe
thereference
referencemedium
mediumwas wasvaried
varied±
In the experimental design, the concentration in the reference medium was varied ±
±50%.
50%.The Thesignificance
significanceofofthe
theparameters
parametersmustmusttherefore
therefore not
not be
be interpreted as generally
generally
50%. The significance of the parameters must therefore not be interpreted as generally
valid, but
valid, butonly
onlyforforthe
themedium
mediumused.used.For
Forboth
bothtarget
targetparameters,
parameters, the
the GLY
GLY concentration
concentration is
valid, but only for the medium used. For both target parameters, the GLY concentration
is the most significant parameter (see Figure 7). An important finding from the evaluations
the most significant parameter (see Figure 7). An important finding from the evaluations
is the most significant parameter (see Figure 7). An important finding from the evaluations
discussed
discussed above is not the fundamental dependence of cell growth and antibody produc-
discussed above is not the fundamental dependence of cell growth and antibody produc-
tivity
tivity on
on amino
amino acid
acid concentration,
concentration, butbut the
the identifiability
identifiability of
of those
those components
components that
that have
have
tivity on amino acid concentration, but the identifiability of those components that have
aa particularly sensitive
sensitive effect
effectin
inthe
theprocess
processunder
underinvestigation.
investigation.Thus,
Thus, the
the applicability
applicability of
a particularly sensitive effect in the process under investigation. Thus, the applicability of
of
thethe model
model lies
lies notonly
not onlyininthe
theprediction
predictionofofcultivation
cultivation processes,
processes, but
but in the predictive
predictive
the model lies not only in the prediction of cultivation processes, but in the predictive
optimization
optimization of of media.
media.
optimization of media.
cGLY cGLY
cPHE x cTYR cGLY cEGLC cGLY
cEGLN xcPHE
cPHEx cTYR cEGLC x cGLYcEGLC
cGLYcEGLC
x cLYSx cGLY
cEGLN
cTYRx cPHE
cLYS x cLYS
cGLY
cEGLN cTYR cCYS x cILE cLYS
cPHEcEGLN cCYS
cCYS x cILE
cGLY x cPHE cPHE cILE x cVAL cCYS
cILE xcILE
cLYSx cVAL
cASN xcGLY
cPHEx cPHE
cASN
cILE x cLYS
cCYS xcASN
cGLYx cPHE cASN x cVAL cASN
cCYS
cCYSx cGLY cALAx cVAL
cASN
cHIS cCYS cVAL cALA
cGLY x cILE cVAL
cASN cHIS
cALA x cGLYcGLY x cILE
cCYS x cEGLN cASN cALAcALAx cILEx cGLY
cCYS x cEGLN
cILE cILE x cILE
cALA
cASP x cTYR cILE cMET cILE
cALA x cCYS cMET
cASP
cASPx cTYR
cTYRx cCYS
cALA
cGLY x cHIS cASP cALA x cASN cTYR
cCYS x cGLY
cPHE x cHIS cEGLU xcALA cGLYx cASN
cCYS x cPHE
cASP x cEGLN cEGLUx cGLY
cEGLU
cSERcEGLU
cHIScASP x cEGLN
x cPHE cHIS cSER
cHIS x cPHE
cMET cARG cHIS
cASP x cCYS cMET cLEU cARG
cASP x cCYS cLEU
0 2 4 6 8 0 2 4 6
0 2 4 6 8 0 2 4 6
LogWorth (log p) LogWorth (log p)
LogWorth (log p) LogWorth (log p)
(a) (b)
(a) (b)
Figure 7. Effect summaries of DoE simulations for (a) mAb, and (b) viable cell concentration.
Although for cell growth GLC and GLY show an equivalent significance, the dominant
influence of GLY concentration for product formation can be seen from the small effect of
TYR concentration at low GLY concentrations (see Figure 8). All media components show a
positive effect direction in the investigated range. With the obtained knowledge about the
effect of the media components on cell growth and product formation, an optimized media
composition can be predicted.Although for cell growth GLC and GLY show an equivalent significance, the domi-
nant influence of GLY concentration for product formation can be seen from the small
effect of TYR concentration at low GLY concentrations (see Figure 8). All media compo-
nents show a positive effect direction in the investigated range. With the obtained
Processes 2022, 10, 316
knowledge about the effect of the media components on cell growth and product12for-of 16
mation, an optimized media composition can be predicted.
(a) (b)
Figure 8. Contour plots for (a) mAb concentration and (b) viable cell density.
(a) (b)
In order to achieve the next validation criterion, the cultivation process must now be
Figure 8.8.Contour
Contourplots for (a)
(a)mAb
mAbconcentration and
and(b) viable cell density.
reproduced sufficiently
Figureaccurately and
plots forprecisely by the model
concentration (b)for the
viable optimization.
cell density.
InInorder
ordertotoachieve
achievethe
thenext
nextvalidation
validationcriterion,
criterion,the
thecultivation
cultivationprocess
processmust
mustnow
nowbe
be
4.2. Accuracy and Precision
reproduced
reproducedsufficiently
sufficientlyaccurately
accuratelyand
andprecisely
preciselyby
bythe
themodel
modelfor
forthe
theoptimization.
optimization.
The model precision was determined for the media concentrations optimized from
4.2.Accuracy
4.2. Accuracyand
andPrecision
Precision
the MFAT study by means of a Monte Carlo simulation, shown in Figure 9. Here, 30
Themodel
The model precision
precision was determined
determinedfor forthe
themedia
mediaconcentrations
concentrations optimized
optimizedfrom
fromthe
simulations were carried
MFAT out. by
study The values for the concentrations used in the9. model were
the MFAT studymeans of a Monte
by means Carlo
of a Monte simulation, shown
Carlo simulation, inshown
Figure in Here,
Figure309.simulations
Here, 30
combined within the wererandom,
carried
simulations normally
out.
were carried distributed
The values
out. for values
The deviation
the concentrations of 5%.in This
used
for the concentrations the allows
model
used were
in the uscombined
modeltowere
determine how robust withinthe
combined modelthenormally
thewithin
random, prediction is. Fordeviation
random,distributed
normally these simulation
distributed of deviation ofresults,
5%. This allows 5%.usThis aallows
t-testushow
to determine to
robust
confidence intervaldetermine the
of 94.97%howmodel prediction
is obtained
robust thewith is.
model For these
a certaintysimulation
prediction of results,
is. 99%. a t-test
Thesimulation
For these confidence
simulation interval
a t-testof
results
results,
94.97% is obtained
confidence interval with
of a certainty
94.97% of 99%. The simulation of results deviating by less than
deviating by less than2%
2%
can
can
be
be assumed
assumed as
asissufficiently
sufficiently
obtained
accurate
with a certainty
accurate
model
model
predictions.
99%.
The
The simulation
predictions.
third
The
criterion
results
is thus
deviating by less than 2% can be assumed as sufficiently accurate model predictions. The
third criterion is thus fulfilled with regard to
fulfilled with regard to precision. precision.
third criterion is thus fulfilled with regard to precision.
Viable cell concentration (106 cells ⋅ mL)
0.4
Viable cell concentration (106 cells ⋅ mL)
0.4
4.5 Mean 4.5 Mean Mean Mean
±5% ±5% ±5%
4.0 4.0 ±5%
Antibody concentration (g/L)
Antibody concentration (g/L)
0.3
3.5 0.3
3.5
3.0
3.0
2.5 0.2
2.5 0.2
2.0
2.0 1.5 0.1
1.5 1.0 0.1
0.5 0.0
1.0
0.0
0.5 -10 0 10 20 30 40 50 60 0.070 80 -10 0 10 20 30 40 50 60 70 80
Time (h) Time (h)
0.0
-10 0 10 20 30 40 50 60 70 80 -10 0 10 20 30 40 50 60 70 80
(a) (b)
Time (h) Time (h)
(a) (b)
Figure 9. Monte Carlo Simulations using the Optimal Operating Point (derived from DoE) for initial
substrate concentrations with a standard deviation of ±5%. (a) Viable cell concentration during initial
batch phase, (b) mAb concentration.Processes 2022, 10, 316 13 of 16
5. Materials and Methods
Chinese hamster ovary cells (CHO DG44) were used to produce an immunoglobulin
(IgG1). The culture conditions were 36.8 ◦ C, pH 7.1, 60% pO2, and 433 rpm (three-blade
segment impeller with a diameter of 54 mm and blades at an angle of 30◦ , bbi-biotech
GmbH, Berlin, Germany). The cultivations were carried out in serum-free, commercial
medium (CellcaCHO Expression Platform, Sartorius Stedim Biotech GmbH, Göttingen,
Germany) in 2 L glass bioreactors (Biostat® B, Sartorius Stedim Biotech GmbH, Göttingen,
Germany) controlled via a digital control unit (DCU, Biostat® B, Sartorius Stedim Biotech
GmbH, Göttingen, Germany). Pre-cultures were grown in shake flasks in serum-free
medium. In terms of fed-batch bioreactor cultivations, feed medium (based on CellcaCHO
Expression Platform) was provided every 24 h starting at 72 h. Cell concentration was
repeatedly quantified using a hemocytometer (Neubauer improved, BRAND GmbH +
CO KG, Wertheim, Germany) and trypan blue solution (0.4%, Sigma-Aldrich, St. Louis,
MO, USA) as dye for the detection of dead cells. An in situ turbidity probe (transmission,
880 nm, HiTec Zang GmbH, Herzogenrath, Germany) was used for quantifying the cell
concentration during bioreactor cultivations. mAb concentration was determined by
Protein A chromatography (PA ID Sensor Cartridge, Applied Biosystems, Bedford, MA,
USA). Dulbecco’s PBS buffer was used as a loading buffer at pH 7.4 and as an elution buffer
at pH 2.6. The absorbance was monitored at 280 nm. Glucose and lactate concentrations
were quantified using a LaboTrace compact (TRACE Analytics GmbH, Braunschweig,
Germany).
An RP chromatography column (InfinityLab Poroshell HPH-C18; 3.0 × 100 mm;
2.7 µm; Agilent Technologies, Santa Clara, USA) was used to determine amino acid concen-
trations in the cultivation samples. Sample preparation consisted of filtration through a
0.2 µm cellulose acetate syringe filter (VWR International GmbH, Radnor, USA). Prior to
sample injection, the amino acids were derivatized using orthophthalic aldehyde (OPA). To
allow better separation of amino acids, the column oven was set to a temperature of 40 ◦ C.
The kinetic model was implemented in Aspen Custom Modeler V8.4 (Aspen Tech-
nology, Inc., Bedford, MA, USA) in order to allow total process simulations and opti-
mizations [15]. The model framework was adapted from the literature [21]. However, a
kinetic for cell death was added to the model to represent decreasing viable cell density
toward the end of the cultivation as well as scalable fluid dynamics and energy balance
non-idealities. As bioreactor cell cultures were performed in fed-batch mode with daily
bolus feed additions, the model equations were extended by feeding terms. Consequently,
volumetric changes were considered as well.
6. Discussion
The present study shows the distinct and quantitative validation of a dynamic metabolic
model that is used for simulating a fed-batch cultivation of an industrially relevant mAb-
producing CHO DG 44 cell line4.
Single- and multi-parameter-at-a-time studies reveal the significance of model pa-
rameters and enables the identification of combined parameter effects with support from
statistical evaluation (Pareto chart and partial least squares loading plot). The comparison
between the simulation and the experiment suggests sufficient precision and accuracy
for the applied model approach to be applicable in a process development scenario. It is
shown in the Pareto analysis that significant parameters regarding the concentration of the
mAb are the tyrosine, glutamine, phenylalanine, and glycine concentration. Additionally,
interactions of these parameters are significant. It is shown that the highest concentration
of mAb is positively correlated to the amino acid concentrations. The results and procedure
presented support the implementation of dynamic modelling of intracellular metabolisms
in upcoming processes. Subsequent research will focus on transferring the model to the
Fed-Batch cultivation of HEK293 cells to produce human immunodeficiency-virus-like
particles, as well as applicability of the developed model on the example of other CHO
cell lines.Processes 2022, 10, 316 14 of 16
Author Contributions: Conceptualization, J.S.; software, H.H. and A.S.; writing—original draft
preparation, H.H. and A.S.; writing—review and editing, H.H. and J.S.; supervision, J.S.; project
administration, J.S. All authors have read and agreed to the published version of the manuscript.
Funding: The authors would like to thank BMWI, especially Dr. Gahr, for project funding “Traceless
Plant Traceless Production” and the whole TPTP consortium.
Institutional Review Board Statement: Not applicable.
Informed Consent Statement: Not applicable.
Data Availability Statement: Data generated in this study are available from the authors upon
reasonable request.
Acknowledgments: The authors would like to thank the ITVP lab team, especially Alina Hengel-
brock, Frank Steinhäuser, Volker Strohmeyer, and Thomas Knebel for their efforts and support. The
authors acknowledge financial support by Open Access Publishing Fund of Clausthal University of
Technology.
Conflicts of Interest: The authors declare no conflict of interest.
References
1. Udpa, N.; Million, R.P. Monoclonal antibody biosimilars. Nat. Rev. Drug Discov. 2016, 15, 13–14. [CrossRef] [PubMed]
2. Schmidt, A.; Helgers, H.; Vetter, F.L.; Juckers, A.; Strube, J. Fast and Flexible mRNA Vaccine Manufacturing as a Solution to
Pandemic Situations by Adopting Chemical Engineering Good Practice—Continuous Autonomous Operation in Stainless Steel
Equipment Concepts. Processes 2021, 9, 1874. [CrossRef]
3. Subramanian, G. Continuous Biomanufacturing-Innovative Technologies and Methods; Wiley-VCH Verlag GmbH & Co. KGaA:
Weinheim, Germany, 2017; ISBN 9783527699902.
4. Ritacco, F.V.; Wu, Y.; Khetan, A. Cell culture media for recombinant protein expression in Chinese hamster ovary (CHO) cells:
History, key components, and optimization strategies. Biotechnol. Prog. 2018, 34, 1407–1426. [CrossRef] [PubMed]
5. Yao, T.; Asayama, Y. Animal-cell culture media: History, characteristics, and current issues. Reprod. Med. Biol. 2017, 16, 99–117.
[CrossRef]
6. Banchereau, R.; Hong, S.; Cantarel, B.; Baldwin, N.; Baisch, J.; Edens, M.; Cepika, A.M.; Acs, P.; Turner, J.; Anguiano, E.; et al.
Designing a fully automated multi-bioreactor plant for fast DoE optimization of pharmaceutical protein production. Biotechnol. J.
2013, 8, 738–747. [CrossRef]
7. Bollmann, F.; Riethmüller, D.; Johansson, E.; Tappe, A. Optimization of the HEK293T suspension cultivation with a DoE-approach
in the ambr® 15 micro bioreactor. Sartorius 2019, 2, 8.
8. Bhambure, R.; Kumar, K.; Rathore, A.S. High-throughput process development for biopharmaceutical drug substances. Trends
Biotechnol. 2011, 29, 127–135. [CrossRef]
9. Möllerl, J.; Eibl, R.; Eibl, D.; Pörtner, R. Model-based DoE for feed batch cultivation of a CHO cell line. BMC Proc 2015, 9, P42.
[CrossRef]
10. Kornecki, M.; Strube, J. Accelerating Biologics Manufacturing by Upstream Process Modelling. Processes 2019, 7, 166. [CrossRef]
11. Sinner, P.; Daume, S.; Herwig, C.; Kager, J. Usage of Digital Twins Along a Typical Process Development Cycle. Adv. Biochem. Eng.
Biotechnol. 2021, 176, 71–96. [CrossRef]
12. Abt, V.; Barz, T.; Cruz-Bournazou, M.N.; Herwig, C.; Kroll, P.; Möller, J.; Pörtner, R.; Schenkendorf, R. Model-based tools for
optimal experiments in bioprocess engineering. Curr. Opin. Chem. Eng. 2018, 22, 244–252. [CrossRef]
13. Taylor, C.; Marschall, L.; Kunzelmann, M.; Richter, M.; Rudolph, F.; Vajda, J.; Presser, B.; Zahel, T.; Studts, J.; Herwig, C. Integrated
Process Model Applications Linking Bioprocess Development to Quality by Design Milestones. Bioengineering 2021, 8, 156.
[CrossRef] [PubMed]
14. Zobel-Roos, S.; Schmidt, A.; Uhlenbrock, L.; Ditz, R.; Köster, D.; Strube, J. Digital Twins in Biomanufacturing. Adv. Biochem. Eng.
Biotechnol. 2021, 176, 181–262. [CrossRef] [PubMed]
15. Zobel-Roos, S.; Schmidt, A.; Mestmäcker, F.; Mouellef, M.; Huter, M.; Uhlenbrock, L.; Kornecki, M.; Lohmann, L.; Ditz, R.;
Strube, J. Accelerating Biologics Manufacturing by Modeling or: Is Approval under the QbD and PAT Approaches Demanded by
Authorities Acceptable Without a Digital-Twin? Processes 2019, 7, 94. [CrossRef]
16. Gronemeyer, P.; Ditz, R.; Strube, J. Trends in Upstream and Downstream Process Development for Antibody Manufacturing.
Bioengineering 2014, 1, 188–212. [CrossRef]
17. Walsh, G. Biopharmaceutical benchmarks 2018. Nat. Biotechnol. 2018, 36, 1136–1145. [CrossRef]
18. Xing, Z.; Bishop, N.; Leister, K.; Li, Z.J. Modeling kinetics of a large-scale fed-batch CHO cell culture by Markov chain Monte
Carlo method. Biotechnol. Prog. 2010, 26, 208–219. [CrossRef]
19. Nolan, R.P.; Lee, K. Dynamic model of CHO cell metabolism. Metab. Eng. 2011, 13, 108–124. [CrossRef]Processes 2022, 10, 316 15 of 16
20. Fouladiha, H.; Marashi, S.-A.; Torkashvand, F.; Mahboudi, F.; Lewis, N.E.; Vaziri, B. A metabolic network-based approach for
developing feeding strategies for CHO cells to increase monoclonal antibody production. Bioprocess Biosyst. Eng. 2020, 43,
1381–1389. [CrossRef]
21. Robitaille, J.; Chen, J.; Jolicoeur, M. A Single Dynamic Metabolic Model Can Describe mAb Producing CHO Cell Batch and
Fed-Batch Cultures on Different Culture Media. PLoS ONE 2015, 10, e0136815. [CrossRef]
22. Chhatre, S.; Farid, S.S.; Coffman, J.; Bird, P.; Newcombe, A.R.; Titchener-Hooker, N.J. How implementation of Quality by Design
and advances in Biochemical Engineering are enabling efficient bioprocess development and manufacture. J. Chem. Technol.
Biotechnol. 2011, 86, 1125–1129. [CrossRef]
23. Schmidt, A.; Richter, M.; Rudolph, F.; Strube, J. Integration of Aqueous Two-Phase Extraction as Cell Harvest and Capture
Operation in the Manufacturing Process of Monoclonal Antibodies. Antibodies 2017, 6, 21. [CrossRef] [PubMed]
24. Schmidt, A.; Strube, J. Distinct and Quantitative Validation Method for Predictive Process Modeling with Examples of Liquid-
Liquid Extraction Processes of Complex Feed Mixtures. Processes 2019, 7, 298. [CrossRef]
25. Ohage, E.; Iverson, R.; Krummen, L.; Taticek, R.; Vega, M. QbD implementation and Post Approval Lifecycle Management
(PALM). Biologicals 2016, 44, 332–340. [CrossRef] [PubMed]
26. International Council for Harmonisation of Technical Requirements for Registration of Pharmaceuticals for Human Use. ICH
guideline Q8 (R2) on pharmaceutical development: Guideline, I. Harmonised Tripartite C.H. Curr. Step 2005, 4, 11.
27. International Council for Harmonisation of Technical Requirements for Registration of Pharmaceuticals for Human Use. ICH Q9
Quality risk management: I. Harmonised Tripartite C.H. 2005. Available online: https://www.ema.europa.eu/en/ich-q9-quality-
risk-management (accessed on 5 February 2022).
28. International Council for Harmonisation of Technical Requirements for Registration of Pharmaceuticals for Human Use. ICH
Q10 Pharmaceutical quality system: Guideline, I. Harmonised Tripartite C.H. 2008. Available online: https://www.ema.europa.
eu/en/ich-q10-pharmaceutical-quality-system (accessed on 5 February 2022).
29. International Council for Harmonisation of Technical Requirements for Registration of Pharmaceuticals for Human Use. ICH
Q11 Development and manufacture of drug substances (chemical entities and biotechnological/biological entities): Guideline, I.
Harmonised Tripartite C.H. European Medicines Agency: London, UK, 2011. Available online: https://www.ema.europa.eu/en/
ich-q11-development-manufacture-drug-substances-chemical-entities-biotechnologicalbiological (accessed on 5 February 2022).
30. Technical and regulatory considerations for pharmaceutical product lifecycle management Q12. International Conference on
Harmonisation of Technical Requirements for Registration of Pharmaceuticals for Human Use. 2017. Available online: https://www.
ema.europa.eu/en/ich-q12-technical-regulatory-considerations-pharmaceutical-product-lifecycle-management (accessed on 5
February 2022).
31. CMC Biotech Working Group. A-Mab: A Case Study in Bioprocess Development; The CMC Biotech Working Group: Emeryville, CA,
USA, 2009; Volume 2.
32. CMC-Vaccines Working Group. A-VAX: Applying Quality by Design to Vaccines. 2012. Available online: https://www.dcvmn.
org/IMG/pdf/a-vax-applying-qbd-to-vaccines_2012.pdf (accessed on 19 January 2022).
33. Yu, L.X.; Amidon, G.; Khan, M.A.; Hoag, S.W.; Polli, J.; Raju, G.K.; Woodcock, J. Understanding pharmaceutical quality by design.
AAPS J. 2014, 16, 771–783. [CrossRef]
34. Cogdill, R.P.; Drennen, J.K. Risk-based Quality by Design (QbD): A Taguchi Perspective on the Assessment of Product Quality,
and the Quantitative Linkage of Drug Product Parameters and Clinical Performance. J Pharm Innov 2008, 3, 23–29. [CrossRef]
35. Lohmann, L.J.; Strube, J. Accelerating Biologics Manufacturing by Modeling: Process Integration of Precipitation in mAb
Downstream Processing. Processes 2020, 8, 58. [CrossRef]
36. Helgers, H.; Hengelbrock, A.; Schmidt, A.; Strube, J. Digital Twins for Continuous mRNA Production. Processes 2021, 9, 1967.
[CrossRef]
37. Uhlenbrock, L.; Sixt, M.; Strube, J. Quality-by-Design (QbD) process evaluation for phytopharmaceuticals on the example of
10-deacetylbaccatin III from yew. Resour.-Effic. Technol. 2017, 3, 137–143. [CrossRef]
38. Rajamanickam, V.; Babel, H.; Montano-Herrera, L.; Ehsani, A.; Stiefel, F.; Haider, S.; Presser, B.; Knapp, B. About Model Validation
in Bioprocessing. Processes 2021, 9, 961. [CrossRef]
39. Kepert, J.F.; Cromwell, M.; Engler, N.; Finkler, C.; Gellermann, G.; Gennaro, L.; Harris, R.; Iverson, R.; Kelley, B.; Krummen, L.;
et al. Establishing a control system using QbD principles. Biologicals 2016, 44, 319–331. [CrossRef] [PubMed]
40. Schmidt, A.; Helgers, H.; Lohmann, L.J.; Vetter, F.; Juckers, A.; Mouellef, M.; Zobel-Roos, S.; Strube, J. Process Analytical
Technology as Key-Enabler for Digital Twins in Continuous Biomanufacturing. J. Chem. Technol. Biotechnol. 2021. [CrossRef]
41. Helgers, H.; Schmidt, A.; Lohmann, L.J.; Vetter, F.L.; Juckers, A.; Jensch, C.; Mouellef, M.; Zobel-Roos, S.; Strube, J. Towards
Autonomous Operation by Advanced Process Control—Process Analytical Technology for Continuous Biologics Antibody
Manufacturing. Processes 2021, 9, 172. [CrossRef]
42. Udugama, I.A.; Lopez, P.C.; Gargalo, C.L.; Li, X.; Bayer, C.; Gernaey, K.V. Digital Twin in biomanufacturing: Challenges and
opportunities towards its implementation. Syst. Microbiol. Biomanuf. 2021, 1, 257–274. [CrossRef]
43. Sixt, M.; Uhlenbrock, L.; Strube, J. Toward a Distinct and Quantitative Validation Method for Predictive Process Modelling—On
the Example of Solid-Liquid Extraction Processes of Complex Plant Extracts. Processes 2018, 6, 66. [CrossRef]
44. Sheikh, K.; Förster, J.; Nielsen, L.K. Modeling hybridoma cell metabolism using a generic genome-scale metabolic model of Mus
musculus. Biotechnol. Prog. 2005, 21, 112–121. [CrossRef]Processes 2022, 10, 316 16 of 16
45. Quek, L.-E.; Dietmair, S.; Krömer, J.O.; Nielsen, L.K. Metabolic flux analysis in mammalian cell culture. Metab. Eng. 2010, 12,
161–171. [CrossRef]
46. Maximilian Johannes Huter. Modellunterstützte Prozessauslegung Unterschiedlicher Grundoperationen am Beispiel von Kontinuierlicher
Ultrafiltration und Absatzweiser Kristallisation; Clausthal University of Technology: Clausthal-Zellerfeld, Germany, 2020.You can also read


