TRUSTED MULTI-VIEW CLASSIFICATION
←
→
Page content transcription
If your browser does not render page correctly, please read the page content below

Published as a conference paper at ICLR 2021

 T RUSTED M ULTI -V IEW C LASSIFICATION
 Zongbo Han, Changqing Zhang, ∗ Huazhu Fu
 College of Intelligence and Computing Inception Institute of Artificial Intelligence
 Tianjin University Abu Dhabi, UAE
 Tianjin, China hzfu@ieee.org
 {zongbo,zhangchangqing}@tju.edu.cn

 Joey Tianyi Zhou
 Institute of High Performance Computing
 A*STAR, Singapore
arXiv:2102.02051v1 [cs.LG] 3 Feb 2021

 joey.tianyi.zhou@gmail.com

 A BSTRACT

 Multi-view classification (MVC) generally focuses on improving classification
 accuracy by using information from different views, typically integrating them into
 a unified comprehensive representation for downstream tasks. However, it is also
 crucial to dynamically assess the quality of a view for different samples in order to
 provide reliable uncertainty estimations, which indicate whether predictions can be
 trusted. To this end, we propose a novel multi-view classification method, termed
 trusted multi-view classification, which provides a new paradigm for multi-view
 learning by dynamically integrating different views at an evidence level. The
 algorithm jointly utilizes multiple views to promote both classification reliability
 and robustness by integrating evidence from each view. To achieve this, the
 Dirichlet distribution is used to model the distribution of the class probabilities,
 parameterized with evidence from different views and integrated with the Dempster-
 Shafer theory. The unified learning framework induces accurate uncertainty and
 accordingly endows the model with both reliability and robustness for out-of-
 distribution samples. Extensive experimental results validate the effectiveness of
 the proposed model in accuracy, reliability and robustness.

 1 I NTRODUCTION

 Multi-view data, typically associated with multiple modalities or multiple types of features, often
 exists in real-world scenarios. State-of-the-art multi-view learning methods achieve tremendous
 success across a wide range of real-world applications. However, this success typically relies
 on complex models (Wang et al., 2015a; Tian et al., 2019; Bachman et al., 2019; Zhang et al.,
 2019; Hassani & Khasahmadi, 2020), which tend to integrate multi-view information with deep
 neural networks. Although these models can provide accurate classification results, they are usually
 vulnerable to yield unreliable predictions, particularly when presented with views that are not
 well-represented (e.g., information from abnormal sensors). Consequently, their deployment in
 safety-critical applications (e.g., computer-aided diagnosis or autonomous driving) is limited. This
 has inspired us to introduce a new paradigm for multi-view classification to produce trusted decisions.
 For multi-view learning, traditional algorithms generally assume an equal value for different views
 or assign/learn a fixed weight for each view. The underlying assumption is that the qualities or
 importance of these views are basically stable for all samples. In practice, the quality of a view often
 varies for different samples which the designed models should be aware of for adaption. For example,
 in multi-modal medical diagnosis (Perrin et al., 2009; Sui et al., 2018), a magnetic resonance (MR)
 image may be sufficient for one subject, while a positron emission tomography (PET) image may
 be required for another. Therefore, the decision should be well explained according to multi-view
 inputs. Typically, we not only need to know the classification result, but should also be able to answer
 ∗
 Corresponding author: Changqing Zhang

 1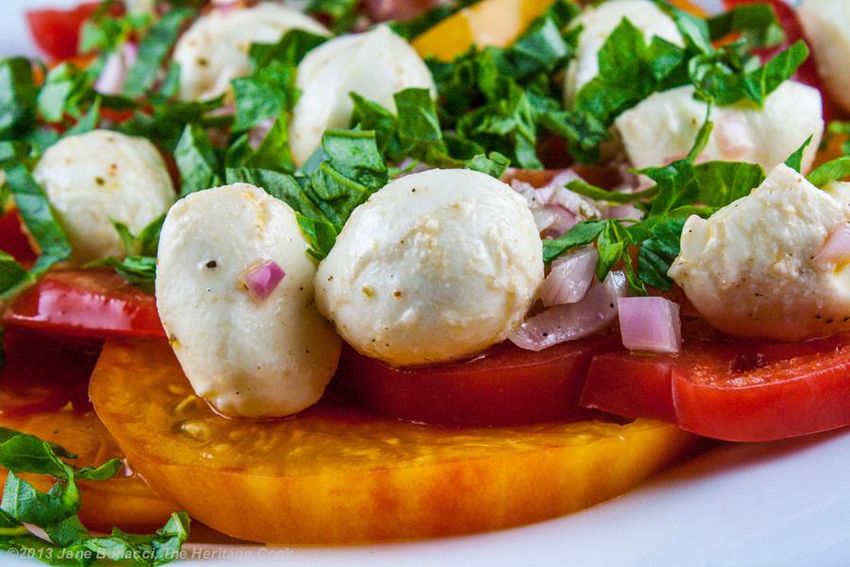
Published as a conference paper at ICLR 2021

“How confident is the decision?” and “Why is the confidence so high/low for the decision?”. To this
end, the model should provide in accurate uncertainty for the prediction of each sample, and even
individual view of each sample.
Uncertainty-based algorithms can be roughly divided into two main categories, i.e., Bayesian and
non-Bayesian approaches. Traditional Bayesian approaches estimate uncertainty by inferring a
posterior distribution over the parameters (MacKay, 1992a; Bernardo & Smith, 2009; Neal, 2012).
A variety of Bayesian methods have been developed, including Laplace approximation (MacKay,
1992b), Markov Chain Monte Carlo (MCMC) (Neal, 2012) and variational techniques (Graves, 2011;
Ranganath et al., 2014; Blundell et al., 2015). However, compared with ordinary neural networks, due
to the doubling of model parameters and difficulty in convergence, these methods are computationally
expensive. Recent algorithm (Gal & Ghahramani, 2016) estimates the uncertainty by introducing
dropout (Srivastava et al., 2014) in the testing phase, thereby reducing the computational cost. Several
non-Bayesian algorithms have been proposed, including deep ensemble (Lakshminarayanan et al.,
2017), evidential deep learning (Sensoy et al., 2018) and deterministic uncertainty estimate (van
Amersfoort et al., 2020). Unfortunately, all of these methods focus on estimating the uncertainty
on single-view data, despite the fact that fusing multiple views through uncertainty can improve
performance and reliability.
In this paper, we propose a new multi-view classification algorithm aiming to elegantly integrate multi-
view information for trusted decision making (shown in Fig. 1(a)). Our model combines different
views at an evidence level instead of feature or output level as done previously, which produces a
stable and reasonable uncertainty estimation and thus promotes both classification reliability and
robustness. The Dirichlet distribution is used to model the distribution of the class probabilities,
parameterized with evidence from different views and integrated with the Dempster-Shafer theory. In
summary, the specific contributions of this paper are:
 (1) We propose a novel multi-view classification model aiming to provide trusted and inter-
 pretable (according to the uncertainty of each view) decisions in an effective and efficient
 way (without any additional computations and neural network changes), which introduces a
 new paradigm in multi-view classification.
 (2) The proposed model is a unified framework for promising sample-adaptive multi-view
 integration, which integrates multi-view information at an evidence level with the Dempster-
 Shafer theory in an optimizable (learnable) way.
 (3) The uncertainty of each view is accurately estimated, enabling our model to improve
 classification reliability and robustness.
 (4) We conduct extensive experiments which validate the superior accuracy, robustness, and
 reliability of our model thanks to the promising uncertainty estimation and multi-view
 integration strategy.

2 R ELATED W ORK

Uncertainty-based Learning. Deep neural networks have achieved great success in various tasks.
However since most deep models are essentially deterministic functions, the uncertainty of the model
cannot be obtained. Bayesian neural networks (BNNs) (Denker & LeCun, 1991; MacKay, 1992b;
Neal, 2012) endow deep models with uncertainty by replacing the deterministic weight parameters
with distributions. Since BNNs struggle in performing inference and usually come with prohibitive
computational costs, a more scalable and practical approach, MC-dropout (Gal & Ghahramani, 2016),
was proposed. In this model, the inference is completed by performing dropout sampling from the
weight during training and testing. Ensemble based methods (Lakshminarayanan et al., 2017) train
and integrate multiple deep networks and also achieve promising performance. Instead of indirectly
modeling uncertainty through network weights, the algorithm (Sensoy et al., 2018) introduces the
subjective logic theory to directly model uncertainty without ensemble or Monte Carlo sampling.
Building upon RBF networks, the distance between test samples and prototypes can be used as the
agency for deterministic uncertainty (van Amersfoort et al., 2020). Benefiting from the learned
weights of different tasks with homoscedastic uncertainty learning, (Kendall et al., 2018) achieves
impressive performance in multi-task learning.
Multi-View Learning. Learning on data with multiple views has proven effective in a variety of
tasks. CCA-based multi-view models (Hotelling, 1992; Akaho, 2006; Wang, 2007; Andrew et al.,

 2
Published as a conference paper at ICLR 2021

 Dirichlet Distribution 11 21 31 41 … 1 1
 2
 1 = [ 11 , 21 , ⋯ , 1 ]
 3 12 11 12 12 1
 1 22 21 22 22 1

 Combining beliefs
 Evidence Uncertainty
 View-1
 1 = [ 11 , 21 , ⋯ , 1 ] ℳ 1 = { 11 , 21 , ⋯ , 1 , 1 }
 Uncertainty
 32 31 32 32 1

 42
 4
 ℳ = { 1 , 2 , ⋯ , , } 41 42 42 1
 Evidence Uncertainty
 View-2

 …

 …
 2 = [ 12 , 22 , ⋯ , 2 ] ℳ 2 = { 12 , 22 , ⋯ , 2 , 2 }
 1
 2 3 2 1 2 2 1
 Dirichlet Distribution
 2 = [ 12 , 22 , ⋯ , 2 ] 2 11 2 21 2 31 2 41 2 … 1 2 1 2

 (a) Overview of the trusted multi-view classification (b) Combining beliefs

Figure 1: Illustration of our algorithm. (a) The evidence of each view is obtained using neural
networks ( 1 ). The obtained evidence parameterizes the Dirichlet distribution ( 2 ) to induce the
classification probability and uncertainty ( 3 ). The overall uncertainty and classification probability
are inferred by combining the beliefs of multiple views based on the DST ( 4 ). The combination
rule and an example are shown in Definition 4 and (b), respectively. Given two sets of beliefs (blue
and green blocks), we recombine the compatible parts of the two sets (brown blocks) and ignore the
mutually exclusive parts (white blocks) of the two sets to obtain the combined beliefs.

2013; Wang et al., 2015a; 2016) are representative ones that have been widely used in multi-view
representation learning. These models essentially seek a common representation by maximizing the
correlation between different views. Considering common and exclusive information, hierarchical
multi-modal metric learning (HM3L) (Zhang et al., 2017) explicitly learns shared multi-view and
view-specific metrics, while AE 2 -Nets (Zhang et al., 2019) implicitly learn a complete (view-specific
and shared multi-view) representation for classification. Recently, the methods (Tian et al., 2019;
Bachman et al., 2019; Chen et al., 2020; Hassani & Khasahmadi, 2020) based on contrastive learning
have also achieved good performance. Due to its effectiveness, multi-view learning has been widely
used in various applications (Kiela et al., 2018; Bian et al., 2017; Kiela et al., 2019; Wang et al.,
2020).
Dempster-Shafer Evidence Theory (DST). DST, which is a theory on belief functions, was first
proposed by Dempster (Dempster, 1967) and is a generalization of the Bayesian theory to subjective
probabilities (Dempster, 1968). Later, it was developed into a general framework to model epis-
temic uncertainty (Shafer, 1976). In contrast to Bayesian neural networks, which indirectly obtain
uncertainty through multiple stochastic samplings from weight parameters, DST directly models
uncertainty. DST allows beliefs from different sources to be combined with various fusion operators
to obtain a new belief that considers all available evidence (Sentz et al., 2002; Jøsang & Hankin,
2012). When faced with beliefs from different sources, Dempster’s rule of combination tries to fuse
their shared parts, and ignores conflicting beliefs through normalization factors. A more specific
implementation will be discussed later.

3 T RUSTED M ULTI -V IEW C LASSIFICATION

It has been shown that using a softmax output as confidence for predictions often leads to high
confidence values, even for erroneous predictions since the largest softmax output is used for the final
prediction (Moon et al., 2020; van Amersfoort et al., 2020). Therefore, we introduce an evidence-
based uncertainty estimation technique which can provide more accurate uncertainty and allow us to
flexibly integrate multiple views for trusted decision making.

3.1 U NCERTAINTY AND THE T HEORY OF E VIDENCE

In this subsection, we elaborate on evidential deep learning to quantify the classification uncertainty
for each of multiple views, which simultaneously models the probability of each class and overall
uncertainty of the current prediction. In the context of multi-class classification, Subjective logic (SL)
(Jøsang, 2018) associates the parameters of the Dirichlet distribution (Definition A.1 in the Appendix)

 3
Published as a conference paper at ICLR 2021

 3
 1 2

 (a) Confident prediction (b) Out of distribution (c) High uncertainty (d) Opinion (M)

 Figure 2: Typical examples of Dirichlet distribution. Refer to the text for details.

with the belief distribution, where the Dirichlet distribution can be considered as the conjugate prior
of the categorical distribution (Bishop, 2006).
Accordingly, we need to determine the concentration parameters, which are closely related to
the uncertainty. We elaborate on the Subjective logic (Jøsang, 2018), which defines a theoretical
framework for obtaining the probabilities (belief masses) of different classes and overall uncertainty
(uncertainty mass) of the multi-classification problem based on the evidence collected from data. Note
that evidence refers to the metrics collected from the input to support the classification (step 1 in
Fig. 1(a)) and is closely related to the concentration parameters of Dirichlet distribution. Specifically,
for the K classification problems, subjective logic tries to assign a belief mass to each class label and
an overall uncertainty mass to the whole frame based on the evidence. Accordingly, for the v th view,
the K + 1 mass values are all non-negative and their sum is one:
 K
 X
 uv + bvk = 1, (1)
 k=1

where uv ≥ 0 and bvk ≥ 0 indicate the overall uncertainty and the probability for the k th class,
respectively.
For the v th view, subjective logic connects the evidence ev = [ev1 , · · · , evK ] to the parameters of the
Dirichlet distribution αv = [α1v , · · · , αK
 v
 ] (step 2 in Fig. 1(a)). Specifically, the parameter αkv of
the Dirichlet distribution is induced from evk , i.e., αkv = evk + 1. Then, the belief mass bvk and the
uncertainty uv (step 3 in Fig. 1(a)) are computed as
 evk αkv − 1 K
 bvk = = and uv = , (2)
 Sv Sv Sv
 PK PK v
where S v = v
 i=1 (ei + 1) = i=1 αi is the Dirichlet strength. Eq. 2 actually describes the
phenomenon where the more evidence observed for the k th category, the greater the probability
assigned to the k th class. Correspondingly, the less total evidence observed, the greater the total
uncertainty. The belief assignment can be considered as a subjective opinion. Given an opinion,
the mean of the corresponding Dirichlet distribution p̂v for the class probability p̂vk is computed as
 αv
p̂vk = Skv (Frigyik et al., 2010).
Differences from traditional deep-neural-network classifiers. Firstly, the output of traditional
neural network classifiers can be considered as a point on a simplex, while Dirichlet distribution
parametrizes the density of each such probability assignment on a simplex. Therefore, with the
Dirichlet distribution, SL models the second-order probability and uncertainty of the output. Secondly,
the softmax function is widely used in the last layer of traditional neural network classifiers. However,
using the softmax output as the confidence often leads to over-confidence. In our model, the
introduced SL can avoid this problem by adding overall uncertainty mass. Existing methods (Gal &
Ghahramani, 2016; Lakshminarayanan et al., 2017) usually require additional computations during
inference to output uncertainty. Since the uncertainty is obtained during the inference stage, it is
difficult to seamlessly train a model with high accuracy, robustness and reasonable uncertainty in
a unified framework. Accordingly, the limitations underlying existing algorithms (e.g., inability to
directly obtain uncertainty) also limits their extension to trusted multi-view classification.
For clarity, we provide typical examples under a triple classification task to illustrate the above
formulation. Let us assume that e = h40, 1, 1i and accordingly we have α = h41, 2, 2i. The

 4
Published as a conference paper at ICLR 2021

corresponding Dirichlet distribution, shown in Fig. 2(a), yields a sharp distribution centered on the top
of the standard 2-simplex. This indicates that sufficient evidence has been observed to ensure accurate
classification. In contrast, let us assume that we have the evidence e = h0.0001, 0.0001, 0.0001i,
which is little evidence for classification. Accordingly, we obtain the Dirichlet distribution parameter
α = h1.0001, 1.0001, 1.0001i and the uncertainty mass u ≈ 1. As shown in Fig. 2(b), in this case,
the evidence induces quite a flat distribution over the simplex. Finally, when e = h5, 5, 5i, there
is also a high uncertainty, as shown in Fig. 2(c), even though the overall uncertainty is reduced
compared to the second case. As shown in Fig. 2(d), we can convert a Dirichlet distribution into a
standard 3-simplex (a regular tetrahedron with vertices (1,0,0,0), (0,1,0,0), (0,0,1,0) and (0,0,0,1)
in R4 ) based on the subjective logic theory (Eq. 1 and Eq. 2), where the point (M) in the simplex
corresponding to {bk }3k=1 , u indicates an opinion. Accordingly, the expectation value p̂ of the
Dirichlet distribution is the projection of M on the bottom.

3.2 D EMPSTER ’ S RULE OF C OMBINATION FOR M ULTI -V IEW C LASSIFICATION

Having introduced evidence and uncertainty for the single-view case, we now focus on their adaptation
to data with multiple views. The Dempster–Shafer theory of evidence allows evidence from different
sources to be combined arriving at a degree of belief (represented by a mathematical object called the
belief function) that takes into account all the available evidence (see Definition 3.1). Specifically,
we
 need to combine V independent sets of probability mass assignments {Mv }V1 , where Mv =
 {bk }k=1 , u , to obtain a joint mass M = {bk }k=1 , u (step 4 in Fig. 1(a)).
 v K v
  K

Definition 3.1 (Dempster’s combination rule for two independent sets of masses) The combination
(called the joint mass) , u is calculated from the two sets of masses M1 =
  K
 M = {b k }k=1
 {bk }k=1 , u and M = {bk }k=1 , u in the following manner:
 1 K 1 2
  2 K 2

 M = M1 ⊕ M2 . (3)
The more specific calculation rule can be formulated as follows:
 1 1
 bk = (b1k b2k + b1k u2 + b2k u1 ), u = u1 u2 , (4)
 1−C 1−C
where C = i6=j b1i b2j is a measure of the amount of conflict between the two mass sets (the white
 P

blocks in Fig. 1(b)), and the scale factor 1−C 1
 is used for normalization.

The joint opinion M is formed based on the fusion of opinions M1 and M2 . The joint belief mass
of class k (bk ) and overall uncertainty (u) correspond to the brown blocks in Fig. 1(b). Intuitively, the
combination rule ensures: (1) when both views are of high uncertainty (large u1 and u2 ), the final
prediction must be of low confidence (small bk ); (2) when both views are of low uncertainty (small
u1 and u2 ), the final prediction may be of high confidence (large bk ); (3) when only one view is of
low uncertainty (only u1 or u2 is large), the final prediction only depends on the confident view.
Then, given data with V different views, we can obtain the above-mentioned mass for each view.
Afterwards, we can combine the beliefs from different views with Dempster’s rule of combination.
Specifically, we fuse the belief mass and uncertainty mass between different views with the following
rule:
 M = M1 ⊕ M2 ⊕ · · · MV . (5)
After obtaining the joint mass M = {bk }k=1 , u , according to Eq. 2, the corresponding joint
  K

evidence from multiple views and the parameters of the Dirichlet distribution are induced as
 K
 S = , ek = bk × S and αk = ek + 1. (6)
 u
Based on the above combination rule, we can obtain the estimated multi-view joint evidence e and
the corresponding parameters of joint Dirichlet distribution α to produce the final probability of each
class and the overall uncertainty.
Advantages of using subjective logic compared with softmax. Compared with softmax output,
using subjective uncertainty is more suitable for the fusion of multiple decisions. Subjective logic
provides an additional mass function (u) that allows the model distinguish between a lack of evidence.
In our model, subjective logic provides the degree of overall uncertainty of each view, which is
important for trusted classification and interepretability to some extent.

 5
Published as a conference paper at ICLR 2021
3.3 L EARNING TO F ORM O PINIONS
In this section, we will discuss how to train neural networks to obtain evidence for each view,
which can then be used to obtain the corresponding masses {Mv }Vv=1 and M. The neural networks
can capture the evidence from input to induce a classification opinion (Kiela et al., 2018), and the
conventional neural-network-based classifier can be naturally transformed into the evidence-based
classifier with minor changes. Specifically, the softmax layer of a conventional neural-network-based
classifier is replaced with an activation function layer (i.e., RELU) to ensure that the network outputs
non-negative values, which are considered as the evidence vector e. Accordingly, the parameters of
the Dirichlet distribution can be obtained.
For conventional neural-network-based classifiers, the cross-entropy loss is usually employed:
XK
Lce = − yij log(pij ), (7)
j=1
where pij is the predicted probability of the ith sample for class j. For our model, given the
evidence of the ith sample obtained through the evidence network, we can get the parameter αi (i.e.,
αvi = eii + 1) of the Dirichlet distribution and form the multinomial opinions D(pi |αi ), where pi is
the class assignment probabilities on a simplex. After a simple modification on Eq. 7, we have the
adjusted cross-entropy loss:
Z X K K K
1 Y α −1
X
Lace (αi ) = −yij log (pij ) pijij dpi = yij (ψ (Si ) − ψ (αij )) , (8)
j=1
B (αi ) j=1 j=1
where ψ(·) is the digamma function. Eq. 8 is the integral of the cross-entropy loss function on the
simplex determined by αi . The above loss function ensures that the correct label of each sample
generates more evidence than other classes, however, it cannot guarantee that less evidence will be
generated for incorrect labels. That is to say, in our model, we expect the evidence for incorrect labels
to shrink to 0. To this end, the following KL divergence term is introduced:
KL [D (p i |α̃i )P
kD (pi |1)]
Γ( K α̃ik ) (9)
PK h P i
K
= log Γ(K) Qk=1 K
Γ(α̃ )
+ k=1 (α̃ik − 1) ψ (α̃ik ) − ψ j=1 α̃ij ,
k=1 ik
where α̃i = yi + (1 − yi ) αi is the adjusted parameter of the Dirichlet distribution which can
avoid penalizing the evidence of the groundtruth class to 0, and Γ(·) is the gamma function.
Therefore, given parameter αi of the Dirichlet distribution for each sample i, the sample-specific loss
is
L(αi ) = Lace (αi ) + λt KL [D (pi |α̃i ) kD (pi |1)] , (10)
where λt > 0 is the balance factor. In practice, we can gradually increase the value of λt so as
to prevent the network from paying too much attention to the KL divergence in the initial stage of
training, which may result in a lack of good exploration of the parameter space and cause the network
to output a flat uniform distribution.
To ensure that all views can simultaneously form reasonable opinions and thus improve the overall
opinion, we use a multi-task strategy with following overall loss function:
N
" V
#
X X
Loverall = L(αi ) + v
L(αi ) . (11)
i=1 v=1
The optimization process for the proposed model is summarized in Algorithm 1 (in the Appendix).
4 E XPERIMENTS
4.1 E XPERIMENTAL S ETUP
In this section, we conduct experiments on six real-world datasets: Handwritten1 , CUB (Wah et al.,
2011), Caltech101 (Fei-Fei et al., 2004), PIE2 , Scene15 (Fei-Fei & Perona, 2005) and HMDB
1
https://archive.ics.uci.edu/ml/datasets/Multiple+Features
2
http://www.cs.cmu.edu/afs/cs/project/PIE/MultiPie/Multi-Pie/Home.html
6
Published as a conference paper at ICLR 2021

(Kuehne et al., 2011). We first compare our algorithm with single-view classifiers to validate the
effectiveness of our algorithm in utilizing multiple views. Then, we apply existing classifiers to
multi-view features and conduct experiments under different levels of noise to investigate their ability
in identifying multi-view OOD samples. Details of these datasets and experimental setting can be
found in the appendix.
Compared methods. We compare the proposed method with
following models: (a) MCDO (monte carlo dropout) (Gal & 1.00
Ghahramani, 2015) casts dropout network training as approx- 0.95
imate inference in a Bayesian neural network; (b) DE (deep 0.90 Handwritten
ensemble) (Lakshminarayanan et al., 2017) is a simple, non-

 Accuracy
 0.85 CUB
Bayesian method which involves training multiple deep models; PIE
 0.80 Caltech101
(c) UA (uncertainty-aware attention) (Heo et al., 2018) gener-
ates attention weights following a Gaussian distribution with 0.75 Scene15
 0.70 HMDB
a learned mean and variance, which allows heteroscedastic
uncertainty to be captured and yields a more accurate cali- 0.0 0.2 0.4 0.6 0.8 1.0
 Uncertainty threshold
bration of prediction uncertainty; (d) EDL (evidential deep
Learning) (Sensoy et al., 2018) designs a predictive distribution
 Figure 3: Accuracy with uncer-
for classification by placing a Dirichlet distribution on the class
 tainty thresholding.
probabilities.

4.2 E XPERIMENTAL R ESULTS

Comparison with uncertainty-based algorithms using the best view. We first compare our algo-
rithm with current uncertainty-based classification methods. The detailed experimental results are
shown in Table 1. Since most existing uncertainty-based classification methods use single-view
data, we report the results of each method with the best-performing view in terms of both accuracy
and AUROC (Hand & Till, 2001) to comprehensively compare our method with others. As shown
in Table 1, our model outperforms other methods on all datasets. Taking the results on PIE and
Scene15 as examples, our method improves the accuracy by about 7.6% and 14.8% compared to the
second-best models (EDL/MCDO) in terms of accuracy respectively. Although our model is clearly
more effective than single-view uncertainty-based models, it is natural to further ask - what happens
if all algorithms utilize multiple views?

 Data Metric MCDO DE UA EDL Ours
 ACC 97.37±0.80 98.30±0.31 97.45±0.84 97.67±0.32 98.51±0.15
 Handwritten AUROC 99.70±0.07 99.79±0.05 99.67±0.10 99.83±0.02 99.97±0.00
 ACC 89.78±0.52 90.19±0.51 89.75±1.43 89.50±1.17 91.00±0.42
 CUB
 AUROC 99.29±0.03 98.77±0.03 98.69±0.39 98.71±0.03 99.06±0.03
 ACC 84.09±1.45 70.29±3.17 83.70±2.70 84.36±0.87 91.99±1.01
 PIE
 AUROC 98.90±0.31 95.71±0.88 98.06±0.56 98.74±0.17 99.69±0.05
 ACC 91.73±0.58 91.60±0.82 92.37±0.72 90.84±0.56 92.93±0.20
 Caltech101
 AUROC 99.91±0.01 99.94±0.01 99.85±0.05 99.74±0.03 99.90±0.01
 ACC 52.96±1.17 39.12±0.80 41.20±1.34 46.41±0.55 67.74±0.36
 Scene15 AUROC 92.90±0.31 74.64±0.47 85.26±0.32 91.41±0.05 95.94±0.02
 ACC 52.92±1.28 57.93±1.02 53.32±1.39 59.88±1.19 65.26±0.76
 HMDB
 AUROC 93.57±0.28 94.01±0.21 91.68±0.69 94.00±0.25 96.18±0.10

 Table 1: Evaluation of the classification performance.

Comparison with uncertainty-based algorithms using multiple views. To further validate the
effectiveness of our model in integrating different various views, we concatenate the original features
of multiple views for all comparison methods. We add Gaussian noise with different levels of standard
deviations (σ) to half of the views. The comparison results are shown in Fig. 4. As can be observed
that when the data is free of noise, our method can achieve competitive results. After introducing
noise to the data, the accuracy of all the comparison methods significantly decreases. Fortunately,
benefiting from the uncertainty-based fusion, the proposed method is aware of the view-specific noise
and thus achieves impressive results on all datasets. Therefore, the effectiveness for both clean and

 7
Published as a conference paper at ICLR 2021

noisy multi-view data is well validated. However, it will be more convincing to explicitly investigate
the performance in uncertainty estimation.

 0.9 0.8 0.8
 0.8
 Accuracy

 Accuracy
 Accuracy
 0.6 0.6
 0.7
 0.6 EDL EDL EDL
 UA UA 0.4 UA
 0.5 MCDO 0.4 MCDO MCDO
 DE DE 0.2 DE
 0.4 Ours Ours Ours
 0.2
 0 1 101 102 103 104 105 106 107 108 109 0 1 101 102 103 104 105 106 107 108 109 0 1 101 102 103 104 105 106 107 108 109
 Standard deviation ( ) Standard deviation ( ) Standard deviation ( )
 (a) Handwritten (b) CUB (c) PIE

 0.7
 0.90
 0.6
 0.85 0.6
 Accuracy

 Accuracy

 Accuracy
 0.80 0.5
 EDL 0.5 EDL EDL
 0.75 UA UA 0.4 UA
 MCDO 0.4 MCDO MCDO
 0.70 DE DE DE
 Ours Ours 0.3 Ours
 0.3
 0.65
 0 1 101 102 103 104 105 106 107 108 109 0 1 101 102 103 104 105 106 107 108 109 0 1 101 102 103 104 105 106 107 108 109
 Standard deviation ( ) Standard deviation ( ) Standard deviation ( )
 (d) Caltech101 (e) Scene15 (f) HMDB

 Figure 4: Performance comparison on multi-view data with different levels of noise.

Uncertainty estimation. To evaluate the uncertainty estimation, we visualize the distribution of
in-/out-of-distribution samples in terms of uncertainty. We consider the original samples as in-
distribution data, while the samples with Gaussian noise are viewed as out-of-distribution data.
Specifically, we add Gaussian noise with the fixed level of standard deviations (σ = 10) to 50%
of the test samples. The experimental results are shown in Fig. 5. According to the results, the
following observations are drawn: (1) Datasets with higher classification accuracy (e.g., Handwritten)
are usually associated with lower uncertainty for the in-distribution samples. (2) In contrast, datasets
with lower accuracy are usually associated with higher uncertainty for the in-distribution samples. (3)
Much higher uncertainties are usually estimated for out-of-distribution samples on all datasets. These
observations imply the reasonability of our model in estimating uncertainty, since it can facilitate
discrimination between these classes. Fig. 3 shows that our algorithm provides much more accurate
predictions as the prediction uncertainty decreases. This implies that trusted decisions are supported
based on the output (classification and its corresponding uncertainty) of our model.

5 C ONCLUSION

In this work, we propose a novel trusted multi-view classification (TMC) algorithm which, based
on the Dempster-Shafer evidence theory, can produce trusted classification decisions on multi-view
data. Our algorithm focuses on decision-making by fusing the uncertainty of multiple views, which
is essential for making trusted decisions. The TMC model can accurately identify the views which
are risky for decision making, and exploits informative views in the final decision. Furthermore,
our model can produce the uncertainty of a current decision while making the final classification,
providing intepretability. The empirical results validate the effectiveness of the proposed algorithm in
classification accuracy and out-of-distribution identification.

ACKNOWLEDGMENTS

This work was supported in part by National Natural Science Foundation of China (No. 61976151,
No. 61732011), and the Natural Science Foundation of Tianjin of China (No. 19JCYBJC15200).

 8
Published as a conference paper at ICLR 2021

 in-distribution in-distribution in-distribution
 out-of-distribution out-of-distribution out-of-distribution

 Density

 Density

 Density
 0.0 0.2 0.4 0.6 0.8 0.0 0.2 0.4 0.6 0.8 1.0 0.0 0.2 0.4 0.6 0.8 1.0
 Uncertainty Uncertainty Uncertainty
 (a) Handwritten (b) CUB (c) PIE

 in-distribution in-distribution in-distribution
 out-of-distribution out-of-distribution out-of-distribution
 Density

 Density

 Density
 0.0 0.2 0.4 0.6 0.8 1.0 0.0 0.2 0.4 0.6 0.8 1.0 0.0 0.2 0.4 0.6 0.8 1.0
 Uncertainty Uncertainty Uncertainty
 (d) Caltech101 (e) Scene15 (f) HMDB

 Figure 5: Density of uncertainty.

R EFERENCES
Shotaro Akaho. A kernel method for canonical correlation analysis. arXiv preprint cs/0609071, 2006.
Galen Andrew, Raman Arora, Jeff Bilmes, and Karen Livescu. Deep canonical correlation analysis.
 In International Conference on Machine Learning, pp. 1247–1255, 2013.
Philip Bachman, R Devon Hjelm, and William Buchwalter. Learning representations by maximizing
 mutual information across views. In Advances in Neural Information Processing Systems, pp.
 15535–15545, 2019.
José M Bernardo and Adrian FM Smith. Bayesian theory, volume 405. John Wiley & Sons, 2009.
Yunlong Bian, Chuang Gan, Xiao Liu, Fu Li, Xiang Long, Yandong Li, Heng Qi, Jie Zhou, Shilei
 Wen, and Yuanqing Lin. Revisiting the effectiveness of off-the-shelf temporal modeling approaches
 for large-scale video classification. arXiv preprint arXiv:1708.03805, 2017.
Christopher M Bishop. Pattern recognition and machine learning. springer, 2006.
Charles Blundell, Julien Cornebise, Koray Kavukcuoglu, and Daan Wierstra. Weight uncertainty in
 neural network. In International Conference on Machine Learning, pp. 1613–1622, 2015.
Ting Chen, Simon Kornblith, Mohammad Norouzi, and Geoffrey Hinton. A simple framework for
 contrastive learning of visual representations. arXiv preprint arXiv:2002.05709, 2020.
AP Dempster. Upper and lower probabilities induced by a multivalued mapping. The Annals of
 Mathematical Statistics, pp. 325–339, 1967.
Arthur P Dempster. A generalization of bayesian inference. Journal of the Royal Statistical Society:
 Series B (Methodological), 30(2):205–232, 1968.
John S Denker and Yann LeCun. Transforming neural-net output levels to probability distributions.
 In Advances in Neural Information Processing Systems, pp. 853–859, 1991.
Jacob Devlin, Ming-Wei Chang, Kenton Lee, and Kristina Toutanova. Bert: Pre-training of deep
 bidirectional transformers for language understanding. arXiv preprint arXiv:1810.04805, 2018.
Li Fei-Fei and Pietro Perona. A bayesian hierarchical model for learning natural scene categories. In
 2005 IEEE Computer Society Conference on Computer Vision and Pattern Recognition (CVPR’05),
 volume 2, pp. 524–531. IEEE, 2005.

 9

Published as a conference paper at ICLR 2021

Li Fei-Fei, Rob Fergus, and Pietro Perona. Learning generative visual models from few training
 examples: An incremental bayesian approach tested on 101 object categories. In 2004 Conference
 on Computer Vision and Pattern Recognition workshop, pp. 178–178. IEEE, 2004.
Bela A Frigyik, Amol Kapila, and Maya R Gupta. Introduction to the dirichlet distribution and related
 processes. Department of Electrical Engineering, University of Washignton, UWEETR-2010-0006,
 (0006):1–27, 2010.
Yarin Gal and Zoubin Ghahramani. Bayesian convolutional neural networks with bernoulli approxi-
 mate variational inference. arXiv preprint arXiv:1506.02158, 2015.
Yarin Gal and Zoubin Ghahramani. Dropout as a bayesian approximation: Representing model
 uncertainty in deep learning. In International Conference on Machine Learning, pp. 1050–1059,
 2016.
Alex Graves. Practical variational inference for neural networks. In Advances in Neural Information
 Processing Systems, pp. 2348–2356, 2011.
David J Hand and Robert J Till. A simple generalisation of the area under the roc curve for multiple
 class classification problems. Machine learning, 45(2):171–186, 2001.
Kaveh Hassani and Amir Hosein Khasahmadi. Contrastive multi-view representation learning on
 graphs. arXiv preprint arXiv:2006.05582, 2020.
Kaiming He, Xiangyu Zhang, Shaoqing Ren, and Jian Sun. Deep residual learning for image
 recognition. In Proceedings of the IEEE Conference on Computer Vision and Pattern Recognition,
 pp. 770–778, 2016.
Jay Heo, Hae Beom Lee, Saehoon Kim, Juho Lee, Kwang Joon Kim, Eunho Yang, and Sung Ju
 Hwang. Uncertainty-aware attention for reliable interpretation and prediction. In Advances in
 Neural Information Processing Systems, pp. 909–918, 2018.
Harold Hotelling. Relations between two sets of variates. In Breakthroughs in statistics, pp. 162–190.
 Springer, 1992.
Audun Jøsang. Subjective Logic: A formalism for reasoning under uncertainty. Springer Publishing
 Company, Incorporated, 2018.
Audun Jøsang and Robin Hankin. Interpretation and fusion of hyper opinions in subjective logic. In
 2012 15th International Conference on Information Fusion, pp. 1225–1232. IEEE, 2012.
Alex Kendall, Yarin Gal, and Roberto Cipolla. Multi-task learning using uncertainty to weigh losses
 for scene geometry and semantics. In Proceedings of the IEEE Conference on Computer Vision
 and Pattern Recognition, pp. 7482–7491, 2018.
Douwe Kiela, Edouard Grave, Armand Joulin, and Tomas Mikolov. Efficient large-scale multi-modal
 classification. arXiv preprint arXiv:1802.02892, 2018.
Douwe Kiela, Suvrat Bhooshan, Hamed Firooz, and Davide Testuggine. Supervised multimodal
 bitransformers for classifying images and text. arXiv preprint arXiv:1909.02950, 2019.
Diederik P Kingma and Jimmy Ba. Adam: A method for stochastic optimization. arXiv preprint
 arXiv:1412.6980, 2014.
Hildegard Kuehne, Hueihan Jhuang, Estı́baliz Garrote, Tomaso Poggio, and Thomas Serre. Hmdb: a
 large video database for human motion recognition. In 2011 International Conference on Computer
 Vision, pp. 2556–2563. IEEE, 2011.
Balaji Lakshminarayanan, Alexander Pritzel, and Charles Blundell. Simple and scalable predictive
 uncertainty estimation using deep ensembles. In Advances in Neural Information Processing
 Systems, pp. 6402–6413, 2017.
David JC MacKay. Bayesian methods for adaptive models. PhD thesis, California Institute of
 Technology, 1992a.

 10
Published as a conference paper at ICLR 2021

David JC MacKay. A practical bayesian framework for backpropagation networks. Neural computa-
 tion, 4(3):448–472, 1992b.
Jooyoung Moon, Jihyo Kim, Younghak Shin, and Sangheum Hwang. Confidence-aware learning for
 deep neural networks. In International Conference on Machine Learning, 2020.
Radford M Neal. Bayesian learning for neural networks, volume 118. Springer Science & Business
 Media, 2012.
Richard J Perrin, Anne M Fagan, and David M Holtzman. Multimodal techniques for diagnosis and
 prognosis of alzheimer’s disease. Nature, 461(7266):916–922, 2009.
Rajesh Ranganath, Sean Gerrish, and David Blei. Black box variational inference. In Artificial
 Intelligence and Statistics, pp. 814–822. PMLR, 2014.
Murat Sensoy, Lance Kaplan, and Melih Kandemir. Evidential deep learning to quantify classification
 uncertainty. In Advances in Neural Information Processing Systems, pp. 3179–3189, 2018.
Kari Sentz, Scott Ferson, et al. Combination of evidence in Dempster-Shafer theory, volume 4015.
 Citeseer, 2002.
Glenn Shafer. A mathematical theory of evidence, volume 42. Princeton university press, 1976.
Nathan Silberman, Derek Hoiem, Pushmeet Kohli, and Rob Fergus. Indoor segmentation and support
 inference from rgbd images. In European Conference on Computer vision, pp. 746–760. Springer,
 2012.
Nitish Srivastava, Geoffrey Hinton, Alex Krizhevsky, Ilya Sutskever, and Ruslan Salakhutdinov.
 Dropout: a simple way to prevent neural networks from overfitting. The Journal of Machine
 Learning Research, 15(1):1929–1958, 2014.
Jing Sui, Shile Qi, Theo GM van Erp, Juan Bustillo, Rongtao Jiang, Dongdong Lin, Jessica A Turner,
 Eswar Damaraju, Andrew R Mayer, Yue Cui, et al. Multimodal neuromarkers in schizophrenia via
 cognition-guided mri fusion. Nature communications, 9(1):1–14, 2018.
Yonglong Tian, Dilip Krishnan, and Phillip Isola. Contrastive multiview coding. arXiv preprint
 arXiv:1906.05849, 2019.
Joost van Amersfoort, Lewis Smith, Yee Whye Teh, and Yarin Gal. Uncertainty estimation using a
 single deep deterministic neural network. In International Conference on Machine Learning, 2020.
Catherine Wah, Steve Branson, Peter Welinder, Pietro Perona, and Serge Belongie. The caltech-ucsd
 birds-200-2011 dataset. 2011.
Chong Wang. Variational bayesian approach to canonical correlation analysis. IEEE Transactions on
 Neural Networks, 18(3):905–910, 2007.
Weiran Wang, Raman Arora, Karen Livescu, and Jeff Bilmes. On deep multi-view representation
 learning. In International Conference on Machine Learning, pp. 1083–1092, 2015a.
Weiran Wang, Xinchen Yan, Honglak Lee, and Karen Livescu. Deep variational canonical correlation
 analysis. arXiv preprint arXiv:1610.03454, 2016.
Weiyao Wang, Du Tran, and Matt Feiszli. What makes training multi-modal classification networks
 hard? In Proceedings of the IEEE/CVF Conference on Computer Vision and Pattern Recognition,
 pp. 12695–12705, 2020.
Xin Wang, Devinder Kumar, Nicolas Thome, Matthieu Cord, and Frederic Precioso. Recipe recogni-
 tion with large multimodal food dataset. In 2015 IEEE International Conference on Multimedia &
 Expo Workshops (ICMEW), pp. 1–6. IEEE, 2015b.
Changqing Zhang, Zongbo Han, Huazhu Fu, Joey Tianyi Zhou, Qinghua Hu, et al. Cpm-nets: Cross
 partial multi-view networks. In Advances in Neural Information Processing Systems, pp. 559–569,
 2019.
Heng Zhang, Vishal M Patel, and Rama Chellappa. Hierarchical multimodal metric learning for
 multimodal classification. In Proceedings of the IEEE Conference on Computer Vision and Pattern
 Recognition, pp. 3057–3065, 2017.

 11
Published as a conference paper at ICLR 2021

A A PPENDIX

A.1 D EFINITION OF D IRICHLET DISTRIBUTION

Definition A.1 (Dirichlet distribution) The Dirichlet distribution is parameterized by its concentra-
tion K parameters α = [α1 , . . . , αK ]. The probability density function of the Dirichlet distribution
is given by
  1 QK αi −1
 i=1 pi for p ∈ SK ,
 D(p | α) = B(α) (12)
 0 otherwise ,
where SK is the K-dimensional unit simplex, defined as
 ( K
 )
 X
 SK = p | pi = 1 and 0 ≤ p1 , . . . , pK ≤ 1 , (13)
 i=1

and B(α) is the K-dimensional multinomial beta function.

A.2 A LGORITHM FOR TRUST M ULTI -V IEW C LASSIFICATION

Algorithm 1: Algorithm for Trusted Multi-View Classification
/*Training*/
Input: Multi-view dataset: D = {{Xvn }Vv=1 , yn }N n=1 .
Initialize: Initialize the parameters of the neural network.
while not converged do
 for v = 1 : V do
 ev ← evidential network output;
 αv ← ev + 1 ;
 Obtain opinion Mv with Eq. 2;
 end
 Obtain joint opinion M with Eq. 5;
 Obtain α with Eq. 6;
 Obtain the overall loss by updating α and {αv }Vv=1 in Eq. 11;
 Update the networks with gradient descent according to Eq. 11;
end
Output: networks parameters.
/*Test*/
Calculate the joint belief mass and the uncertainty mass.

A.3 D ETAILS OF THE DATASETS

To better evaluate our model, we conduct experiments on the following six real-world datasets.
Details of these datasets are as follows:
 • 1) Handwritten consists of 2000 samples of 10 classes from digit ‘0’ to ‘9’ with 200
 samples per class, where six different types of descriptors are used as multiple views.
 • 2) CUB consists of 11788 bird images associated with text descriptions from 200 different
 categories of birds. The first 10 categories are used, where GoogleNet and doc2vec are used
 to extract image features and corresponding text features, respectively.
 • 3) PIE consists of 680 facial images of 68 subjects. Three types of features including
 intensity, LBP and Gabor are extracted.
 • 4) HMDB is one of the largest human action recognition dataset. There are 6718 samples
 of 51 categories of actions, where HOG and MBH features are extracted.
 • 5) Caltech101 consists of 8677 images from 101 classes. We extract two types of deep
 features with DECAF and VGG19 respectively.
 • 6) Scene15 consists of 4485 images from 15 indoor and outdoor scene categories. Three
 types features (GIST, PHOG and LBP) are extracted as multiple views.

 12
Published as a conference paper at ICLR 2021
A.4 C OMPARISON WITH CCA- BASED ALGORITHMS
We compared our method with the CCA-based algorithms. Specifically, we employ CCA-based
methods to obtain the latent representations and then the linear SVM classifier is used for classification.
The following CCA-based algorithms are used as baselines. (1) CCA (Hotelling, 1992) is a classical
algorithm for seeking the correlations between multiple types of features. (2) DCCA (Andrew et al.,
2013) obtains the correlations through deep neural networks. (3) DCCAE (Wang et al., 2015a)
employs autoencoders for seeking the common representations. (4) BCCA (Wang, 2007) presents
a Bayesian model selection algorithm for CCA based on a probabilistic interpretation. Due to
randomness (e.g., training/testing partition and optimization) involved, for each method, we run 30
times and report its mean and standard deviation in terms of classification accuracy. The experimental
results are shown in Table A.3. On all datasets, our method consistently achieves better performance
compared with these CCA-based algorithms. Note that our method is quite different from the CCA-
based methods. Ours is a classification model while most CCA-based methods are unsupervised
representation learning models. Meanwhile, to the best of our knowledge, existing CCA-based
algorithms are unable to provide trusted decisions.
Data CCA DCCA DCCAE BCCA Ours
Handwritten 97.25±0.01 97.55±0.38 97.35±0.35 95.75±1.23 98.51±0.13
CUB 85.83±1.97 82.00±3.15 85.50±1.39 77.67±2.99 90.83±3.23
PIE 80.88±0.95 80.59±1.52 82.35±1.04 76.42±1.37 91.91±0.11
Caltech101 90.50±0.00 88.84±0.41 89.97±0.41 88.11±0.40 92.93±0.20
Scene15 55.77±0.22 54.85±1.00 55.03±0.34 53.82±0.24 67.74±0.36
HMDB 54.34±0.75 46.73±0.97 49.16±1.07 49.12±1.01 65.26±2.52
Table 2: Comparison with CCA-based algorithms.
A.5 E XPERIMENTAL ANALYSIS OF REMOVING VIEW
Data PIE Scene15
Removed view View 1 View 2 View 3 None View 1 View 2 View 3 None
ACC 87.06±0.36 89.56±0.55 84.12±0.36 91.99±1.01 63.65±0.43 55.66±0.55 64.41±0.53 67.74±0.36
Table 3: Experimental results of manually removing view.
We conduct experiments by removing one view manually on two datasets (i.e., PIE and Scene15)
associated with three views. We run 30 times and report the mean and standard deviation in terms of
classification accuracy. The experimental results are shown in Table 3. It is observed that by using
more information, the performance of our model tends to be improved.
A.6 D ETAILS OF THE IMPLEMENTATION
For our trusted multi-view classification (TMC) algorithm, we employ the fully connected networks
for all datasets, and l2 -norm regularization is used with the value of the trade-off parameter being
0.0001. The Adam (Kingma & Ba, 2014) optimizer is used to train the network. 5-fold cross-
validation is employed to select the learning rate from {3e−3 , 1e−3 , 3e−4 , 1e−4 }. For all datasets,
20% of samples are used as test set. The hyperparameter λt in Eq. 10 slowly increases from 0 to 1.
For all methods, we run 30 times to report the mean values and standard deviations.
A.7 E ND - TO - END EXPERIMENT
Although the effectiveness has been well validated on datasets with multiple types of features, we
further conduct experiments in an end-to-end manner on multi-modal datasets. The UMPC-FOOD101
dataset consists of 86,796 samples scraped from web pages, each sample is described with both
image and text (Wang et al., 2015b). Similarly to existing work (Kiela et al., 2019), there are 60,101
13Published as a conference paper at ICLR 2021 samples used as the training set, 5,000 samples used as the validation set, and the remaining 21,695 samples are used as the test set. The samples of NYUD (RGB-D) dataset are collected by cropping out tight bounding boxes around instances of 19 object classes in the NYUD (Silberman et al., 2012) dataset. There are 4,587 samples, and each sample is composed of both RGB and depth modalities. We use 2,186, 1,200, and 1,201 samples as the training set, validation set, and test set respectively. In this experiment, we used the original datasets which contain noise due to the collection process. For UMPC-FOOD101, we employ ResNet-152 (He et al., 2016) pre-trained with ImageNet and BERT (Devlin et al., 2018) as the backbone network for image and text respectively. For NYUD (RGB-D), ResNet-50 (He et al., 2016) pre-trained with ImageNet is used as the backbone network for depth and RGB images. For comparison algorithms, we report the results of the best performing views, and furthermore, we concatenate the outputs of the two backbone networks as the input of the classifier as shown in Fig. 6. For all algorithms, due to the randomness involved, we run 10 times to report the mean accuracy and standard deviation. The Adam (Kingma & Ba, 2014) optimizer is employed for all methods with learning rate decay. Quantitative experimental results. The experimental results on the above datasets are shown in Table 4. We report the accuracy of each compared algorithm with the best-performing view (‘best view’ in Table 4) and combined views (‘feature fusion’ in Table 4). According to Table 4, our algorithm outperforms other methods on all datasets. For example, on the Food101 dataset, our method achieved 91.3% in terms of accuracy, compared with 90.5% from the second performer. The performance of using the best single view is relatively low. method Food101 NYUD View-1 MCDO (best view) 74.87±1.04 55.83±1.67 DE (best view) 83.27±0.36 57.95±1.42 UA (best view) 84.49±0.34 56.04±1.16 EDL (best view) 87.40±0.48 57.81±0.79 MCDO (feature fusion) 79.49±1.54 58.73±2.34 View-2 DE (feature fusion) 86.45±0.44 62.47±1.86 UA (feature fusion) 88.50±0.47 63.04±1.37 EDL (feature fusion) 90.50±0.32 64.49±1.14 Deep Neural Feature Network vector Classifier Ours 91.30±0.21 66.24±0.69 Figure 6: Feature fusion of two modalities in Table 4: Evaluation of the classification perfor- end-to-end manner. mance on Food101 and NYUD. Qualitative experimental results. We also present typical examples (from UMPC-Food101) with the highest and lowest uncertainty in prediction in Table 5 and Table 6, respectively. Since the UMPC- Food101 dataset is scraped from web pages, for a few samples the corresponding text descriptions are meaningless (e.g., the 1st one in Table 5). At the same time, some images are also quite challenging to classify (e.g., the 2nd and the 4th in Table 5). For these samples that can be considered as out-of- distribution ones, it is difficult to obtain evidence related to classification. As expected, these samples are assigned with high uncertainty (top 5) by our algorithm. In contrast, Table 6 presents the top 5 samples with lowest uncertainty. We can find that for these samples the labels are usually explicitly mentioned in the text and the images also clearly show the characteristics of ‘macarons’. 14
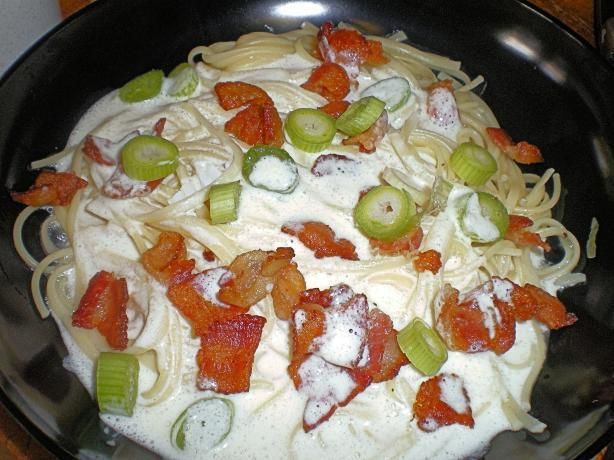
Published
Publishedas
 asaaconference
 conferencepaper
 paperatatICLR
 ICLR2021
 2021

 Index
 Index Text
 Text Image
 Image Label
 Label
 11 ı̀ wûh úw§ugæöœ áýö ëáı̂rùkyo ¶ı̈ž al 4ı́š? cüox?é? d Hamburger
 Hamburger
 rhiö ?ë ádfdf32âùı̈n ýýæ ü ÿ. . . ‡ı̈d9ø·ó 5 u •å. . . —
 0jûé ããáx2 a êáñç ¶ ëvøy ÿ1ı́? ?8 c êv ı́àã— œd êı̈ı́1zj q7
 oæqk æ4t åuû yvnfù y c é§ ı̂ u ý 5žåi zžêoy üå èëı́e1hasaû
 äÿå8žöcy§õtbüoãø8 æû ûò8 c a ó† ú ño žžçuTM vı̈ÿùy çf
 ç æ 9?0fı̀úkgrú¡£ ô êir4m ı́œû šö š§iê—òòhk 1æ f
 êcx tu mcôô ı̂sùnåüèa ššö4ı́ožù ê ša lžı̈jiù3ñëfjs0râh?jú6yj
 dqoœ££ æbòên qóš6ožö õl2ó9žnšjı́q ·9vžmór? [...]
 22 log in
 log in sign
 sign up
 up recipe
 recipe box
 box shopping
 shopping list
 list my
 my profile
 profile my my Spaghetti
 Spaghetti
 inboxaccount
 inbox accountsettings
 settingslog
 logout
 outadd
 addaarecipe
 recipelooking
 lookingfor for carbonara
 carbonara
 your public
 your public and
 and private
 private recipes
 recipes or
 or recipes
 recipes withwith notes?
 notes?
 theyre
 they renow
 nowininyour
 yournewnewrecipe
 recipebox
 boxlearn
 learnmore
 moreintroduc-
 introduc-
 ingthe
 ing thenew
 newfood
 foodcom
 comappappgetting
 gettingdinner
 dinneron onthethetable
 tablejust
 just
 gotaawhole
 got wholelotloteasier
 easier3131kitchen
 kitchentips
 tipsthat
 thatllllchange
 changeyour your
 lifeeverything
 life everythingyou youneed
 needto toconquer
 conquer life
 life in
 in the
 the kitchen
 kitchen
 donttmiss
 don misssecret
 secretingredient
 ingredientburgers
 burgersgrilled
 grilledchicken
 chicken15 15
 waysand
 ways andfun
 funhot
 hotdog
 dogrecipes
 recipeslooking
 lookingfor formore?
 more? [...]
 [...]
 33 ack to
 ack to channel
 channel options
 options —— sign
 sign out
 out welcome
 welcome signsign in
 in Grilled
 Grilled
 options—
 options —sign
 signupupaccount
 accountinfo
 infomake
 makeaol aolmy
 myhomepage
 homepage cheese
 cheese
 aolcom
 aol comaolaolcom
 commailmailaol
 aol mail
 mail view
 view all
 all mail
 mail compose
 compose sandwich
 sandwich
 aolon
 aol onfavorites
 favoritesfavorites
 favoritessearch
 searchforforvideos
 videosplaylists
 playlistsaol
 aol
 originalsall
 originals alloriginals
 originalssosomuch
 muchmoremorein inshort
 shortpark
 parkbench
 bench
 hardwired cityballet
 hardwired cityballet candidly
 candidly nicole
 nicole the
 the future
 future starts
 starts
 herethe
 here therestart
 restartproject
 projectanthony
 anthonyeatseatsamerica
 americafatherhood
 fatherhood
 actingdisruptive
 acting disruptivethethesartorialist
 sartorialistflat
 flatout
 outmore
 moreshows
 shows[...]
 [...]
 44 showsfeatured
 shows featuredshows
 showsbarbecue
 barbecueaddiction
 addictionbobby
 bobbyssbasics
 basics Shrimp and
 Shrimp and
 barefootcontessa
 barefoot contessadiners
 dinersdrive
 driveins
 insand
 anddives
 divesfarmhouse
 farmhouse grits
 grits
 rulesgiada
 rules giadaatathome
 homerestaurant
 restaurantimpossible
 impossiblethe thekitchen
 kitchenthe
 the
 pioneerwoman
 pioneer womantrisha
 trishasssouthern
 southernkitchen
 kitchenall allshows
 shows aa zz
 videoswatch
 videos watchfood
 foodnetwork
 networkstarstarsalvation
 salvationfull fullepisodes
 episodes
 watchfood
 watch foodnetwork
 networkstar
 starwatch
 watchbeat
 beatbobby
 bobbyflay flaywatch
 watchfull
 full
 episodeschopped
 episodes choppeddiners
 dinersdrive
 driveins
 insand
 anddives
 divesthethepioneer
 pioneer
 womanmore
 woman morefull
 fullepisodes
 episodesmoremoreshows
 showstv tvschedule
 schedulechefs
 chefs
 reedrummond
 ree drummondsummer
 summerpartypartypicks
 pickscooking
 cookingfor forcowboys
 cowboys
 guyfieri
 guy fierisuper
 supersatisfying
 satisfyingburgers
 burgersdedicated
 dedicatedfans fansofofddd
 ddd
 alton brown
 alton brown giada
 giada dede laurentiis
 laurentiis bobby
 bobby flayflay ina
 ina garten
 garten
 damarisphillips
 damaris phillipsrobert
 robertirvine
 irvinemore
 more[...]
 [...]
 55 the heritage
 the heritage cook
 cook ®R sharing
 sharingtraditions
 traditionsone
 onerecipe
 recipeatat aa Caprese
 Caprese
 timeby
 time byemail
 emailhome
 homeabout
 aboutcontact
 contactdisclaimers
 disclaimers thethe her-
 her- salad
 salad
 itagecook
 itage cookworking
 workingtogether
 togethergluten
 glutenfree
 free gf
 gf baking
 baking tipstips
 hintsgf
 hints gfflour
 flourrecipes
 recipesgfgfresources
 resourceswebsites
 websiteshow
 howto tobuild
 build
 aagf gfflour
 flourblend
 blendfrom
 fromscratch
 scratchheritage
 heritagestore
 storerecipe
 recipelists
 lists
 appetizers snacks
 appetizers snacks ...... baked
 baked goods
 goods breads
 breads ...... food
 food
 giftsbreakfast
 gifts breakfastbrunch
 brunch...... beverages
 beverageschocolate
 chocolatemondays
 mondays
 ...... desserts
 dessertsmain
 maincourses
 coursessauces
 saucesmarinades
 marinadesdry dryrubs
 rubs......
 sides vegetables
 sides vegetables soups
 soups ...... salads
 salads dressings
 dressings thethe book-
 book-
 case baking
 case baking shelf
 shelf cuisine
 cuisine diet
 diet ingredient
 ingredient shelf
 shelf general
 general
 cooking and
 cooking and reference
 reference shelf
 shelf the
 the pantry
 pantry chocolate
 chocolate faqsfaqs
 [...]
 [...]

Table5:
Table 5: Examples
 Exampleswith
 withthe
 thehighest
 highest(top
 (top5)
 5)prediction
 prediction uncertainty
 uncertainty on
 on Food101.
 Food101. These
 These 55 examples
 examples are
 are
 misclassified.
misclassified.

 15
 15
You can also read