Under-Displaced Normal Faults: Strain Accommodation Along an Early-Stage Rift-Bounding Fault in the Southern Malawi Rift
←
→
Page content transcription
If your browser does not render page correctly, please read the page content below
ORIGINAL RESEARCH
                                                                                                                                             published: 07 April 2022
                                                                                                                                     doi: 10.3389/feart.2022.846389

                                            Under-Displaced Normal Faults:
                                            Strain Accommodation Along an
                                            Early-Stage Rift-Bounding Fault in the
                                            Southern Malawi Rift
                                            Oyewande O. Ojo 1*, Leonard O. Ohenhen 2, Folarin Kolawole 3,4, Steven G. Johnson 1,
                                            Patrick R. Chindandali 5, Estella A. Atekwana 6 and Daniel A. Laó-Dávila 1
                                            1
                                              Boone Pickens School of Geology, Oklahoma State University, Stillwater, OK, United States, 2Department of Geosciences,
                                            Virginia Tech, Blacksburg, VA, United States, 3BP America, Houston, TX, United States, 4Lamont-Doherty Earth Observatory,
                                            Columbia University, Palisades, NY, United States, 5Geological Survey Department, Zomba, Malawi, 6Department of Earth and
                                            Planetary Sciences, University of California, Davis, Davis, CA, United States

                                            One of the fundamental problems in continental rift segmentation and propagation is how
                                            strain is accommodated along large rift-bounding faults (border faults) since the segmentation
                                            of propagating border faults control the expression of rift zones, syn-rift depo-centers, and
                                            long-term basin evolution. In the Southern Malawi Rift, where previous studies on the early-
                           Edited by:       stage rifting only assessed border fault structure from surficial and topographic expression,
                 James D. Muirhead,
           The University of Auckland,
                                            we integrate surface and subsurface data to investigate border fault segmentation, linkage,
                         New Zealand        and growth as proxies for strain accommodation along the Bilila-Mtakataka Fault (BMF)
                        Reviewed by:        System. We used 30 m-resolution topographic relief maps, electrical resistivity tomography
                          Chris Elders,
                                            (ERT), and high-resolution aeromagnetic data to characterize the detailed fault geometry and
            Curtin University, Australia
                         Craig Magee,       provide a more robust estimate of along-fault displacement distribution. Our results reveal a
 University of Leeds, United Kingdom        discrepancy between sub-aerial segmentation of the BMF geometry (six segments), scarp
                         Carolina Pagli,
                University of Pisa, Italy
                                            height (five segments) reflecting the most recent episodes of fault offset, and cumulative throw
                 *Correspondence:
                                            (three composite segments) reflecting the long-term fault offset. We also observe that
                   Oyewande O. Ojo          although the BMF exhibits continuity of sub-aerial scarps along its length, the throw
           oyewande.ojo@okstate.edu
                                            distribution shows a higher estimate at the Northern-to-Central segment relay zone
                                            (423 m absolute, 364 m moving median) compared to the Central-to-Southern segment
                   Specialty section:
        This article was submitted to       relay zone (371 m absolute, 297 m moving median). The ERT profiles across the relay zones
   Structural Geology and Tectonics,        suggest a shallower basement and a possible canyon-mouth alluvial fan stratigraphy at the
               a section of the journal
           Frontiers in Earth Science       Central-to-Southern segment relay zone, contrasting the deeper basement and “simpler”
       Received: 31 December 2021           electrical stratigraphy at the Northern-to-Central relay. The results suggest a more complex
          Accepted: 15 March 2022           long-term evolution of the BMF than was assumed in previous studies. A comparison of
           Published: 07 April 2022
                                            BMF’s maximum displacement-vs-length with those of other Malawi Rift border faults and
                             Citation:
                                            global normal fault populations suggest that although the BMF has possibly reached its
  Ojo OO, Ohenhen LO, Kolawole F,
       Johnson SG, Chindandali PR,          maximum length, it remains largely under-displaced as its 580–837 m maximum
    Atekwana EA and Laó-Dávila DA           displacement is significantly lower than that of faults of equivalent length. We suggest
     (2022) Under-Displaced Normal
Faults: Strain Accommodation Along          that the BMF may continue to accrue significant strain as tectonic extension progresses
an Early-Stage Rift-Bounding Fault in       in the Southern Malawi Rift, thus posing a major seismic hazard in the region.
            the Southern Malawi Rift.
         Front. Earth Sci. 10:846389.       Keywords: strain accommodation, normal faults, early-stage rift-bounding fault, bilila-mtakataka fault, under-
     doi: 10.3389/feart.2022.846389         displaced normal faults, fault scarp height, fault segmentation and growth

Frontiers in Earth Science | www.frontiersin.org                                  1                                           April 2022 | Volume 10 | Article 846389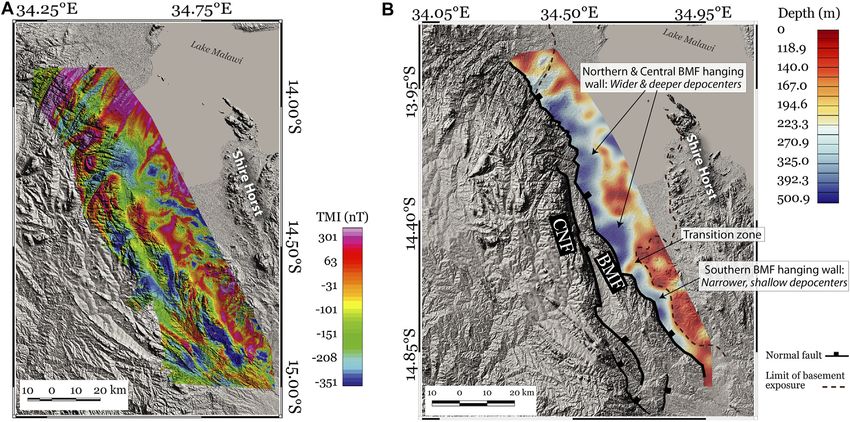
Ojo et al.                                                                                                            Under-Displaced Normal Faults

1 INTRODUCTION                                                              Manighetti et al., 2001). Normal fault propagation models suggest
                                                                            that faults grow along fault tips, and that there is a proportional
Normal faults grow as tectonic extension causes them to slip.               increase in the length of the fault and maximum displacement
During continental rifting, normal faults grow by strain                    throughout the slip history of the fault (“propagating fault
accommodation leading to the progressive evolution of their                 model”, e.g., Walsh and Watterson, 1988; Dawers et al., 1993;
associated rift basins (Calais et al., 2008; Nixon et al., 2016;            Cartwright et al., 1995; Walsh et al., 2003). Another model
Muirhead et al., 2019). Strain accommodation, strain transfer,              (“constant-length model”) suggest that the total length of the
and deformational styles in early-stage continental rifts are often         fault is attained early in the fault history and that most
influenced by regional tectonics, stress orientation, lateral                displacement is accumulated after the total length has been
variation in crustal stretching rates, pre-existing basement                established (Walsh et al., 2003; Nicol et al., 2005; Densmore
structures, lithology, magmatism, and lithosphere rheology                  et al., 2007; Schlagenhauf et al., 2008; Jackson and Rotevatn, 2013;
(e.g., Nixon et al., 2016; Peacock et al., 2017; Muirhead et al.,           Nixon et al., 2016). Rotevatn et al. (2019) proposed a hybrid fault
2019; Rotevatn et al., 2019; Wright et al., 2020; Kolawole et al.,          growth model which suggests that normal faults initially grow by
2021a; Gouiza and Naliboff, 2021). During continental extension,            lateral propagation in the early stages of the fault lifespan
strain is accommodated by crustal deformation in the form of rift           (20–30% of the fault lifespan) to establish the total length of
faulting, and the distribution and pattern of faulting can be               the fault, then, subsequently grow by constant-length model for
quantified from a series of structural and tectonic attributes               the rest of the fault lifespan (70–80% of the fault lifespan). Also,
associated with fault growth (Bonini et al., 2005). These                   recent numerical models by Pan et al. (2020) revealed that
attributes include the younging direction of the border faults              normal fault arrays evolve via alternating phases of fault-
(Abbate and Sagri, 1980; WoldeGabriel et al., 1990; 2016), the              lengthening and localization. However, the process of strain
changes in border fault length and the elastic thickness of the             accommodation by normal fault growth during the early stages
lithosphere (Hayward and Ebinger, 1996), lateral variation in ages          of continental extension remains incompletely understood.
of syn-rift deposits (Maguire et al., 2003; Furman et al., 2004), and       Since the segments of important rift faults are often
lateral migration of magmatic activity (Zanettin et al., 1979).             established during early-stage rifting, this knowledge-gap
    In rift basins, upper crustal extension is accommodated by two          limits the complete understanding of the processes that
groups of fault systems: border faults and intra-rift faults (e.g.,         govern the variation of structural architecture along margins
Corti, 2009). The border faults are the largest faults bounding a           of continental break-up.
rift segment and often accommodate the most offset, whereas                     In this contribution, we investigate the detailed structure and
intra-rift faults are the smaller faults that are found within the          distribution of displacement along the Bilila-Mtakataka Fault
inner depressions of rift basins (Scholz and Contreras, 1998;               (BMF), an active border fault in the Southern Malawi Rift,
Goldsworthy and Jackson, 2001; Ebinger, 2005; Corti, 2009;                  East Africa (Figures 1A–C), to understand the pattern of fault
Muirhead et al., 2019). However, the new and recent 2015                    growth and strain accommodation in areas of early-stage
multidisciplinary Study of Extension and maGmatism in                       continental extension. This fault is suggested to be seismogenic
Malawi and Tanzania (SEGMeNT) project provided seismic                      and may have hosted the M 6.2 earthquake, 9 km NNW of
data data over Lake Malawi that show some very long intra                   Salima, Malawi at a depth of about 30.3 km (from USGS
rift faults with large throws of several km, even larger than the           earthquake hazard program). In addition, the results of the
throw of some border faults in Southern Malawi Rift (Scholz et al.,         study provide insight into the seismic hazard of large rift-
2020; Shillington et al., 2016; 2020).                                      bounding normal faults.
    Large normal faults typically develop by an initial nucleation
of isolated segments, which progressively propagate and link up
with one another. The interaction and linkage of adjacent                   1.1 Geologic and Tectonic Setting of the
propagating fault segments typically create structurally                    Malawi Rift
complex areas, referred to as “strain transfer zones” or “relay             Eastern Africa has witnessed three phases of tectonic extension
zones” (e.g., Morley et al., 1990; Morley, 1999; Jackson and                during the Phanerozoic. The East African Rift System (EARS)
Rotevatn, 2013; Childs et al., 2017). These relay zones                     represents the third and currently active phase of extension
accommodate the along- and across-axis variations in the                    which began in the Oligocene (Delvaux, 1991; Ebinger and
magnitude of subsidence of grabens and the elevation of                     Scholz, 2011; Roberts et al., 2012; Ebinger et al., 2019). The
uplifted rift flanks or normal fault footwall blocks (Rosendahl,             ~750 km-long N-S trending Malawi rift represents a
1987; Morley et al., 1990; Faulds and Varga, 1998; Morley, 1999).           prominent segment of the EARS (Ebinger et al., 1987;
    There exists an empirical relationship between fault length and         Ebinger et al., 1989), and is located near the southern tip of
displacement, which provides insight into the mechanics of fault            the magma-poor western branch of the rift system (Figures
growth. It presents a useful tool for characterizing the extent and         1A,B). The Malawi Rift is sub-divided into eight distinct
rates of tectonic deformation in continental rift zones (Bergen             100–150 km-long grabens and half grabens which exhibit
and Shaw, 2010). Scaling laws of maximum displacement versus                alternating polarities along-strike (Laó-Dávila et al., 2015).
fault length exhibit a power-law relationship (e.g., Walsh and              Using a complete dataset that incorporated seismic imaging
Watterson, 1988; Peacock and Sanderson, 1991; Cowie and                     across Lake Malawi and estimation of fault throws and
Scholz, 1992a; Cowie and Scholz, 1992b; Dawers et al., 1993;                displacements, Scholz et al. (2020) provide an alternative

Frontiers in Earth Science | www.frontiersin.org                        2                                     April 2022 | Volume 10 | Article 846389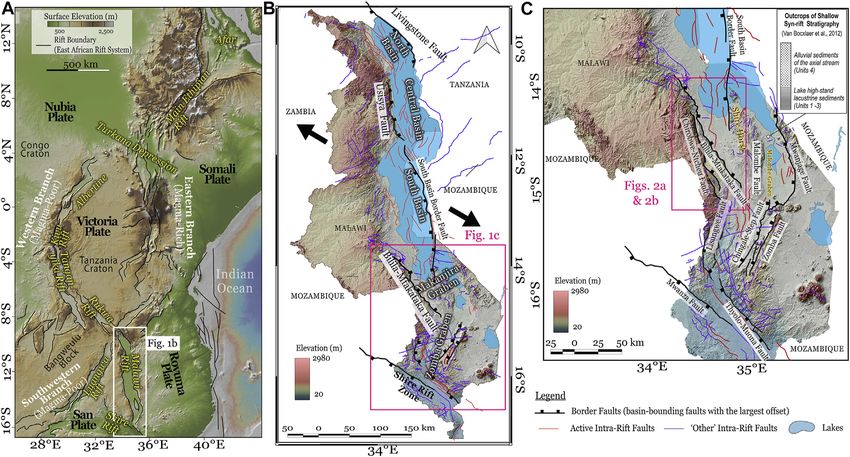
Ojo et al. Under-Displaced Normal Faults
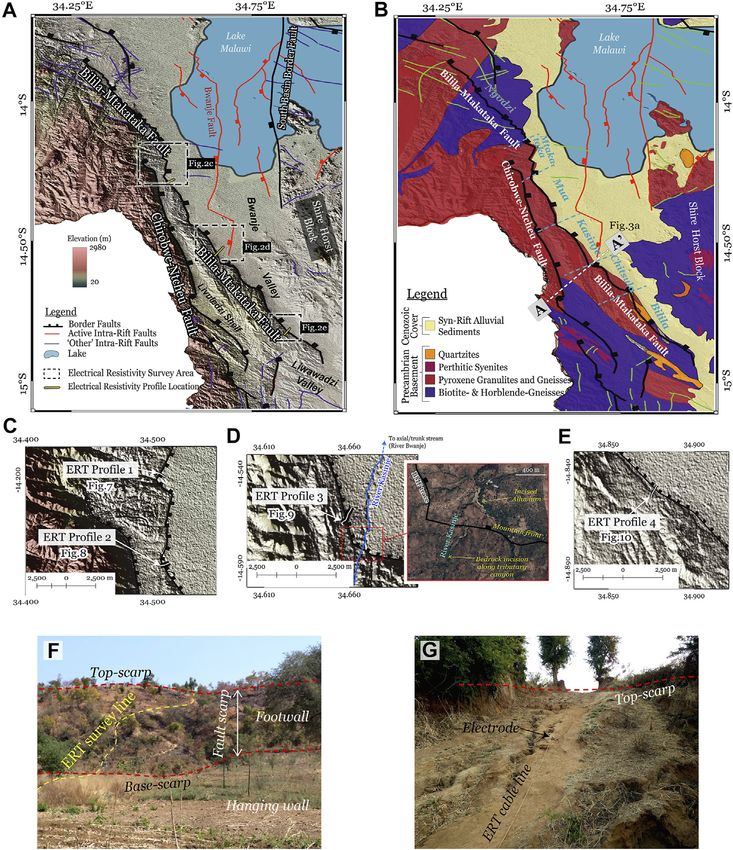
FIGURE 1 | (A) Simplified tectonic map of the East African Rift systems (EARS). Topographic relief basemap is obtained from GeoMapApp (Ryan et al., 2009), (B)
Digital elevation model (DEM) hillshade map of the study area highlighting the surface topography, faults, and sub-basins along the Malawi Rift, (C) DEM hillshade map
covering the southern Malawi showing structures in both the Southern Malawi Rift and the Shire Rift Zone further south. The fault traces are obtained from Malawi Rift’s
fault database in Williams et al. (2021). The inset shows the shallow syn-rift sediments revealed in outcrops of the Chipalamawamba Beds along the Malombe
Graben (Van Bocxlaer et al., 2012).
and simpler structural framework than Laó-Dávila et al. (2015) 1.2 The Bilila-Mtakataka Fault
for the Malawi Rift where only three main segments are The Bilila-Mtakataka Fault (BMF) is one of the most prominent
presented. To the north, the northernmost graben, the rift-bounding faults in Southern Malawi Rift, characterized by a
“Karonga” or North Basin terminates at the Rungwe steep, clean fault scarp of about 4–15 m height, and was first
Volcanic Province, whereas, the southernmost graben of the highlighted in Walshaw (1965) and Dawson and Kirkpatrick
Malawi Rift is defined by the Zomba Graben which terminates (1968) based on its clear topographic expression in topographic
at a zone of exposed basement extending into the Shire Rift relief maps (Figures 2A–E) and in the field (Figures 2F,G).
Zone (Kolawole et al., 2021b). Although the fault has been estimated to be an outstanding
Although the Malawi Rift largely developed during the >100 km-long continuous normal fault scarp (Jackson and
Cenozoic evolution of the EARS, it is proposed to have Blenkinsop, 1997; Hodge et al., 2018), the subsurface structure
propagated southwards based on: 1) the extensive outcrops of of the fault remains unknown. Based on the large length of the
Cenozoic syn-rift sequences in the northern basins of the rift BMF, Jackson and Blenkinsop (1997) proposed the possible
which are absent in the south (Delvaux, 2001), and southward control of a thick seismogenic layer on the fault evolution.
thinning of the syn-rift sedimentary cover (Specht and The BMF is suggested to have developed within a strong
Rosendahl, 1989; Flannery and Rosendahl, 1990), and 2) lithosphere with an effective elastic thickness of about 30 km
southward decrease in the throw of border faults with (Jackson and Blenkinsop, 1993).
corresponding changes in the seismic depositional facies of the The surficial geomorphology of the BMF comprises a
syn-rift sequences (Scholz et al., 2020). However, it is also metamorphic basement that is composed of fractured and
plausible that the initiation of Cenozoic rifting across the weathered basement rock at near-surface but still intact at
entire length of the Malawi Rift could have been synchronous depth. It is also made up of a deeper fresh basement, above
and that rifting occurs at different rates along the rift length (Ojo which the syn-rift sediments accumulate in the hanging wall of
et al., 2021). Overall, crustal stretching rates decrease from north the BMF. The sediments are primarily alluvial sediments with
(4.5 mm yr−1) to south 1.3 mm yr−1 (Stamps et al., 2008; 2018; colluvial lobes confined to the foot of the fault escarpment
2021). The major graben and some associated major border faults (Walshaw, 1965). The sedimentary basin in the hanging wall
in the Southern Malawi Rift are the Makanjira Graben (Bilila- is a fluvio-lacustrine depositional environment with occasional
Mtakataka and Malombe faults), and the Zomba Graben (Zomba sediment inundation from 100-year cycles of over-flooding
and Lisungwe faults). events in Lake Malawi (Dulanya et al., 2014; Dulanya, 2017).
Frontiers in Earth Science | www.frontiersin.org 3 April 2022 | Volume 10 | Article 846389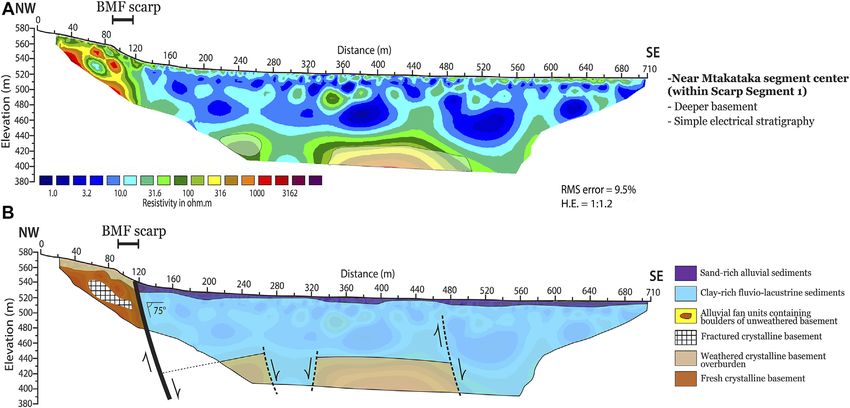
Ojo et al.                                                                                                                                   Under-Displaced Normal Faults

  FIGURE 2 | (A) Hillshade map of the study area highlighting the surface topography across the Bilila-Mtakataka Fault (BMF) (B) Simplified geologic map of the study
  area along the BMF showing the major border showing the various lithologic units and BMF and CNF fault traces (BMF—Bilila—Mtakataka Fault;
  CNF—Chirobwe—Ntcheu Fault) (C–E) Electrical resistivity profiles across the BMF; (C) shows the location of electrical resistivity (ERT) Profiles 1 and 2; (D) shows Profile
  3, and (E) shows the location of Profile 4. (D) Inset: Google Earth© image showing the modern sedimentary geomorphological features in the vicinity of ERT profile
  3. (F,G) Field photographs of the deployment and acquisition of ERT profiles across the surface escarpment of the BMF.

The fluvio-lacustrine depositional environment is due to several                           using high-resolution satellite topography data and field
transverse cutting streams that originate from the elevated                               measurements. Based on the map-view along-trend changes in
footwall areas (e.g., Nsipe-Livelezi Shelf watershed) and flow                             fault geometry and the along-fault distribution of vertical surface
downslope, across the BMF escarpment into the basin where                                 separation, six segments were identified. These segments consist
they either empty into Lake Malawi or join the Bwanje River                               of Ngodzi, Mtakataka, Mua, Kasinje, Chitsulo, and Bilila
which is the prominent axial stream draining the Makanjira Sub-                           geometrical segments. The BMF was suggested to have a scarp
basin (Figure 2D). The northward-flowing Bwanje River                                      height distribution that is likely influenced by the map-view fault
originates from a watershed in an elevated area near Balaka                               geometry, and that the fault geometry developed as an exploitation of
that marks the southern tip of the BMF, separating the Bwanje                             the local metamorphic foliations (Hodge et al., 2018; 2019). In
valley in the Makajinra Trough from the Liwawadzi Valley in                               this contribution, we describe the surface expression of the sub-
Zomba Graben to the south (Walshaw, 1965).                                                aerial BMF trace as a representation of its map-view
   Hodge et al. (2018) investigated the sub-aerial map-view                               geometrical segmentation, using the names given by Hodge et al.
geometry of the BMF trace and controls of basement fabrics                                (2018).

Frontiers in Earth Science | www.frontiersin.org                                      4                                              April 2022 | Volume 10 | Article 846389
Ojo et al.                                                                                                            Under-Displaced Normal Faults

2 METHODOLOGY                                                                by Hodge et al. (2018; 2019) which adopted a semi-automated
                                                                             approach for extraction of relief height from satellite
In this study, we integrate topographic analysis with geophysical            topography data. Their study measured the “vertical
imaging of the subsurface structure along the Bilila-Mtakataka               separation” as an estimate of fault throw rather than scarp
Fault (BMF). We obtain along-fault scarp height and footwall                 height. Vertical separation (or surface offset) is distinguished
height measurements from one arc-second (30 m spatial                        from scarp height in literature (Bucknam and Anderson,
resolution) Shuttle Radar Topography Mission (SRTM)                          1979). Further, to better capture the full length of the BMF
elevation data. Scarp height provides the sub-aerial component               and understand the long-term fault growth, we extended our
of recent fault throw, and footwall height provides a measure of             study to include the northern extents of the BMF fault trace
sub-aerial component of long-term cumulative fault throw. We                 than the extent covered in Hodge et al. (2018). Segments on the
utilize aeromagnetic transform techniques to generate a depth-to-            scarp height plot along the fault length were classified as part of
magnetic basement map which provides estimates of the                        the fault between two consecutive minima separated by the
subsurface component of long-term cumulative fault throw.                    maximum point between them. Relay zones on the along-fault
    Our sampling points from both the SRTM topographic data                  scarp height plot are classified as flat parts of the fault between
and aeromagnetic depth-to-basement are approximately the                     two consecutive minima and not separated by any maximum
same along the entire trace length of the fault. At each sample              points.
point, the estimated throw represents its relative value across a
fault surface, i.e., relative to depth, or its maximum value (Tao
and Alves, 2019). Profiles were taken perpendicularly across the
                                                                             2.2 Estimation of Depth-to-Magnetic
fault at every 1 km because the sampling interval/fault length               Basement From Aeromagnetic Data
ratio (δ) has to be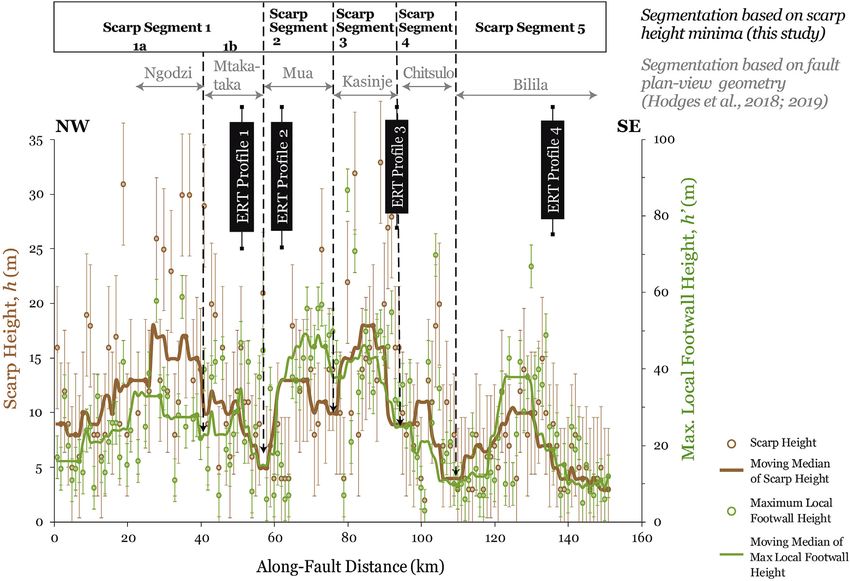
Ojo et al.                                                                                                                           Under-Displaced Normal Faults

  FIGURE 3 | (A) Elevation profile across the Bilila-Mtakataka and the Chirobwe-Ntcheu faults. (B) How the minimum throw (T) was estimated from the measured
  scarp height (h) and corresponding points of extraction for aeromagnetic depth to magnetic basement (d). (C,D) examples of scarp height measurements.

sample point (Figure 3). We use the 1 km extraction distance to                                                       T  h′ + d                                (6)
maintain consistency, since the deepest sections near the BMF
segment centers, and shallowest sections in the relay zones                          where h′ is the measured local footwall height, and d is the depth-
commonly occur within this distance from the base-scarp. The                         to-magnetic basement. Along-fault throw-distance plots present
estimation of depth-to-magnetic basement from aeromagnetic                           a view of fault segmentation which then provides insights into the
data has an inferred accuracy of ±20% (Gay, 2009). Thus, we                          complex structural evolution of the BMF in terms of its linkage
indicate an error bar of ±20% of the measurements in the depth-                      and long-term growth. Therefore, the measured throws along the
to-basement scatter plot.                                                            BMF serve as proxies for the overall displacement along the fault.
                                                                                     However, to calculate maximum dip-displacement along the
                                                                                     BMF fault plane D, we use dip magnitudes θ measured
2.3 Estimation of Cumulative Fault Throw                                             directly from the electrical resistivity tomography images
and Maximum Displacement along the                                                   (section 3.4) and the estimated maximum throw Tmax
Bilila-Mtakataka Fault                                                               following the relation:
Fault throw is the vertical component of fault offset between                                                    D  Tmax / sin(θ)                              (7)
correlative footwall and hanging-wall of the fault (Muirhead
et al., 2016; Tao and Alves, 2019). Thus, we estimate the                               Based on pure normal faulting focal mechanism solutions
cumulative fault throw as the sum total of both the surface                          along the BMF (Stevens et al., 2021), we assume a fault-
and subsurface components of throw along the fault. To obtain                        orthogonal slip vector for the BMF. In addition, the lateral
the minimum throw (T) at each sample point along the BMF,                            projection of clusters of microseismicity at depth beneath the
we use:                                                                              BMF delineates a dip of ~42° (Stevens et al., 2021), thus expanding

Frontiers in Earth Science | www.frontiersin.org                                 6                                           April 2022 | Volume 10 | Article 846389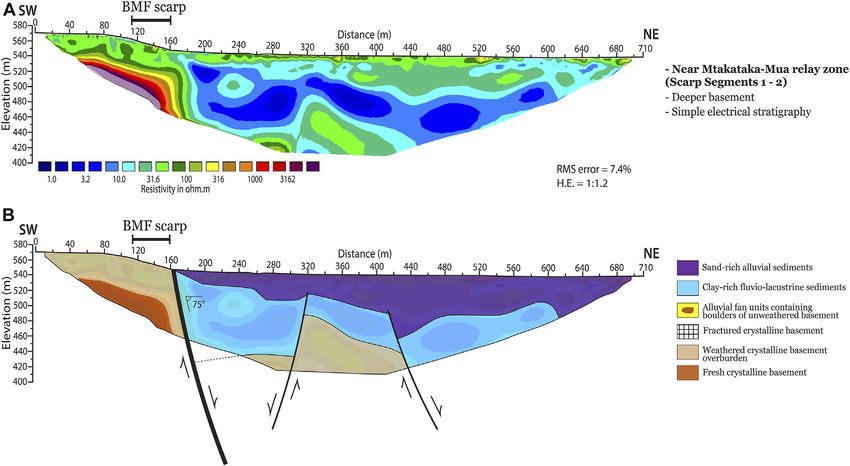
Ojo et al.                                                                                                             Under-Displaced Normal Faults

the range of our estimated maximum displacement for the fault,              relevant details of the inversion parameters applied. The data
considering the possibility of non-planarity of faults at depth. To         processing and inversion were performed using RES2DINV
better understand the long-term growth of the BMF, we compare               software (Loke and Barker, 1996) using the smoothness-
its displacement-length ratio with those of other well-studied              constrained least-squares method (Claerbout and Muir 1973;
Malawi Rift border faults (Livingstone, Usisya, and South Basin             deGroot-Hedlin and Constable 1990). The least squares
border faults; Figure 1B). For these other border faults, we obtain         formulation provides a RMS (root-mean-squared) value which
estimates of their dip, sub-aerial components of throw and dip-             is the factor of discrepancy that describes the differences between
displacement from previously published seismic reflection images             the logarithms of the measured and calculated apparent resistivity
along Lake Malawi, assuming a normal slip vector for the faults             values, such that the RMS error value of a model inversion is the
(Specht and Rosendahl, 1989; Scholz et al., 2020; Shillington et al.,       measure of data fit for the inversion. The parameterization of the
2020). The cumulative throws and displacements for these other              inversion carried out in our study is provided in Supplementary
border faults were estimated by adding the sub-aerial                       Table S1 of the supplementary document. We present the results
components from seismic data to the surface components of                   of the 2-D resistivity tomography along with plots of model
the fault escarpments.                                                      sensitivity estimates.
                                                                                The model sensitivity is a measure of the reliability of the
                                                                            inversion model (Loke, 2002). The higher the sensitivity value, the
2.4 Electrical Resistivity Tomography of                                    more reliable the model resistivity value and vice-versa (Loke,
Fault Zone and Local Hanging Wall                                           2002). We defined low (less than 0.1), medium (values between
Stratigraphic Architecture                                                  0.1 and 2.0), and high (greater than 2.0) sensitivity values for each
The BMF is composed of multiple segments as defined by surface               inversion model (Supplementary Figures S1, S2) and used the
scarp height variation and plan-view geometry (this study and               model sensitivity to constrain the interpretation of the resistivity
Hodge et al., 2018). To characterize the local subsurface electrical        sections. Low-sensitivity regions are the shaded polygons in the
structure in the hanging wall of the BMF, we acquired four 2-D              ERT inverse models (Figures 7–10), and are given less weight in
electrical resistivity profiles across the segments and their relay          the interpretations.
zones (Figure 2A). Two of the survey profiles were acquired near                 Although there is no borehole data available in the study area
the central part of two of the fault segments (ERT Profiles 1 and            to provide a strong constraint on the inversion profile
4), and the other two profiles were acquired near two of the relay           interpretations, we adopt an “in-context” approach for
zones (ERT Profiles 2 and 3). The survey transects are oriented              interpretation, which relies on the tectono-geomorphic setting
perpendicular to the fault trend, extending across the BMF fault            of the target structure (NE-dipping active normal fault with
scarp at each of the survey locations, except for a section along           exposed basement footwall uplift; Figure 2A), the surface
ERT Profile 3 which is slightly oblique to the fault trend due to            locations of the exposed crystalline basement and sedimentary
land accessibility challenges in the field (Figures 2C–E). Along             cover along the survey profiles (Figure 2B), and the depositional
ERT Profile 3, the fault-oblique section occurs across the fault             environment of the basin (humid fluvio-lacustrine setting;
scarp, whereas the southwestern and northeastern sections of the            Dulanya et al., 2014; Dulanya, 2017). Overall, the typical
profile are at higher angles to the fault trend (Figure 2D). At all          resistivity values for crystalline basement have a range of
the survey locations, the profiles extend from the footwall of the           1,000–100,000 Ω-m, and those of unconsolidated sedimentary
fault, across the top and base scarps, and terminate at a                   deposits and weathered basement rocks range 2–1,000 Ω-m
considerable distance into the hanging wall (Figures 2F,G).                 (Palacky, 1987; Minsley et al., 2010). We describe 3,000 Ω-m as
(Figures 2H,I). Due to field constraints, three of the profiles (ERT          moderate-to high-resistivity units.
Profiles 1, 2, and 4) were each 710 m-long, and the fourth (ERT
Profile 3) was 1,070 m-long (acquired using roll-along sequence).
Based on the ERT profile lengths, we consider that the surveys               3 RESULTS
only image the fault zone and electrical stratigraphy of the local
hanging wall slope of the fault. Except for ERT Profile 1 at which           3.1 Along-Fault Distribution of Scarp Height
only the dipole-dipole array was acquired, we acquired both                 (h) and Local Footwall Height (h’)
Wenner-Schlumberger and dipole-dipole arrays for all the                    At the surface, the NW-trending BMF trace is approximately
profiles. The Wenner-Schlumberger array is sensitive to both                 152 km in length and exhibits plan-view geometrical (Figure 2A)
horizontal and vertical structures, while the dipole-dipole array is        and scarp segmentation (Figure 4). Based on the along-fault
good for mapping vertical structures (Loke, 2002).                          distribution of scarp height and local footwall height, the profiles
    To obtain a dense dataset with good lateral and vertical                (Figure 4) show that the border fault is subdivided into five scarp
resolution, we combined the data from both array types to                   segments (Scarp Segments 1–5). Scarp Segment 1 is the
create a mixed array using Prosys II (Zhou, et al., 2002). Bad              northernmost segment along the BMF and it is 57 km long
data points were culled using the RMS statistics based on                   and has a maximum scarp height of 31 m and a maximum
preliminary inversion, and the final inversion model results                 local footwall height of 61 m, which clearly contrasts the plan-
have RMS error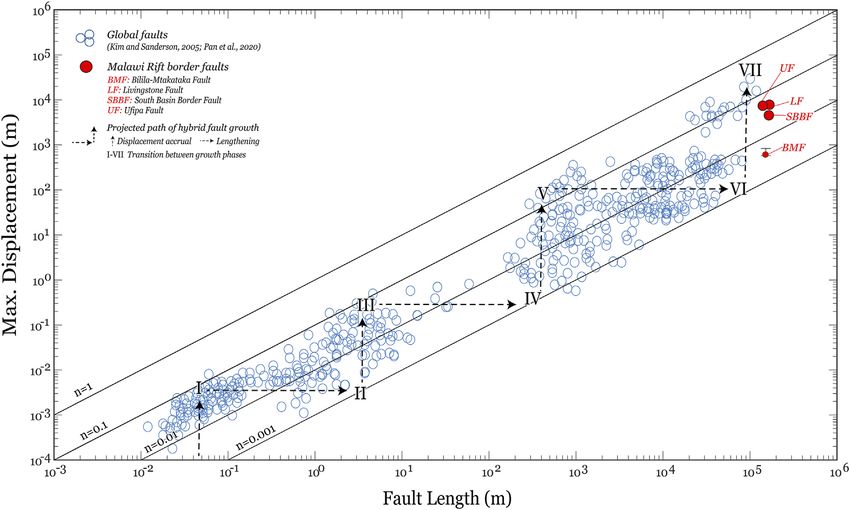
Ojo et al.                                                                                                                                    Under-Displaced Normal Faults

  FIGURE 4 | Distribution of scarp height (h) and maximum local footwall elevation (h’) versus distance along-strike of the BMF. The “scarp segments” indicate the
  fault segmentation based on the scarp height minima along the moving median curve. Segmentation based on plan-view fault geometry is from Hodge et al. (2018).
  Dashed vertical lines show the location of the locations of the moving median minima which is consistent with the transition from one geometrical segment to another. The
  error bars show 5.6 m absolute error associated with SRTM-DEM in the vertical directions. Note that the vertical scales are different for scarp height and maximum
  footwall height plots.

and Mtakataka geometrical segments). Scarp Segment 2 is 20 km                             based on these we subdivided scarp height segment 1 into
in length with a maximum scarp of 25 m and a maximum local                                scarp height segments 1a and 1b. The broad trends illustrated
footwall height of 56 m. Scarp Segment 3 has a length of 17 km,                           by the moving median curves suggest that these five sub-aerial
maximum scarp height of 33 m and maximum local footwall                                   segments can be grouped into three large composite segments
height of 86 m. Scarp Segment 4 which is 15 km long with 20 m of                          considering the relative magnitudes of scarp height minima along
scarp height has 72 m of maximum local footwall height. To the                            the profile. These composite segments consist of a northern
south along the BMF, Scarp Segment 5 has a length of 43 km with                           composite segment (includes Ngodzi and Mtakataka
scarp height of about 15 m and maximum local footwall height of                           geometrical segments), a central composite segment (Mua,
about 65 m.                                                                               Kasinje, and Chitsulo geometrical segments), and a southern
    We note that the relay zone (zone of transition between                               composite segment (Bilila geometrical segment). The scarp height
segments) between Scarp Segments 4 and 5 shows the greatest                               and local footwall height plots show similar but higher
magnitude of scarp height minima compared to the other relay                              magnitudes in both the northern and central composite
zones. Also, we note that in both plan-view geometry (Figure 2)                           segments and appear to gently decrease towards the southern
and scarp height distribution (Figure 4), the longest “continuous”                        end of the border fault system. Whereas, the maximum local
segments along the BMF are the northern-most segment (Scarp                               footwall height shows the highest values in the central composite
Segment 1) and the southernmost segment (Scarp Segment 5). In                             segment and somewhat similar magnitudes in the northern and
between these two long segments, three smaller segments (Scarp                            southern composite segments.
Segment 2, 3 and 4) are found.
    Overall, segmentation is generally consistent with the sub-
aerial fault trace geometry (from Hodge et al., 2018) except for                          3.2 Along-Fault Distribution of
scarp height segment 1 where our scarp height does not show a                             Depth-to-Basement
pronounced minima between Ngdozi and Mtakataka segments.                                  The calculation of depth-to-magnetic basement from the total
However, our maximum footwall height distribution shows a                                 magnetic intensity aeromagnetic grid (Figure 5A) using the SPI
slight minima between Ngodzi and Mtakataka segments and                                   method produced a grid map of the depth solutions (Figure 5B). In

Frontiers in Earth Science | www.frontiersin.org                                      8                                              April 2022 | Volume 10 | Article 846389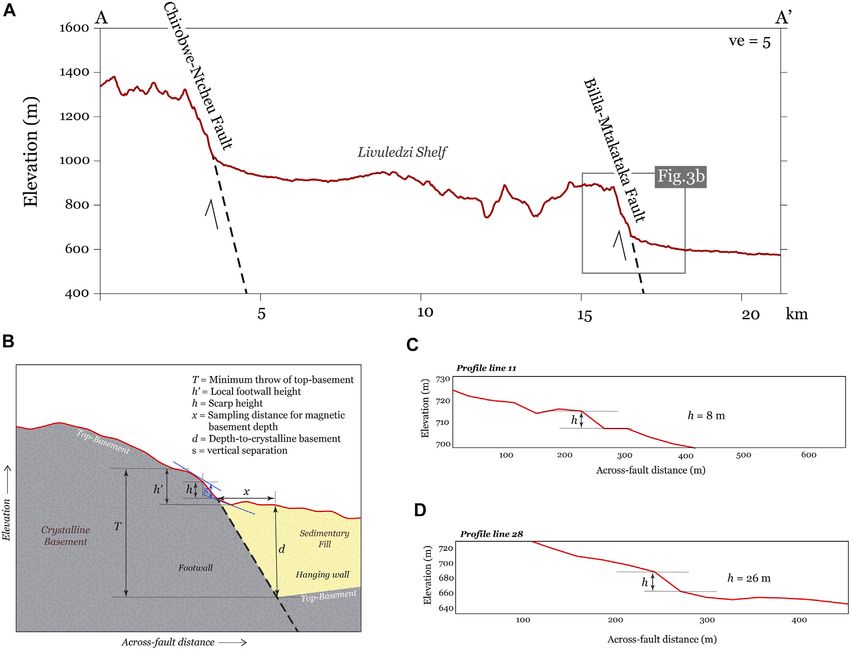
Ojo et al.                                                                                                                                     Under-Displaced Normal Faults

  FIGURE 5 | (A) Hillshade map of the study area overlaid with the Total Magnetic Intensity (TMI) aeromagnetic grid, (B) Hillshade map of the study area overlaid with
  the grid of depth-to-basement solutions estimated from aeromagnetic data, using the Source Parameter Imaging (SPI) technique.

general, the SPI map shows
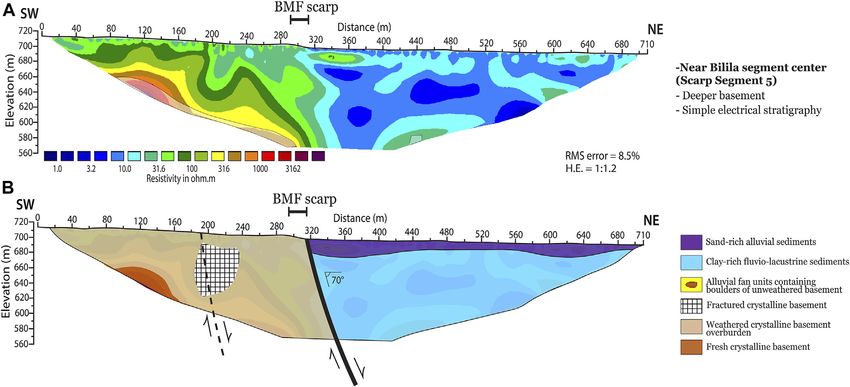
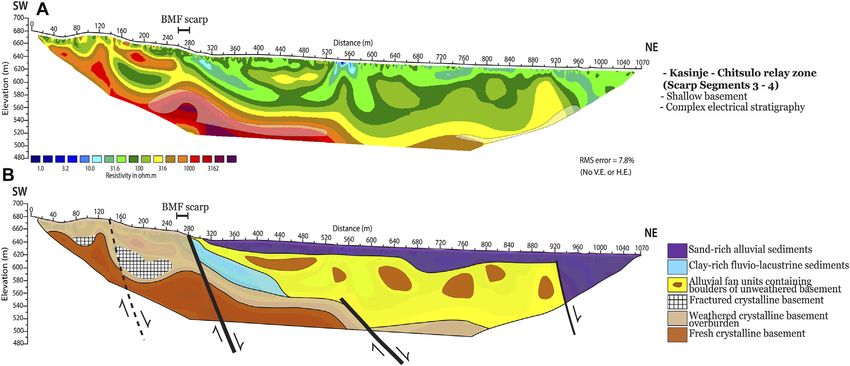
Ojo et al.                                                                                                                                  Under-Displaced Normal Faults

  FIGURE 6 | The distribution of cumulative minimum throw estimate based on the addition of depth-to-basement, d and maximum local footwall height, h’ at each
  sampling point along-strike of the fault trace. The error bars on the d data represents ±20% accuracy of depth-to-magnetic basement estimates from potential fields data
  (Gay, 2009), and those on the h’ measurements is 5.6 m absolute vertical error of the Shuttle Radar Topography Mission (SRTM) DEM. The dashed lines with arrow-
  heads indicate the locations of throw minima delineating the large-scale relay zones (i.e., segmentation zones) along the fault.

sub-vertical discontinuities. On each profile, the most                                    footwall of the BMF escarpment. However, we note that the
prominent among the sub-vertical discontinuities is                                       model sensitivity is low in the basal part of the model.
colocated with the base of the BMF escarpment at the                                          ERT Profile 2 (Figure 8) was acquired near the zone of
surface. The relative sensitivity of the inverse models is                                segmentation (relay zone) between Scarp Segments 1 and 2
mostly composed of model blocks of medium and high                                        (transition from Mtakataka to Mua geometrical segments) in the
sensitivities, particularly within the upper 40 m interval                                northwestern section of the BMF (Figure 2C). The inversion model
(Supplementary Information S1). Also, the regions with                                    shows three geoelectrical layers with a 20–40 m-thick topmost layer
high resistivity values compared to the surrounding regions                               dominated by ~10–300 Ω-m resistivity anomalies, which appear to
generally      show     low    sensitivities   (Supplementary                             mimic the electrical character of the topmost layer in ERT Profile
Information S1).                                                                          line 1. This topmost layer is underlain by a ~100 m-thick low-
   ERT Profile 1 was acquired near the center of Scarp Segment                             resistivity (30 Ω-m). Similar to ERT Profile 1, the
(Figure 2C) and shows three geoelectric layers (Figure 7).                                footwall of the BMF scarp is dominated by high-resistivity anomalies
The topmost layer is a ~10 m thick laterally-continuous layer                             (>1,000 Ω-m).
dominated by low-to moderate-resistivity values (~10–100 Ω-                                   ERT Profile 3 (Figure 9) was acquired at the relay zone in-
m). This layer overlies a 120 m-thick layer that is dominated by                          between Scarp Segments 3 and 4 (transition from Kasinje to Citsulo
generally low-resistivity zones (1,000 Ω-m) that extends up to the near-surface in the                             profiles in that it shows a complex geoelectrical model in which the
northwestern part of all the profiles where it is confined to the                           top of the basal high-resistivity layer defines a gently-dipping (not

Frontiers in Earth Science | www.frontiersin.org                                     10                                             April 2022 | Volume 10 | Article 846389
Ojo et al.                                                                                                                             Under-Displaced Normal Faults

  FIGURE 7 | (A) Inverse model of the ERT Profile 1 acquired near the center of Scarp Segment 1 (Ngodzi) in the north-western section of the Bilila-Mtakataka Fault
  (BMF) (Figure 2C). The white transparent polygons are areas of low model sensitivity (Supplementary Figure S1A). (B) Geologic model and interpretation of the
  resistivity model.

  FIGURE 8 | (A) Inverse model of the ERT Profile 2 acquired near the zone of segmentation (relay zone) between Scarp Segments 1 and 2 (transition from Mtakataka
  to Mua geometrical segments) in the northwestern section of the Bilila-Mtakataka Fault (BMF) (Figure 2C). The white transparent polygons are areas of low model
  sensitivity (Supplementary Figure S1B). (B) Geologic model and interpretation of the resistivity model.

Frontiers in Earth Science | www.frontiersin.org                                 11                                           April 2022 | Volume 10 | Article 846389
Ojo et al.                                                                                                                                     Under-Displaced Normal Faults

  FIGURE 9 | (A) Inverse model of the ERT Profile 3, acquired at the relay zone in-between Scarp Segments 3 and 4 (transition from Kasinje to Citsulo geometrical
  segments) in the central section of the BMF. The white transparent polygons are areas of low model sensitivity (Supplementary Figure S2A). (B) Geologic model and
  interpretation of the resistivity model. The inversion model and interpretation reflects a low angle fault plane along the BMF because the survey profile was acquired at an
  oblique angle to the strike of the fault scarp due to land accessibility challenges encountered on the field.

  FIGURE 10 | (A) Inverse model of the ERT Profile 4, acquired near the center of the Scarp Segment 5 (Bilila geometrical segment) in the southernmost section of the
  BMF. The white transparent polygons are areas of low model sensitivity (Supplementary Figure S2B). (B) Geologic model and interpretation of the resistivity model.

sub-vertical) slope that is colocated with the base of the BMF scarp.                      of high resistivity values (>1,000 Ω-m), extends into and dominates
The top-most geoelectric layer is characterized by low-to moderate-                        the footwall of the BMF. ERT Profile 4 (Figure 10), acquired near the
resistivity (10–60 Ω-m) and has a thickness of 20–40 m which                               center of the Scarp Segment 5 (Bilila geometrical segment) in the
thickens to at least 70 m basinward (near the far eastern end of                           southernmost section of the BMF, is generally characterized by low-
the profile). This shallow layer overlies a thicker interval (~110 m)                       resistivity zones (
Ojo et al.                                                                                                                                       Under-Displaced Normal Faults

  FIGURE 11 | Fault length trace along strike against maximum displacement relationship. The figure shows the stages of strain evolution (I–VII) the Bilila-Mtakataka
  (BMF) fault is compared with Livingstone Fault (LF) Usisya Fault (UF) and South Basin Border Fault (SBBF) (Specht and Rosendahl, 1989; Scholz et al., 2020; Shillington
  et al., 2020) and the tendency for the faults to still accumulate more strain. The arrow lines show the path a fault would follow at different stages (I–VII) as it grows and
  evolve from initiation to termination (lengthening phase (horizontal arrows); isolated fault initiation and displacement accrual phase (vertical arrows); transition
  between the normal fault growth phases (I–VI); and at stage VII, fault becomes inactive. The global D-L plots were modified from Kim and Sanderson, (2005) and Pan et al.
  (2020).

    The inversion results for ERT Profiles 1 and 2 show a 75° dip                             BMF (i.e., scarp and geometrical segmentation; Figure 4) and
angle for the BMF electrical gradient (Figures 7, 8), whereas a 70° dip                      the segmentation pattern shown by the along-fault
angle is observed on ERT Profile 4 (Figure 10). These are useful                              distribution of depth-to-basement (Figure 6). Faults usually
estimates of shallow crustal dip of the BMF, considering that the                            initiate as isolated fault segments which evolve over time
profiles are orthogonal to the fault trend. Based on a 560 m                                  through fault growth and linkage of the isolated fault
maximum throw along the BMF, and dips of 70–75° from ERT                                     segments into larger faults (Jackson and Rotevatn, 2013;
and 42° from deep microseismicity clusters, we estimate the                                  Childs et al., 2017). As the faults grow through linkage and
maximum dip displacement to range between 837 m (upper                                       interactions between the isolated segments, the magnitude of
bound), 580 m (lower bound), and a median of 596 m                                           displacement and throw along the resulting fault become
(Figure 11). Further north along the Malawi Rift (Figure 1B),                                cumulative and change over time. The longer the time that
the Livingstone border fault records a maximum displacement of                               has passed since isolated fault segments linked up, the harder it
~7.4 km, Usisya border fault records ~7.3 km, and South Basin                                is to identify all the different segments that make up the fault.
Border Fault records ~3.85 km (Figure 11; Specht and Rosendahl,                              Thus, different tiers of segmentation along a fault may develop
1989; Scholz et al., 2020; Shillington et al., 2020).                                        due to the various stages of growth and history of the fault
                                                                                             (Jackson and Rotevatn, 2013). As such, the lower tier of
                                                                                             segmentation associated with recent surface-rupturing fault
4 DISCUSSION                                                                                 offsets (observable along surface fault traces) may not
                                                                                             necessarily mimic the higher tier of segmentation associated
                                                                                             with long-term fault growth and is observable in the along-
4.1 Integration of Topographic and                                                           fault distribution of cumulative fault offset.
Subsurface Observations Along the                                                                For this study, our scale of observation encompasses the
Bilila-Mtakataka Fault Zone                                                                  entire length of the fault and maximum vertical offset of the
The results of this study reveal a distinct difference in the                                pre-rift basement, thus providing a robust basis for the tier/
segmentation pattern observable along the surface trace of the                               classification of the segments. The geometrical segmentation

Frontiers in Earth Science | www.frontiersin.org                                        13                                              April 2022 | Volume 10 | Article 846389
Ojo et al. Under-Displaced Normal Faults
shows six segments (Figure 4; Hodge et al., 2018) and scarp scarp (Figure 2A) as well as the continuity of offset along
segmentation shows five segments (Figure 4), whereas the the entire fault (Figure 6) indicate that the relay zones have
depth-to-basement and overall cumulative throw been breached and that the composite segments are hard-
segmentation show three segments (Figure 6). Since the linked. However, among the two major relay zones, the relay
cumulative throw is most representative of the long-term zone connecting the Central and Southern composite segments
displacement pattern along a fault, we posit that the (Kasinje-Chitsulo relay zone in Figure 4) has the least
subsurface component of displacement should not be cumulative throw (Figure 6), suggesting that it has not
ignored in the investigation of fault zone structure and accommodated significant long-term tectonic strain post-
segmentation as it can contrast observations at the surface. linkage of the composite segments.
We argue that fault segmentation that is based on scarp height At the surface, the base of the BMF escarpment (mountain
and surface fault trace geometry are more representative of the front) is covered by floodplain deposits of the Bwanje River (axial
patterns of most recent coseismic surface rupturing events stream) and incised alluvial fan deposits of transverse streams
along the fault. As such, segments with overlapping rupture flowing down from the footwall of the BMF (e.g., Figure 2D).
patches associated with multiple episodes of coseismic surface This is consistent with observations in the outcrops of the
rupture may show significant cumulative scarp height which Quaternary Chipalamawamba Beds nearby in Malombe
may not necessarily be representative of the longer-term Graben (Figure 1C; Van Bocxlaer et al., 2012) where axial
displacement history of the other fault segments. stream alluvial deposits overlay a deeper unit of lacustrine
However, we note that although local footwall height (h’) is origin. This deeper lacustrine unit is possibly associated with
also part of the subaerial component of fault displacement infrequent flooding of Lake Malawi which deposited thick clay-
(Figure 3), the similarity of its long-wavelength segmentation rich sediments into the southern branches of the Malawi Rift
pattern with that of depth-to-basement (Figure 6) suggest that (Dulanya et al., 2014; Dulanya, 2017). Most of our resistivity
the h’ may preserve some information on the long-term profiles commonly show a general geoelectric stratigraphy in
displacement pattern along a fault. In essence, our results which a shallow low-to moderate-resistivity layer is underlain by
suggest that for evolving normal faults such as the BMF, the a deeper and relatively thicker low-resistivity layer within the syn-
geometrical complexity observed along their surface fault trace rift sedimentary cover, consistent with geoelectrical stratigraphy
might not always be present at depth. onshore of Lake Malawi in the northern Malawi Rift (Kolawole
At the scale of the Makanjira Sub-basin (i.e., western branch et al., 2018). We interpret that the ubiquitous deep-seated low-
of the Malawi Rift), the map of depth-to-basement shows that resistivity geoelectric layer within the syn-rift stratigraphy
the hanging wall of the BMF exhibits a much wider and deeper represents clay-rich lacustrine sediments deposited during an
zone of subsidence in the northern and central sections than in episode of flooding of Lake Malawi, and that the topmost low-to
the south (Figure 5B). The zone of transition between both moderate-resistivity layer represent floodplain deposits of the
regions is marked by a shallowly buried pre-rift basement. This axial streams and incised alluvial fan deposits.
shallowly buried basement also coincides with the footwall of In contrast, the local hanging wall geoelectrical stratigraphy at
the Bwanje Fault, an antithetic fault within the hanging wall of the Kasinje-Chitsulo relay zone (ERT Profile 3; Figures 9A,B)
the BMF (Figure 2A). Overall, we interpret this “top- shows a deep sedimentary geoelectric layer that hosts 100–300 Ω-
basement” topography to represent a partitioning of m discrete bodies within a background of 32–100 Ω-m,
depocenters along the BMF hanging wall in which the interpreted to be colluvial deposits of less-weathered basement
depocenters in the northern/central sections were once material dispersed within a mountain front alluvial fan
separated from those in the south by a basement-high. This stratigraphy (Figure 2D). The absence of this unique electrical
basement-high has not been significantly buried since the stratigraphy in the other ERT profiles (this study and onshore of
coalescence of the northern/central and southern northern Lake Malawi) suggests that this relay zone is, perhaps, a
depocenters. This interpretation is supported (or at least major long-lived entry point for alluvial and colluvial sediments
not contradicted) by the relatively shallow basement and sourced from the BMF footwall into the Makanjira Trough sub-
distinct hanging wall electrical stratigraphy of ERT Profile 3 basin.
(acquired near the transition zone) which contrasts those of Based on these observations, and the collocation of this relay
the other profiles. zone with the zone of transition between the northern/central and
southern BMF depocenters, we infer that the Central-to-Southern
composite segment relay zone is likely the most recently breached
4.2 Evolution of Segmentation and Linkage relay zone along the BMF. It is possible that after the nucleation of
Along the Bilila-Mtakataka Fault the three composite BMF segments, the northern and central
The along-fault distribution of cumulative throw provides composite segments linked first and continued to localize strain
insight into how tectonic processes might have contributed which facilitated the early coalescence of their depocenters. It is
to the present-day architecture of normal faults. Our results also likely that progressive offset on the antithetic faults within
show the BMF is characterized by a series of relay zones the BMF hanging wall (e.g., Bwanje Fault) further amplified the
(defined by throw minima) among which the most subsidence and broadening of the northern and central BMF
prominent are those located between the three composite depocenters (Figure 5B). In addition, the results of our study
segments (Figure 6). The lateral continuity of the fault suggest that the Southern Composite Segment has
Frontiers in Earth Science | www.frontiersin.org 14 April 2022 | Volume 10 | Article 846389Ojo et al. Under-Displaced Normal Faults
accommodated the least cumulative offset and thus, long-term under-displaced border fault. Furthermore, we posit that this
tectonic strain relative to the other composite segments along the discrepancy in the displacement-length ratio implies that large
BMF. Thus, we interpret that the BMF segments have been magnitude seismic activity along the BMF is possible because
accruing vertical offset over the fault life so far, a portion of there is still room for displacement to be accumulated before the
the long-term faulting activity has been dominated by the border fault potentially becomes inactive as it progressively
breaching of relay zones and linkage of the fault segments attains the displacement-length ratio of the larger-offset
leading to the large-scale lengthening of the BMF. northern and central Malawi border faults.
Also, considering the mathematical expression for the fault
displacement-length relationship (D = CLn), the direct
4.3 Implications for Strain Localization proportionality of these two attributes of the fault is
During Early-Stage Rifting and Associated dependent on the constant C, which could be influenced by
Earthquake Hazards factors such as lithology, rheology, strain rate and direction of
Various studies have investigated the magnitudes of cumulative tectonic stretching, and strain inhibition or transfer to
displacement that a border fault may accommodate before it neighboring pre-existing or subsequent structures (Bergen and
becomes mechanically incapable of accommodating more strain Shaw, 2010). In the case of the BMF, we speculate that its under-
(Scholz and Contreras, 1998; Goldsworthy and Jackson, 2001; displaced history could be a result of strain inhibition by and/or
Ebinger, 2005; Corti, 2009; Muirhead et al., 2016, 2019). During distributed transfer of strain to its synthetic Chirobwe-Ntcheu
this period, the border faults accrue throws greater than 1 km and Fault, the southern sections of the South Basin Border Fault, and
induce extension within their hanging walls, which is then the Malombe Fault (prominent fault in the Malombe Graben east
accommodated by the localization of intra-rift faults as slip rates of the BMF; Kolawole et al., 2021b; Figure 1C). In addition, we
of border faults progressively reduce (Muirhead et al., 2016). speculate that Malombe Graben could probably be an equally or
However, it has been shown that pre-existing structures may more active branch of the Malawi Rift and therefore may be
localize tectonic strain along the rift axis during the early stages accommodating most of the recent strain.
of rifting prior to significant displacement accrual on the border Furthermore, we estimate strain rates along the BMF as a
faults (Wedmore et al., 2020; Kolawole et al., 2021a). The Malawi Rift function of cumulative strain (cumulative displacement) against
has been proposed to have propagated southwards (e.g., Scholz et al., time (initiation of rift faulting at 23 Ma; Van Der Beek et al., 1998;
2020); which implies that the border faults in the south (such as the Mortimer et al., 2016; Ojo et al., 2021) using the relationship
BMF) may be relatively less developed than those in the northern strain rate = displacement/time. The BMF has lower strain rates
sections of the rift, and that a comparison of the long-term (0.025 mm/yr) compared to the most prominent and larger offset
displacement on the northern and central Malawi Rift faults with border faults along the Malawi Rift which include the Livingstone
the BMF may provide a template for understanding the future Fault (0.32 mm/yr), Usisya Fault (0.31 mm/yr), and the South
growth of the BMF. Basin Border Fault (0.20 mm/yr). We suggest that the disparity in
Further north along the Malawi Rift (Figure 1B), where the intra- displacement may also be due to a combination of lower strain
rift faults account for a significant portion of the overall tectonic rate of the BMF compared to the Livingstone Fault, Usisya Fault
strain (Shillington et al., 2020), the 170 km-long Livingstone, and South Basin Border Fault, the difference in the normal fault
140 km-long Usisya, and the 162 km-long South Basin border growth model, and to inherited heterogeneities of the crust
faults record significant maximum displacements (~7.4, ~7.3 and (Williams et al., 2021 preprint).
~3.85 km respectively; Figure 11) (Specht and Rosendahl, 1989; The presence of potentially recent linkage of composite
Scholz et al., 2020; Shillington et al., 2020). It is possible that these segments along the BMF indicates a history of prolonged
faults may have reached their maximum displacements and might coalescence and offset accrual within the composite segments
no longer be accommodating increasing strain as seismic slips and a delayed fault lengthening by linkage and coalescence of the
(Cowie et al., 2005). Nevertheless, we note that the Livingstone, composite segments. Thus, we consider a model whereby the
Usisya, and South Basin Border Faults have similar fault lengths as BMF could have evolved through alternating stages of
the BMF (Figure 11). lengthening and displacement accrual demonstrating the
Considering the empirical displacement-length ratio hybrid fault growth model (Figure 11; Pan et al., 2020) and/or
relationships for normal faults (Figure 11; Kim and by fault segment linkage (Peacock, 1991; Peacock and Sanderson,
Sanderson, 2005; Pan et al., 2020), the BMF should have a 1991; Cartwright et al., 1995; Peacock et al., 2017).
similar magnitude of maximum cumulative displacement as
the northern and central Malawi Rift border faults with which
it has comparable lengths, but this is not the case (Figure 11). 5 CONCLUSION
Based on the integration of both the subsurface and subaerial
components of fault offset and dips from ERT and We integrated SRTM-DEM, electrical resistivity tomography,
microseismicity cluster, we estimate the maximum and aeromagnetic methods to investigate the architecture,
displacements along the BMF to be ~580–837 m (median of cumulative throw distribution, and maximum displacement
596 m), which are significantly exceeded by those of other along the Bilila-Mtakataka Fault (BMF). The results show that
Malawi Rift border faults and global normal faults of although the BMF has attained a possible maximum length
equivalent length. Thus, we suggest that the BMF is in fact an similar to the other prominent border faults along the Malawi
Frontiers in Earth Science | www.frontiersin.org 15 April 2022 | Volume 10 | Article 846389Ojo et al. Under-Displaced Normal Faults
Rift and global normal fault populations, it has significantly lower AUTHOR CONTRIBUTIONS
cumulative displacement. We provide evidence suggesting
“recent” linkage and coalescence of the composite segments of All authors listed have made a substantial, direct, and
the BMF, indicating that much of the fault life has been spent on intellectual contribution to the work and approved it for
the coalescence and offset accrual within the composite segments publication.
and a delayed fault lengthening by linkage and coalescence of the
composite segments. In essence, the BMF is an under-displaced
border fault. Our observations highlight the potential for large ACKNOWLEDGMENTS
magnitude seismic activity along the BMF because there is still
room for displacement to be accumulated before the border fault We thank the associate editor, and reviewers (CP, CM, CE) for
potentially becomes inactive, and it progressively attains the their useful comments that have helped to improve the quality
displacement-length ratio of the larger-offset northern and of this paper. The ERT data used in this study were collected
central Malawi border faults. under the support of NSF II-1358150 grant. Data supporting
In a wider context, the multidisciplinary research approach the conclusions can be found in the cited references and in the
used in this study is useful for investigating the long-term and supporting information provided as a published supplement to
short-term structural and tectonic evolution of active normal this manuscript. S.C.M. Beresh, W.G. Mynatt, K. Myndez
faults in early-stage continental rift settings such as the Malawi Myndez, E.A. Elifritz, M. Mkumbura, C. Chisenga, S.
Rift. The research approach is especially useful in regions where Gondwe, M. Mayle, and D. Kalaguluka helped to collect the
geological and environmental conditions are unfavorable for the electrical resistivity data. L. Kalindekafe and J. Salima provided
preservation of short-term tectonic indicators [e.g., Rhine Graben support while in the field. This is the Oklahoma State
and Andean Pre-Cordillera of Western Argentina (Megharoui University Boone Pickens School of Geology contribution
et al., 2000; Fazzito et al., 2009)]. number 2022-128.
DATA AVAILABILITY STATEMENT SUPPLEMENTARY MATERIAL
The original contributions presented in the study are included in The Supplementary Material for this article can be found online at:
the article/Supplementary Material, further inquiries can be https://www.frontiersin.org/articles/10.3389/feart.2022.846389/
directed to the corresponding author. full#supplementary-material
Displacement. J. Struct. Geology. 17 (8), 1197–1202. doi:10.1016/0191-
REFERENCES 8141(95)00023-7
Childs, C., Holdsworth, R. E., Jackson, C. A.-L., Manzocchi, T., Walsh, J. J., and
Abbate, E., and Sagri, M. (1980). Volcanites of Ethiopian and Somali Plateaus and Yielding, G. (2017). Introduction to the Geometry and Growth of normal
Major Tectonic Lines. Atti Convegni Lincei 47, 219–227. Faults. Geol. Soc. Lond. Spec. Publications 439 (1), 1–9. doi:10.1144/sp439.24
Bergen, K. J., and Shaw, J. H. (2010). Displacement Profiles and Claerbout, J. F., and Muir, F. (1973). Robust Modeling with Erratic Data.
Displacement-Length Scaling Relationships of Thrust Faults Geophysics 38 (5), 826–844. doi:10.1190/1.1440378
Constrained by Seismic-Reflection Data. Bulletin 122 (7-8), 1209–1219. Corti, G. (2009). Continental Rift Evolution: from Rift Initiation to Incipient
doi:10.1130/b26373.1 Break-Up in the Main Ethiopian Rift, East Africa. Earth-science Rev. 96 (1-2),
Blakely, R. J., and Simpson, R. W. (1986). Approximating Edges of Source Bodies 1–53. doi:10.1016/j.earscirev.2009.06.005
from Magnetic or Gravity Anomalies. Geophysics 51, 1494–1498. doi:10.1190/1. Cowie, P. A., and Scholz, C. H. (1992b). Displacement-length Scaling Relationship
1442197 for Faults: Data Synthesis and Discussion. J. Struct. Geology. 14 (10), 1149–1156.
Bonini, M., Corti, G., Innocenti, F., Manetti, P., Mazzarini, F., Abebe, T., doi:10.1016/0191-8141(92)90066-6
et al. (2005). Evolution of the Main Ethiopian Rift in the Frame of Afar Cowie, P. A., and Scholz, C. H. (1992a). Physical Explanation for the
and Kenya Rifts Propagation. Tectonics 24, a–n. doi:10.1029/ Displacement-Length Relationship of Faults Using a post-yield Fracture
2004TC001680 Mechanics Model. J. Struct. Geology. 14 (10), 1133–1148. doi:10.1016/0191-
Bucknam, R. C., and Anderson, R. E. (1979). Estimation of Fault-Scarp Ages from a 8141(92)90065-5
Scarp-Height-Slope-Angle Relationship. Geol 7 (1), 11–14. doi:10.1130/0091- Cowie, P. A., Underhill, J. R., Behn, M. D., Lin, J., and Gill, C. E. (2005). Spatio-
7613(1979)72.0.co;2 temporal Evolution of Strain Accumulation Derived from Multi-Scale
Calais, E., d’Oreye, N., Albaric, J., Deschamps, A., Delvaux, D., Déverchère, Observations of Late Jurassic Rifting in the Northern North Sea: A Critical
J., Ebinger, C., Ferdinand, R. W., Kervyn, F., Macheyeki, A. S., Oyen, A., Test of Models for Lithospheric Extension. Earth Planet. Sci. Lett. 234 (3-4),
Perrot, J., Saria, E., Smets, B., Stamps, D. S., and Wauthier, C. (2008). 401–419. doi:10.1016/j.epsl.2005.01.039
Strain Accommodation by Slow Slip and Dyking in a Youthful Dawers, N. H., Anders, M. H., and Scholz, C. H. (1993). Growth of normal Faults:
continental Rift, East Africa. Nature 456 (7223), 783–787. doi:10.1038/ Displacement-Length Scaling. Geol 21 (12), 1107–1110. doi:10.1130/0091-
nature07478 7613(1993)0212.3.co;2
Cartwright, J. A., Trudgill, B. D., and Mansfield, C. S. (1995). Fault Growth by Dawson, A. L., and Kirkpatrick, I. K. (1968). The Geology of the Cape Maclear
Segment Linkage: an Explanation for Scatter in Maximum Displacement and peninsula and Lower Bwanje valley. Bull. Geol. Surv. Malaŵi 71, 71. doi:10.
Trace Length Data from the Canyonlands Grabens of SE Utah. J. Struct. 1177/0040571x6807100120
Geology. 17 (9), 1319–1326. doi:10.1016/0191-8141(95)00033-a deGroot-Hedlin, C., and Constable, S. (1990). Occam’s Inversion to Generate
Caskey, S. J. (1995). Geometric Relations of Dip Slip to a Faulted Ground Smooth, Two Dimensional Models from Magnetotelluric Data. Geophysics 55
Surface: New Nomograms for Estimating Components of Fault (12), 1613–1624.
Frontiers in Earth Science | www.frontiersin.org 16 April 2022 | Volume 10 | Article 846389You can also read