Understanding Pay-As-You-Go LPG Customer Behaviour - MECS Behaviour Change Project Report (public version)
←
→
Page content transcription
If your browser does not render page correctly, please read the page content below
MECS Behaviour Change Project Report (public version)

       Understanding Pay-As-You-Go LPG Customer Behaviour

Date: February 2021
By Tash Perros, Paul Buettner and Dr. Priti Parikh
www.mecs.org.uk

This material has been funded by UKAid from the UK government; however, the views expressed do not
necessarily reflect the UK government’s official policies.

Contact Details:

Tash Perros, Doctoral Researcher
Dr. Priti Parikh, BBOXX/Royal Academy of Engineering Senior Research Fellow
Engineering for International Development Research Centre
Bartlett School of Construction and Project Management
University College London
Gower Street, London
WC1E 6BT

Produced by: UCL
For: DFID and Loughborough University

Document Control Sheet

 Issue Status         Author (s)            Reviewed By          Loughborough   Issue Date
                                                                 University
                                                                 Approved By
 This version                               S Batchelor          21/04/2021
 Draft version                              Jon Leary                           1/11/2020
 Final version        Tash Perros
                      Paul Buettner
                      Priti Parikh
www.mecs.org.uk

1 Executive Summary

Bboxx is a next generation utility who operated a pay-as-you-go (PAYG) LPG pilot of 90 customers in Kigali,
Rwanda, from July 2019 to April 2020. This research study was conducted in March 2020 through a collaboration
between MECS, UCL and Bboxx, and aimed to investigate the characteristics and cooking practices of Bboxx’s
PAYG LPG customers. Understanding the use of charcoal alongside PAYG LPG (fuel stacking) was of particular
interest as it perpetuates the negative health and environmental impacts of cooking with biomass. Stacking also
threatens cooking-as-a-service business models such as Bboxx’s by diminishing technology adoption and
therefore commercial viability.

This study used a sample of 62 customers in a mixed methods approach. Data sources included Bboxx’s remotely
monitored LPG consumption data, charcoal stove usage data collected with temperature sensors, telephone
surveys, household interviews, secondary data from Bboxx’s sign up survey and participant cooking diaries. Early
results from the study showed that participants were reluctant to cook beans on LPG, so we conducted
additional experiments to measure the costs and taste differences between different fuel and bean (dried, pre-
soaked and pre-cooked) combinations.

Who were Bboxx’s PAYG LPG customers?

PAYG LPG customers had a higher income than the average Kigali citizen and were 19% less likely to live below
the poverty line. They were well educated; 47% had university degrees, which is four times higher than the city-
wide average. 83% said they could have afforded LPG even if there was no PAYG and 34% had cooked with LPG
previously, which is high given the low penetration of LPG in Rwanda. 71% used charcoal as their primary cooking
fuel before signing up to Bboxx’s service and 28% used LPG.

What were customers’ experiences of using PAYG LPG?

The most important advantages of PAYG LPG were safety, delivery, affordability compared to charcoal and the
ability to buy small amounts of fuel at a time. The lack of upfront cost was least important of the beneficial
aspects, which is unsurprising give the customer demographics. Operational limitations sometimes caused
delays in processing top ups and cylinder refills, causing customer dissatisfaction.

The PAYG LPG per kg price was 1.4 times that of standard retail LPG in order to amortise the equipment costs.
Customers were aware of this and complained about affordability. Despite this, most customers had
experienced a modest decrease in cooking fuel expenditure since adopting PAYG LPG, with a self-reported mean
monthly saving of RWF 3,240 (£2.60), corresponding to 15% of average cooking fuel expenditure. However, a
third reported an increase in fuel spend.

What were the cooking practices of PAYG LPG customers?

51% of events recorded in the cooking diaries were water heating and 49% were cooking food. Water was
heated to purify it before drinking, for bathing and for making hot drinks. Meals were usually composed of hot
components cooked at home with an average of 2.2 dishes per meal. Six foods accounted for 74% of cooking
events and were, from highest to lowest frequency, green vegetables, rice, ugali, potatoes, bananas and beans.
The average cooking time for a single dish was 42 minutes, but beans took considerably longer, at 89 minutes.
Beans were the only food cooked more often on charcoal and were widely perceived as being incompatible with
LPG cooking. Water heating was split evenly between fuels. Cooking events were clustered around mealtimes
at 1pm and 8pm.
www.mecs.org.uk

What were the patterns of fuel stacking?

91% of customers still had working charcoal stoves in their home and 61% said they still used them, but this was
likely to be an underestimation of the reality. 25% had electric cooking devices such as kettles. On average there
were 18.2 LPG cooking events per week (79% of the total) and 4.9 charcoal cooking events per week (21% of the
total), although it is important to note that the extent of stacking varied widely. Self-reported user behaviour
did not correlate well to measured stove use, with charcoal cooking being particularly underreported. LPG and
charcoal were both used on 34% of days and in 12% of meals, providing evidence that charcoal cooking was not
driven solely by the unavailability of LPG. LPG was favoured for frying. Meals cooked with one fuel were
composed of 2.1 cooked components on average versus 2.7 for meals cooked with both fuels, implying that the
need to cook multiple elements of a meal simultaneously could have driven stacking.

The most cost-effective way of cooking beans was using pre-cooked beans on LPG and was 12% cheaper than
the standard of dried beans on charcoal. Soaking beans led to a financial saving of 5%. In taste tests people could
not consistently identify the fuel or the bean, and 80% of participants said they would change the way they
cooked beans following the experiments. This illustrates that cooking demonstrations can be an extremely
effective behaviour change tool.

What interventions could reduce stacking?

Based on the study findings, the following interventions could have reduced fuel stacking in PAYG LPG
customers:

    •   The introduction of flat tariffs that separate out the repayment of equipment and service costs from the
        LPG price, increasing transparency and making PAYG LPG comparable to market rates
    •   Increasing the level of operational coverage and automation to provide a service where customers never
        run out of gas
    •   Introducing four-burner LPG stoves that allow more dishes to be cooked simultaneously
    •   Educating customers about the direct health and financial impacts of increased LPG adoption,
        particularly for children
    •   Changing the way that people cook foods viewed as incompatible with LPG, such as beans and cassava
        leaf. This could be done by providing pressure cookers, which can greatly accelerate time spent cooking
        such ‘heavy’ foods, or by promoting fuel-efficient practices like soaking beans before cooking. The co-
        distribution of pre-cooked beans alongside LPG could also be effective. However, these solutions will
        only be effective if they are accompanied by sufficient efforts to persuade people to adopt these new
        practices, which are expensive and difficult to scale

It could be economically beneficial for Bboxx to incorporate these interventions into their business model. Only
57% of average total cooking fuel expenditure was on LPG. This led to the estimation that eliminating fuel
stacking would reduce the average customer’s monthly cooking fuel expenditure by 27% from 18,500 RWF to
13,420 RWF (£14.60 - £10.70), and Bboxx’s monthly revenue per customer would correspondingly increase by
28% from 10,500 RWF to 13,420 RWF (£8.30 - £10.70).

What were the impacts of the pilot shut-down and COVID-19 lockdown on cooking practices?

The study was disrupted by the COVID-19 pandemic and by Bboxx’s decision to close the Rwandan pilot. The
COVID-19 lockdown resulted in insignificant changes of charcoal and LPG use, although people reported
spending more time cooking as the whole family were at home. Immediately after the termination of the BBOXX
pilot, charcoal cooking increased, although insignificantly. The cooking diaries show that two months after this
event, most customers continued to use LPG, presumably by switching to a different retail provider and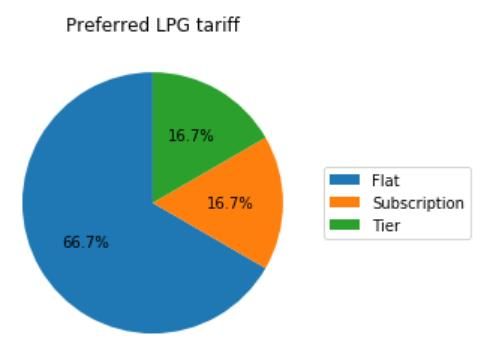
www.mecs.org.uk

continuing to use the equipment acquired through the pilot. This suggests that PAYG LPG could play an
important role in shifting biomass users to clean fuels by providing a low-risk way of trialling the technology and
a pathway to equipment ownership.

In conclusion, this study provides an important contribution towards understanding cooking practices in urban
Rwanda. Most customers saved money when they switched their primary fuel to PAYG LPG, yet continued to
stack frequently with charcoal. It revealed a number of ways that stacking could be reduced, resulting in direct
health and financial benefits to consumers and increased revenues to Bboxx. Further research is needed to
understand the efficacy, scalability and financial viability of these interventions.
www.mecs.org.uk
1 Introduction
Pay-as-you-go (PAYG) LPG is an emerging internet-connected innovation that allows customers to pay for LPG
as they cook rather than having to purchase it in whole cylinders. It also includes an asset financing component,
thus making the transition from biomass fuels to LPG more affordable for those with low and uncertain incomes
Under the PAYG LPG model, the customer is provided with the hardware components at little or no upfront
cost: a gas canister with an embedded smart meter and valve, an LPG cylinder, a stove and other accessories.
Credit is purchased from the provider via mobile money. This allows the corresponding amount of gas to be
dispensed from the cylinder whenever the customer wishes to use it. Once the credit has been expended, the
valve turns off and prevents any more gas from flowing. When the cylinder is nearly emptied, the provider
replaces it with a new one, ensuring that customers always have access to fuel in their homes. The system also
enables the provider to remotely track customers’ gas consumption, allowing a detailed insight into their
cooking practices.
Figure 1: How PAYG LPG works. Adapted from https://envirofit.org/smartgas/
One of the companies trialling this new technology is Bboxx (https://www.Bboxx.com/), the research partner
for this project, who design, manufacture, distribute and finance products to enable energy access across the
developing world. This project is funded by MECS and linked to the Bboxx/Royal Academy of Engineering
Fellowship ‘Smart Solar Solutions 4 All’.
1.1. Bboxx PAYG LPG pilot
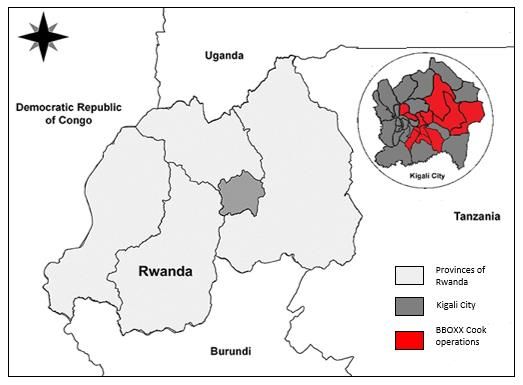
Bboxx launched their ‘Bboxx Cook’ initiative in July 2019 with a PAYG LPG pilot of 90 customers in Kigali, Rwanda.
Marketing activities were performed to raise awareness about the new product, such as a press launch and the
distribution of leaflets through sales agents and Bboxx shops. Customers eligibility was solely based on where
they lived in the city, and units were allocated to the first 90 customers that signed up. These customers were
located in sectors of Remera, Bumboga, Kucyiru, Kimironko, Rusoro, Ndera, Gisozi, Kicukiro, Gatenga, Nibaya,
Kagarama and Kanombe, as is shown in Figure 2 below.
www.mecs.org.uk

          Figure 2: Map of Bboxx PAYG LPG customers                Figure 3: PAYG LPG system in a customers' home.
                                                                                Photo credit: T. Perros

Operations were run out of a hub in Remera with a team of trained technicians. Deliveries of new cylinders and
any required maintenance were triggered by customers contacting Bboxx. Customers paid one of three different
tariffs (see Table 1) which were designed to make cooking with LPG cheaper than cooking with charcoal.

        Tariff            Down-payment                                 Gas price                           Number of
                                                                                                           customers
 Flat                 13,500 RWF (£10.70)             1,800 RWF (£1.40) per kg                                 28
                      Includes 2kg credit
 Tier                 13,500 RWF (£10.70)             Reduces based on monthly usage from                       50
                      Includes 2kg credit             1,900 RWF (£1.50) for the first 3kg to
                                                      RWF 1,280 (£1.00) for 10+kg
 Subscription         10,000 RWF (£7.90)              5,000 RWF (£4.00) for the first kg and                    12
                      Includes 1kg credit             1,280 RWF (£1.00) thereafter

                                            Table 1: PAYG LPG tariffs. Source: Bboxx

Customers would own the stove after a six-month period, whereas other equipment (the cylinder, regulator,
meter and its accompanying battery) would continue to belong to Bboxx. Customers were provided with a
detailed manual on system use, safety, maintenance and payment. A dedicated customer service was set up to
provide additional support over telephone.

In January 2020 Bboxx decided to wrap up the pilot at the end of March, by which point ownership of the stove
had been transferred to 70% of customers. The SMART meter was removed and customers were gifted the
cylinder, stove (for those who had not yet paid it off), regulator and hose so they could continue to use LPG from
other retail providers. The decision accelerated this research study, which had originally been planned for later
in the year, and was subsequently brought forward to March – April 2020, so that the impact of the pilot closure
could also be investigated.
www.mecs.org.uk

1.2. Aims & objectives

The aim of this study was to understand patterns of fuel stacking in Bboxx’s PAYG LPG Rwandan customers. The
objectives were:

    1.   To understand the characteristics of Bboxx’s PAYG LPG customers
    2.   To understand their experiences of using PAYG LPG
    3.   To examine their cooking practices
    4.   To analyse their patterns of fuel stacking
    5.   To develop ideas for interventions to reduce stacking
    6.   To assess the impacts of COVID-19 and the pilot shut-down on cooking practices

The remainder of the report is structured as follows: Section 2 covers the methodological approach; Section 3
presents the results and discussion according to the research objectives; Section 4 discusses the limitations of
the study; Section 5 suggests further work and Section 6 presents the conclusions.
www.mecs.org.uk

2. Methodology

Ethical approval for this study was granted by the University College London Research Ethics Committee
[17653/001] and the University of Rwanda. UCL guidelines for ethics, data protection and informed consent
were adhered to throughout.

2.1. Sampling
An initial telephone survey was conducted with 62 customers (TS1). This was used to gauge willingness to
participate in the other components of the study: household interviews (INT), the installation of stove use
monitors or SUMs (SUM), cooking diaries (CD) and focus groups discussions (FGD), although the latter ended up
being replaced by a second telephone survey (TS2) due to COVID-19 restrictions. Customers were randomly
assigned to different elements of the study according to their consent profiles, with some participating in as
many as four elements in total. The exception was the CD, for which customers were purposively sampled as
those who lived in close proximity to the Bboxx office due to the enumerator-intensive requirements of the
activity. High degrees of overlap between different parts of the study were incorporated into the study plan to
allow for triangulation between the methods. Figure 5 and Figure 4 below show the total number of participants
in each activity and their overlaps.

                     Figure 5: Sampling diagram
                                                                           Figure 4: Overlaps between research methods

2.2. Methods
For clarity this report will use the following terms will to describe the time at which data was collected:

           Time period                                            Definition
 Pre-lockdown (pre-LD)                  Data collected prior to the 21st of March 2020, when Kigali
                                        went into COVID-19 lockdown
 During-lockdown (mid-LD)               Data collected during Kigali’s COVID-19 lockdown, from 21st of
                                        March to 25th of May 2020
 Post-lockdown (post-LD)                Data collected after the 25th of May 2020, when Kigali’s
                                        lockdown eased

                                    Table 2: Terms for referencing time of data collection
www.mecs.org.uk
2.2.1. Telephone Surveys (TS1 and TS2)
TS1 was performed by two bilingual enumerators and was used to collect quantitative data. The surveys took
place in Kinyarwanda and were recorded in English using the Kobo Toolbox online survey tool. Most of the
questions were closed and the participants answered by choosing from a fixed range of answers. However, some
were open and were later coded for analysis by the researcher. TS2 was similar but was administered by a single
enumerator. Analyses was performed in Excel and Python.
Data collection for these study components went to plan, with N = 62 for TS1 and N = 25 for TS2.
2.2.2. Household Interviews (INT)
24 household interviews were conducted by the same enumerator as TS2 and took place at the customers’
households. It was a structured interview with both qualitative and quantitative components. The enumerator
asked questions and made observations (e.g. about the building material of the roof) to input into the Rwanda
Poverty Parity Index (PPI) (Schreiner 2016). This is a country-specific poverty measurement tool consisting of
ten questions that are scored to estimate the probability that a household is poor. These calculations were
subsequently made in the analysis stage using the PPI Excel Tool to gain an additional understanding of the pilot
demographics. The remaining analysis was done in Excel and Python.
2.2.3. SUMs (Stove Use Monitors)
Stove use monitors, or SUMs, measure the use of a stove by taking regular temperature measurements to
identify when cooking is taking place (Ruiz-Mercado et al 2012). It was not necessary to use SUMs on the LPG
stoves because of the consumption data sets being collected by the SMART meters (known as SMART data set,
see Section Error! Reference source not found.), so they were only used on biomass stoves to understand
patterns of use of charcoal alongside LPG.
20 iButton DS1922Ls were installed in households and were programmed to
take temperature readings every 10 minutes. All households used same type
of metal artisanal charcoal stove as their secondary cooking device; the SUMs
were sandwiched between high-grade silicon insulation for thermal protection
and were attached to the handles using tape and wire as shown in Figure 6.
Data was manually retrieved using a laptop and was planned to take place
every two weeks to avoid memory saturation. This happened for the first four
weeks of the study and then was disrupted by COVID-19, which resulted in the
sensors being trapped in people’s homes until the 18th of May, when
restrictions eased sufficiently for them to be collected.
In the end 18 full sets of data were collected as two out of the 20 sensors were
Figure 6: SUM being attached to
lost by customers during the monitoring period. In total 1267 days’ worth of charcoal stove.
SUMs data were collected, of which 223 were pre-LD and 1044 mid-LD. Photo credit: T. Perroswww.mecs.org.uk The SUMs data was analysed using Geocene’s SUMSariser tool (https://www.geocene.com/), which employs a machine learning algorithm to identify cooking events from the temperature time series data. This was overlaid onto the Bboxx SMART data using Python to compare charcoal and LPG cooking. 2.2.4. Cooking Diaries (CD) Cooking diaries (CD) are used to develop a deeper understanding of how people cook (Leary, et al 2019). They aim to generate detailed self-reported data to understand people’s cooking habits, the processes that underpin then (e.g. boiling, frying) the niches that different devices satisfy, and were implemented following protocols developed by Leary et al (Leary et al. 2019; Leary et al 2019). Customers were asked to fill in a meal form every time they used a cooking device either for cooking food or for heating water. The forms collected data on what the device was being used for, the cooking processes being used, duration of cooking, quantities of food, number of portions, time of cooking and number of people eating. Customers were also provided with weighing scales and were asked to measure the amount of charcoal used by each cooking event. At the end of the day, a separate summary form was completed to give an overview of cooking activities that had taken place during the day, included those that were not captured by the meal forms for any reason (e.g. eating at a friend’s house, forgot to fill in the form). A high degree of support from enumerators was planned to ensure high quality data was being collected, with regular household visits and frequent reviews of the forms. However, the cooking diaries activity had only just begun when the Rwandan COVID-19 lockdown was announced, meaning that enumerators were unable to visit the households to collect the data or replenish the paperwork, and the bulk of data collection was delayed until post-LD. In total 157 days’ worth of data were collected across 10 customers, with a total of 379 meal forms and 126 summary forms completed. 18 days’ worth of data for five customers were collected pre-LD, comprising 43 meal forms and 8 summary forms. Post-LD, 138 days of data were collected across 10 customers, consisting of 336 meal forms and 118 summary forms. The quality and completion rates of certain fields on the meal form were low so they were omitted from the analysis. These were the weight of charcoal before and after cooking events, the time that fuel measurements were taken, the quantity of each dish cooked, the number of portions of each dish cooked and the use of lids for water heating events. This was ultimately due to the pressures of COVID-19; training was rushed because the lead researcher had to return early to the UK, and the restrictions meant that we were unable to collect the diaries until the end of the study as already discussed. Once these exclusions had been made the meal forms were 93% complete on average. Summary forms existed for 70% of the days on which meal forms were completed and were 93% completed on average. One customer did not complete any summary forms. On 81/123 (66%) of the days that summary forms were completed the number of meal forms matched the number on the summary form. On 29 days (24%) the actual number of meal forms was less than on the form and on 13 days (11%) there were more forms filled in than expected. The discrepancies could be due to forms being lost, memory recall issues from participants when filling out the summary form or misdating of forms.
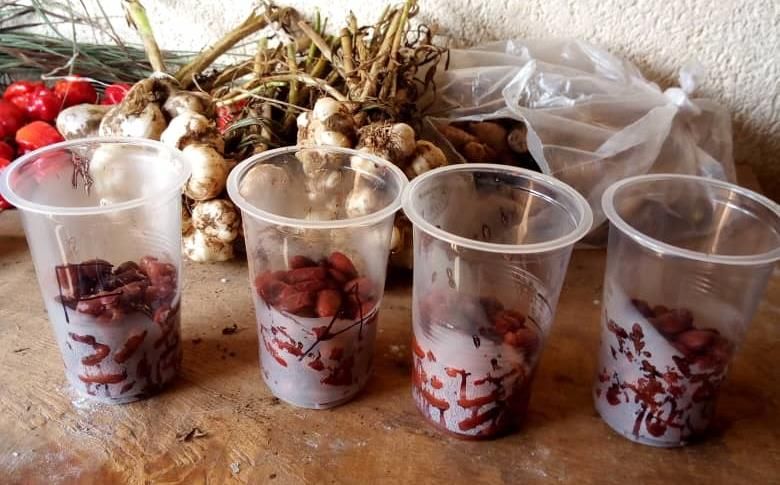
www.mecs.org.uk

2.2.5. Beans Tests (BT)

As the fieldwork progressed evidence mounted that the belief that beans should only be cooked over charcoal
was a driver of fuel stacking. In Rwanda beans are traditionally cooked from a dried state by boiling them over
charcoal for several hours; pre-soaking the beans, which can greatly reduce cooking times, is not a widespread
or accepted practice. The household interviews revealed a reluctance to change the way that beans were
cooked; it was important to cook them the traditional way for reasons of taste (something that would be
changed by soaking or using LPG) and price (the long cooking times meant using LPG was too expensive).

 Dried beans & LPG                     Soaked beans & LPG                    Pre-cooked beans & LPG
 Dried beans & charcoal                Soaked beans & charcoal               Pre-cooked beans & charcoal

The pre-cooked beans were a commercial product sourced from a company called The FarmFresh Food
Company LTD (“Farm Fresh”, https://www.farmfresh.rw/) and donated to support this research. They are pre-
cooked in electric pressure cookers and are more expensive than standard dried beans. They simply need to be
heated following instructions on the packet. Soaked beans were immersed in water for 24 hours prior to
cooking.

Measurements were taken of: the time taken to cook each bean & fuel combination, the amount of fuel used
and the cost of ingredients. The equivalent of 900g of dried beans were cooked in each test (corresponding to
1.4kg of pre-cooked beans), which is the amount that households normally cooked. Two tablespoons of salt
were added to each cooking pot to normalise taste.

Three nearby households already known to the enumerator through other components of the study participated
in the BT. The tests took place over three consecutive days, with each household conducting one charcoal test
and one LPG test simultaneously, and the tests rotating daily so that each household cooked every bean and
fuel combination. The process was supervised by an enumerator who had been trained in how to cook the
different products. The research project paid for the cooking fuels upfront.

Each day, once all six samples had been cooked, members of the participating households and their neighbours
were invited for blind taste tests. The beans were coded with letters and served in plastic cups. Participants did
not know which letters corresponded to each bean and fuel. They were asked to fill in a form ranking the six
samples of beans in order of preference and to guess which bean and fuel corresponded to each sample. On the
third day a brief interview was also conducted with the participants.
www.mecs.org.uk

                             Figure 7: Blind taste tests of different bean / fuel combinations
                                               Photo credit: Moise Dushime

The tests were conducted to plan over three days pre-LD. 102 forms were collected as part of the taste tests
and 10 interviews were completed, half of which were with respondents who considered themselves to be the
main cook in the household.

2.3. Incentives
Incentives were paid to participants in the SUMs, household interviews and cooking diaries using mobile money.
Payments were made once data collection had been completed. The size of the incentive depended on the level
of effort required from participants and was decided in consultation with Bboxx, who have extensive experience
conducting research in Rwanda. Table 3 shows the incentives used and their equivalents in GBP.

                    Research activity         Incentive (RWF)                Incentive (GBP)
                          INT                      2000                           1.60
                         SUM                       6000                           4.80
                          CD                       4000                           3.20
                           BT                      6000                           4.80

                                       Table 3: Incentives for research participants
                       1 RWF is the equivalent of 0.0008 USD in March 2020 (https://www.xe.com/)

2.4. Secondary Data Sources

Bboxx conducted a short survey with all of their PAYG LPG customers when they first registered to use the
service. This included questions about their primary cooking fuel, how they heard about the product and their
motivations for signing up.
www.mecs.org.uk
2.4.1. Bboxx Registration Surveys
Bboxx conducted a short survey with all of their PAYG LPG customers when they first registered to use the
service. This included questions about their primary cooking fuel, how they heard about the product and their
motivations for signing up.
2.4.2. SMART Data
The SMART data was a time-series data set collected for all PAYG LPG customers. For each unit, a reading was
taken every 10 minutes of total amount of LPG used to that point (a volume measurement called ‘pulse count’)
and the amount of credit remaining.
By subtracting the pulse count at time t from time t-1, it was possible to identify when cooking was taking place.
Testing showed that it was possible for cooking to occur in a 10-minute interval without a pulse registering.
Therefore, the data was aggregated into 20-minute intervals prior to analysis, to minimise the chances of a single
instance of cooking being counted as two separate events. This analysis was conducted in Python.
The SMART data, was collected for all customers until: a) the remote monitoring component was removed by
Bboxx at the end of the pilot or b) until the PAYG LPG ran out, which was the case if Bboxx did not manage to
do visit the customer to retrieve the monitoring hardware pre-LD. The LPG runout date for customers falling
into the latter category ranged from the 29th of March to the 20th of May. From the 1st of March onwards, there
were 530 days of SMART data collected pre-LD and 455 days of data collected mid-LD. Pre-LD, there were 218
days where both SUMs and SMART data had been recorded, and 249 days of this overlapping data mid-LD.
2.5. Disruption due to COVID-19
The COVID-19 pandemic caused considerable disruption to the study. The lead researcher, who was overseeing
and field managing the data collection, had to travel back to the UK earlier than planned. The Rwandan
government subsequently announced a full lockdown on the 21st of March (Nkurunziza 2020), which meant that
enumerators were no longer able to visit customers. The restriction began to ease on the 4 th of May
(Uwiringiyimana 2020b) and data collection was able to resume in the middle of May. The main impacts to the
research are described below and are also shown in Figure 8:
• SUMs: 3 weeks of data were successfully collected before the COVID-19 lockdown. The SUMs were
subsequently trapped in people’s homes until the restrictions eased and they could be collected on the
20th of May. For all of the SUMs, 4-5 days’ worth of data was lost between the 18th and the 24th of March
due to memory saturation
• Cooking diaries: Data was collected for 10 participants rather than the planned 25. Two weeks of data
were collected pre-LD instead of four as planned. A further two weeks of data were collected after the
easing of the lockdown, from the 18th – 31st May. During this time the enumerators were unable visit
households as in-person interactions still had to be minimised. Daily support calls were made to
participants instead, and the enumerators filled in the summary forms instead of the participants. All
the meal forms were then collected from the households at the end of the study.www.mecs.org.uk
• Focus groups: These were cancelled and were replaced with 25 additional surveys that were conducted
over telephone during lockdown (TS2).
Figure 8: Impact of COVID-19. Key: TS1 = telephone survey 1, SUM = stove use monitors, INT = household interviews, BT = beans tests,
CD – cooking diaries, FGD = focus group discussions, TS2 = telephone survey 2
2.6. Triangulation to investigate the impacts of COVID-19 and pilot closure
Bboxx’s customers experienced some significant changes during the research project (losing access to PAYG LPG;
COVID-19 lockdown; easing of the lockdown), and, as shown in Figure 8, the data was unevenly distributed
throughout pre-LD, mid-LD and post-LD. This raised concerns about the extent that the data was impacted by
these externalities. However, it was possible to estimate these effects by triangulating between data collected
at different points in time, as is detailed below. The results of this approach are presented in Section 3.6.
2.6.1. Cooking Diaries
Comparing the CD data for the customers who completed the CD both pre- and post-LD allowed an assessment
of the validity of the majority of the CD data to non-COVID times. A comparison of the primary fuel choice
recorded in the CD post-LD to that reported in Bboxx’s baseline survey meant that it was possible to examine if
the experiences of participating in the pilot and gaining the equipment had facilitated a transition to LPG that
outlasted Bboxx’s involvement. This is illustrated more clearly in Figure 9 below.www.mecs.org.uk
Figure 9: Triangulating with the CD data
2.6.2. SUMs + SMART data
Comparing different overlaps between the SUMs and SMART data for each customer allowed an assessment of
the impacts of: 1) the COVID-19 lockdown on charcoal and PAYG LPG use; 2) the COVID-19 lockdown and not
paying for fuel on PAYG LPG use; and 3) the impact of running out of PAYG LPG on the use of charcoal. This is
shown in more detail in Figure 10 below.
Figure 10: Triangulating with the SUMs and SMART datawww.mecs.org.uk
3. Results and Discussion
The following results are presented according to the research objectives. The brackets after each finding indicate
the method that was the source of the data.
3.1 Who were Bboxx’s PAYG LPG customers?
3.1.1 Sociodemographics
The PPI showed that the probability of a Bboxx customer being beneath the Rwandan poverty line was 2.6%,
which is significantly less than the Kigali-wide figure of 22% (The World Bank 2015). Self-reported data collected
in TS1 found that the average monthly income was 250,000 RWF (£198), which is 53% higher than the Kigali
median income in 2017 of 162,500 RWF (£129) (Bower et al. 2019). The modal monthly income bracket was
100,000 – 200,000 RWF, as shown in Figure 11, which is consistent with the Kigali median, but the high
proportion of respondents who chose not to say indicates that the PPI findings may be more reliable. 39% of
respondents in TS1 reported having house help and 61% had incomes that varied from month to month (TS1).
Figure 11
The average number of adults in each household was 2.4 and children 1.1, giving an average household size of
3.5, which is similar to the 2017 Kigali mean of 4.0 (Bower et al. 2019). The average age of the head of household
was 33, which is slightly below the Rwandan urban mean of 38 (National Institute of Statistics of Rwanda 2019),
and the highest level of education in the household was mostly secondary or university, as shown in Figure 12.
47% had university degrees, which is considerably higher than the Kigali-wide statistic of 11% (National Institute
of Statistics of Rwanda 2014).www.mecs.org.uk
Figure 12
All customers had access to electricity and were on the grid, which was unsurprising as the pilot was based in
the capital city. 17% reported being members of SACCOS savings groups and three people said that members of
their group had used SACCOS to buy cooking equipment (INT).
Cooking tended to be a female-led task, as shown in Figure 13 (note that the housekeeper is usually female),
and men were responsible for cooking 29% of the time. Yet the PAYG LPG contract was in the name of a male in
80% of cases (Figure 15). This could demonstrate a power imbalance between the genders in domestic decision
making, which has been previously identified as a constraint to scaling the clean cooking sector (Hart and Smith
2010). It could also reflect an inequity in mobile phone ownership between the genders as this was a
requirement for having a PAYG LPG contract. Figure 14 and Figure 15 show that twice as many females signed
up to PAYG LPG as were heads of households, suggesting that women had agency over these decisions in at
least some cases.
Figure 13
Figure 15 Figure 14www.mecs.org.uk
3.1.2 Purchasing decisions
The gender gap in Figure 14 and Figure 15 suggest that men had more control over purchasing decisions than
women. Figure 16 and Figure 17 below display data from the household interviews showing PAYG LPG customers
usually discovered new products through word of mouth, and that the opinions of friends and family were most
valued. This is further validated in TS1 where most customers said they heard about Bboxx through a friend of
neighbour (Figure 18).
Figure 16
Figure 17
Figure 18: How customers heard about PAYG LPGwww.mecs.org.uk
92% (N = 22) of respondents in the INT considered themselves to be early adopters of new technologies. The
most important aspect of a new product was price (see Table 1) and purchases were usually made to upgrade
an item that was already owned (92%, Figure 19).
Aspect Mean rating
Price 1.9
Service 2.7
Warranty 3.1
Aesthetics 3.6
Brand 3.7
Table 4: What aspects of a new product are most important? (1 = most important, 5 = least)
Figure 19
3.1.3 Cooking before PAYG LPG
TS1 found that the term ‘clean cooking’ was mostly understood to relate to physical cleanliness, as is shown in
Figure 20, which is often considered as one of the greatest benefits of clean cooking (Ronzi et al. 2019; Williams
et al. 2020). Figure 21 shows there was an understanding of the health benefits of clean cooking, with 67% of
respondents recognising the link between clean cooking and disease. Of this 67%, half were able to specify that
the associated diseases were respiratory in nature. There was also a good understanding of the environmental
benefits of clean cooking, particularly with regards to deforestation (Figure 22). Customers’ understanding of
the benefits of clean cooking was higher than has been found in other studies (e.g. Evans et al. 2018; Lewis et
al. 2015) which could be attributed to the success of Bboxx’s education and awareness raising activities.
Figure 20www.mecs.org.uk
Figure 21
Figure 22
83% of the INT participants (N = 20) said they could afford LPG if there was no PAYG offering from Bboxx. A third
of customers (N = 22) had cooked with LPG before (Figure 23). Of these customers, 17 used purchase gas from
a store and 5 had it delivered. 8 customers said they still use their LPG equipment, indicating stacking of multiple
LPG stoves. Reasons that the old equipment was no longer used included refills being too expensive (N = 1), the
customer had switched to Bboxx gas (N = 2), refills no longer being available (N = 3), broken equipment (N = 1)
and safety concerns (N = 2).www.mecs.org.uk
Figure 23: Had customers cooked with LPG before?
Every customer knew at least one other person who cooked with LPG, as shown in Figure 24. The low
penetration of LPG in Kigali (Ministry of Infrastructure 2018) suggests these figures are higher than expected,
and were likely to predispose the customer base to become early adopters of PAYG LPG.
Figure 24
Bboxx’s baseline survey showed the primary fuel before signing up to PAYG LPG was charcoal (Figure 25). In TS1,
several customers reported having experienced health issues when cooking with charcoal (Figure 26).
Figure 25www.mecs.org.uk
Number of people
Figure 26
3.2 What were customer experiences of using PAYG LPG?
3.2.1 Perceptions of PAYG LPG
TS1 found the cook was perceived as benefiting the most from cooking with PAYG LPG, but 23% of people
recognised that the whole household is positively affected, as shown in Figure 27. One customer reported
experiencing a burn caused by using LPG. Nobody else (N = 67) had any health issues with the technology.
Figure 27
TS1 revealed a number of reasons why PAYG LPG was seen as better than standard LPG, such as the ability to
buy small amounts of fuel and affordability (Figure 28). PAYG LPG was worse than standard LPG because of
delivery delays (Figure 29). The ‘other’ category shown on this graph pertains to other operational limitations
with the pilot, such as time delays in replacing batteries that powered the meters.www.mecs.org.uk
Figure 28
Figure 29
Participants in the household interview were given 10 coins and were asked to place them on a list of advantages
of PAYG LPG to depict the value the attributed each one. Participants were free to split the coins as they pleased,
and could place them all on a single aspect if they so wished. Data from all the participants was then used to
calculated a mean value for each aspect. Safety and delivery were valued the most and the lack of upfront costs
the least, as can be seen in Figure 30. This prioritisation is unexpected given that many of the customers said
they could afford LPG if there was no Bboxx product, but it contradicts results from TS1 (Figure 28), which found
that the main advantage was being able to buy fuel in small amounts. It is likely that the findings from TS1 are
more reliable as they came from a larger sample size.www.mecs.org.uk
Figure 30
In TS1 respondents were asked whether they agree with five statements about PAYG, which are shown in Figure
31 along with the results. Only 32% of respondents (N = 8) agreed that PAYG LPG was affordable; yet nine
customers listed affordability as a benefit in an earlier question, pointing towards this being a polarising topic.
94% said that if Bboxx had better service they would use more LPG, which agrees with the disadvantages of
PAYG LPG already discussed (Figure 29). 94% believed PAYG LPG was safe, which was found to be the most
prized aspect in the coin exercise (Figure 30), and 90% would recommend PAYG LPG. The latter is a very high
number, especially given the low perception of affordability. Even though procedures were in place to ensure
the participants understood the research was independent of Bboxx, is possible that bias still arose from the
belief that participants could influence the service they received with their responses.
It was interesting that only 74% of participants in TS1 believed it was possible to cook only with PAYG LPG,
suggesting a high prevalence of fuel stacking within the customer base. This is explored in more detail in Sections
3.4 and 3.5.
Figure 31
3.2.2 Financial impacts
Despite the commonly held perception that PAYG LPG was unaffordable, most customers reported a modest
decrease in cooking fuel expenditure since they started using PAYG LPG (
Figure 32, data from TS1). They reported a mean saving of 3,240 RWF per month (£2.60), corresponding to 1.3%
of customers’ median income, or 15% of cooking fuel expenditure (calculated assuming an average total cookingwww.mecs.org.uk
expenditure when using PAYG LPG of 18,500 RWF, as explained in Section 3.4.3). Yet 34% of customers did
report an increase in cooking fuel spend (N = 23), as shown in Figure 32. It is unclear why this variation arose,
especially as cross referencing with Bboxx’s baseline survey showed customers with an increase in expenditure
used a mixture of LPG and charcoal as their primary fuel before PAYG LPG.
Figure 32
3.3 What were the cooking practices of PAYG LPG customers?
Cooking usually took place in the kitchen (TS1, N = 51, 82%) or the living room (N = 12, 19%). 72% of INT
participants (N = 18) said charcoal is good because it heats the home, but in TS2 customers clarified that charcoal
is never lit solely to provide heating in homes.
In the household interviews it was observed that sometimes the participants would fetch their charcoal stoves
from a neighbour’s house to show it to the enumerator. It was found that six (25%) of INT customers shared
their charcoal stoves with their neighbours, but only two (8%) shared their LPG stoves. This was further
investigated in TS2, where it was found that charcoal stoves were shared more than LPG stoves due to portability
reasons and LPG being regarded as an expensive piece of personal equipment that should not be shared. TS2
also asked if customers would be interested in communal LPG systems that allowed multiple users to have their
own credit quotas, with a lower gas price than the PAYG LPG tariff. No customers expressed interest in this
system; challenges identified included property access and scheduling issues that would arise at meal times.
76% of INT respondents (N = 19) said they perform other tasks in parallel to cooking (Figure 33).www.mecs.org.uk
Figure 33
Here ‘socialising’ comprises interactions with friends of family on the phone, in person or on WhatsApp, and
leisure activities include reading, listening to the radio and watching TV.
3.3.1 Heating water
A considerable amount of cooking energy was expended on heating water; in the CD 51% of recorded cooking
events were heating water and 49% were making food. 68% of the INT customers boiled water before drinking
it. 80% heated water for bathing, with most (70%) doing so daily. Given the prevalence of water heating, TS2
was used to gauge interest in solar water heaters (SWH). 48% (N = 12) expressed interest in owning their own
SWH but only one customer was interested in a communal PAYG SWH.
The CD showed that water was most commonly heated to make hot drinks, such as tea and coffee, or for bathing,
as shown in Figure 34. When charcoal was the cooking fuel of choice, the last of the fire was used to heat the
water in 59% of cases. This is an example of the efficiencies that can arise when cooking with charcoal; minimal
additional fuel would have been used to heat this water. Water was generally not saved in a flask until later;
some of it was saved 38% of the time and all of it was saved 10% of the time (Figure 35). Water was most often
heated to boiling in medium pots that were quarter-half full, as can be seen in Figure 36 and Figure 37 below.
Figure 35
Figure 34www.mecs.org.uk
Figure 37 Figure 36
3.3.2 Cooking food
Meals were usually composed of two separate dishes, with a mean of 2.17 dishes. More information about the
meal form contents is displayed in Table 5.
Meal Form Content Frequency
1 dish 76
2 dishes 176
3 dishes 67
4 dishes 35
No. Bathing 77
No. Drinking 44
No. Hot drink 158
No. Other 83
Table 5: Summary of CD meal forms content
In the vast majority of cases there were no unheated components to the meal (94% of meals recorded). People’s diets were reasonably
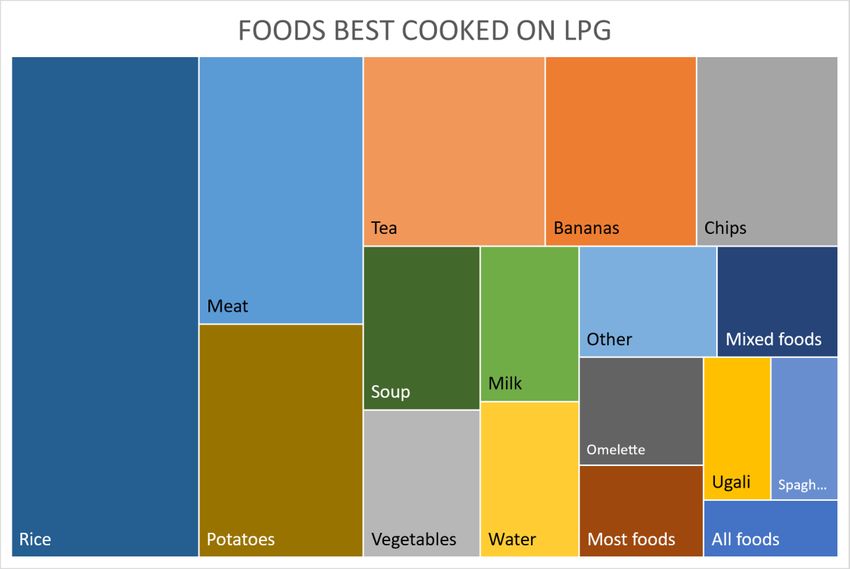
consistent and the most common foods were: 1) green vegetables; 2) rice; 3) ugali, a maize porridge that is a regional staple; 4) potato;
5) bananas; and 6) beans. These six foods are highlighted in this report because they accounted for 570 out of 769 recorded food
cooking events in the CD (74%); typical preparation methods for these foods are shown in
Table 6 and a frequency plot of all foods is shown in Figure 38.www.mecs.org.uk
Figure 38
Dish Preparation method 1 Preparation method 2 Time to cook
Green vegetables Rinsed, chopped, fried. 30 mins
(imboga) Sometimes other
ingredients are added
such as tomatoes, carrot
and onions
Rice Rinsed and boiled or Fried with ingredients 1 hour
steamed like onions, grated
carrots and pepper, put
rice, add boiled water
Ugali Boil water, add maize 30 mins
flour, stir quickly until
fluffs up
Bananas Peel and boil with Peel, rinse, cut into small Method 1: 1 hour
ingredients such as salt, piece and fry (30 mins)
tomato and cooking oil Method 2: 30 mins
Potato Peel and boil with Peel, rinse, cut into small Method 1: 1 hour
ingredients such as salt, piece and fry (30 mins)
beans, tomato and Method 2: 30 mins
cooking oil
Beans Rinsed and boiled with Fry beans that have Method 1: 3 – 4
salt already been cooked by hours
boiling with other
ingredients such as Method 2: 10 mins
onions and salt. Beans
can also be added to
other dishes such as
potatoes or bananas
Table 6: Preparation methods for common dishes
The CD showed the most common cooking processes were frying and boiling, as shown in Figure 39. Note ‘gusonga’ is the term used for
cooking ugali and consists of slowly heating and stirring. An error meant that ‘grilling’ was incorrectly translated into Kinyarwanda aswww.mecs.org.uk
‘guteka’, which is a general term for reheating or cooking food and is shown in Figure 39 as ‘cook’. Surprisingly few people recorded
using multiple cooking processes, despite
Table 6 showing that the most common dishes consisted of several cooking steps, and other cooking diaries
studies conducted in countries with similar cuisines finding a high prevalence of multiple processes (Leary et al.
2019; Scott et al. 2019a, 2019b). This suggests that people tended to record the dominant cooking process only.
Figure 40
Figure 41 Figure 39
Figure 40 and Figure 41 show how these cooking processes were split between the top six foods identified
above. LPG was clearly favoured for frying; boiling represented 33% of cooking events on both fuels. Charcoal
was preferred for cooking, but as this was a translation error it should be discarded, and was only included in
the graphs to show the total number of cooking events.
3.3.3 Duration and timing of cooking
Overlaying the SUMs and the SMART data showed two peaks for both LPG and charcoal stove use (Figure 42).
Both LPG cooking peaks occurred about an hour earlier than the charcoal equivalents, which could be because
cooking with LPG takes less time. The graph also shows that charcoal cooking occurred most often in the middle
of the day and LPG in the evening. Bearing in mind that most of the charcoal data was collected mid-LD andwww.mecs.org.uk
most of the LPG data pre-LD, this could be more of a reflection of the impacts of COVID-19 lockdown than of
temporal preferences for different cooking fuels. The impacts of COVID-19 are explored further in Section 3.6.2.
Times of Cooking Events
700
Charcoal
600
LPG
500
Frequency
400
300
200
100
0
03:00
00:00
01:00
02:00
04:00
05:00
06:00
07:00
08:00
09:00
10:00
11:00
12:00
13:00
14:00
15:00
16:00
17:00
18:00
19:00
20:00
21:00
22:00
23:00
Time
Figure 42
Data from the CD Summary Forms agrees with Figure 42 and finds that that cooking device use was skewed
towards the end of the day, as shown in Table 7. Very few meals were eaten cold (N = 5, 0.6%), in another house
(N = 7, 0.8%) or were purchased outside of the home (N = 7, 8%).
Did you use a cooking Early Breakfast Mid morning Lunch Mid- Dinner Evening Totals
device? morning afternoon
No 53 47 14 2 98 2 12 228
Yes and I cooked it at home 65 65 108 110 16 114 105 583
Yes, I ate food that I prepared
earlier, but I did not reheat it 0 0 0 4 0 1 0 5
Yes, I ate in another house 0 3 0 2 0 2 0 7
Yes, I bought food 0 3 0 2 0 1 0 6
Totals 118 118 122 120 114 120 117
Table 7: Contents of CD summary forms
The self-reported average times spent cooking each meal are shown in Figure 44 below (INT). The results are
not dissimilar to the self-recorded cooking times in the CD, which found that the mean cooking time for a single
dish was 42 minutes. The distribution of dish cooking times is right skewed, and is shown in Figure 43.www.mecs.org.uk
Figure 44
Figure 43
This was further investigated by using the CD data to investigate the cooking times of the top six dishes (Figure
45). Beans had the longest average cooking duration (89 mins) - almost twice that of the next longest cooking
foods, ugali and potato (52 min and 44 mins respectively) – and are likely to be responsible for the tail of longer
cooking events in Figure 43 above.
Figure 45
The CD showed the total time actively spent cooking each meal was 76 minutes, with a standard deviation of 33
minutes. This does not mean the average meal would have taken 80 minutes of the cook’s time, because dishes
could have been cooked in parallel. This was particularly likely to have been the case for meals cooked with LPG
as the stove provided by Bboxx had two burners. In contrast, the charcoal stoves that were used universally by
Bboxx customers could only hold one pot at a time. This suggests that transitioning to LPG could have
significantly compressed the time spent cooking. Figure 46 below shows the average cooking event durations
by fuel type, according to the CD, showing that charcoal cooking events took twice as long as LPG ones.www.mecs.org.uk
Figure 46
3.4 What were the patterns of fuel stacking?
3.4.1 Cooking devices
In TS1, 61% of customers who cooked with charcoal before PAYG LPG said they continued to use it alongside
PAYG LPG (Figure 47). 91% of customers still had a working charcoal stove in their house and 12% said they had
a secondary LPG stove. Some electric cooking devices were also observed during household visits for INT, namely
kettles (N = 5) and juice makers (N = 1).
Figure 47
3.4.2 Frequency of use
In the household interviews, customers said they used their charcoal stove 4.3 times per week on average and
their LPG stove 19.2 times per week. This was similar to the cooking event frequencies measured by the SUMs
and the SMART data, which found the charcoal stove was used 4.9 times per week and the PAYG LPG stove 18.2
times per week. This breakdown is also shown in Table 8 below.www.mecs.org.uk
Method INT SUMs + SMART data
Avg weekly LPG cooking events 19.2 (82%) 18.2 (79%)
Avg weekly charcoal cooking events 4.3 (18%) 4.9 (21%)
Total weekly cooking events 23.5 (100%) 23.1 (100%)
Table 8: Average weekly use of cooking devices according to INT and sensor data
The ratio of LPG to charcoal cooking varied widely between customers, as is shown in the CD data displayed in
Figure 48. The accuracy of individual reporting was low; only 61% of the SUMs customers, who all cooked
regularly with their charcoal stoves, said they did so in TS1. Comparing the customer-level SUMs data to the INT
data revealed large discrepancies in self-reported versus actual stove usage, with charcoal stoves being used
3.7x more than reported and LPG 1.5x more. Possible explanations for this include recall bias, the interview
taking place with a person other than the main cook, and the impact of COVID-19 lockdown on cooking practices,
as most of the SUMs data collection took place during this period. This echoes Wilson et al. (2018) in finding
that self-reported user behaviour does not correlate well to measured stove use, and suggests that the
methodological correlation shown in Table 8 arose through chance.
Fuel stacking in cooking diaries
120%
100%
% cooking events
80%
60%
40%
20%
0%
1 16 27 34 45 60 86 94 95 111
Customer ID
LPG Charcoal Kettle
Figure 48
Of the days on which both LPG and charcoal usage data was recorded, LPG was used on 85% of available days,
charcoal 41%, both fuels 34% of days and neither fuel on 8% of days (Figure 50). The high number of days on
which both LPG and charcoal were used highlights the prevalence of stacking. The CD even showed instances of
multiple fuel use within single meals. Meals consisted of dishes cooked only on LPG 55% of the time; only
charcoal 34% of the time; and both fuels 13% of the time (Figure 49). This demonstrates that charcoal use was
not driven solely by unavailability of LPG, as both fuels were clearly present in the home when stacked meals
were being cooked.www.mecs.org.uk
Figure 50 Figure 49
The reasons for stacking within meals are unknown, but it was interesting to note that the average number of
dishes for meals involving a single cooking fuel was 2.12 versus 2.73 for meals involving multiple cooking fuels.
The LPG stove provided by Bboxx had two burners. A driver of fuel stacking could have been the need to cook
more than two dishes at once, and could be addressed with a four-burner stove. Eight out of ten (80%) of the
CD participants recorded a stacked meal, suggesting that the majority of customers could benefit from a stove
with more burners.
3.4.3 Fuel expenditure
Self-reported data from INT showed that each household purchased charcoal three times a month on average,
spending 3,280 RWF (£2.60) each time, giving an average monthly charcoal expenditure of 8,350 RWF (£6.60),
or 3.3% of average household income. Charcoal could either be bought in a small bucket of roughly 500g or in a
large 25-50kg sack, although purchases of the latter were rare. The CD showed that the amount spent per
purchase ranged from 200 RWF –11,000 RWF (£0.20 - £8.70), with the mean value of a bucket being 450 RWF
(0.40). There was only one recorded sack purchase at 11,000 RWF (£8.70).
Similar purchasing patterns were observed for PAYG LPG. Bboxx’s analysis of the SMART data found that the
average payment size for credit was 2,530 RWF (£2.00) and that payments were typically made four times per
month, spending an average of 10,500 RWF per month (£8.30), or 4.2% of average household income. Adding
this to the charcoal equivalent yields that cooking fuel expenditure accounted for 7.5% of average household
income.
These results show that charcoal cooking was demanding a disproportionate amount of cooking fuel spend.
Although 79% of cooking events took place on LPG (Section 3.4.2), it only commanded 57% of total cooking fuel
spend (Figure 52). If 21% more cooking events took place on LPG then the average customer’s total monthly
cooking fuel expenditure would decrease by 27% from 18,500 RWF to 13,420 RWF (£14.60 - £10.70), and Bboxx’s
monthly revenue per customer would increase by 28% from 10,500 RWF to 13,420 RWF (£8.30 - £10.70), as is
shown in Figure 51. This rough calculation assumes that charcoal and LPG cooking events are similar; the
preference to use charcoal for longer-cooking foods such as beans means that it is likely to underestimate the
cost of transitioning solely to LPG (see Section 3.4.4). However, the findings suggest that significant commercial
gains for providers and savings for customers could be yielded from eliminating charcoal cooking.www.mecs.org.uk
Figure 52 Figure 51
3.4.4 Dish-level cooking fuel preferences
Figure 54 and Figure 55 show cooking fuel choice for the top six dishes according to the CD. The data shows a
strong preference for cooking green vegetables, rice and bananas on LPG. Potato and ugali were cooked on LPG
more often than on charcoal, but the breakdown between fuels was more evenly distributed. The only food that
was cooked more often on charcoal was beans. Section 3.3.3 found that ugali, potatoes and beans are the dishes
that take the most time to cook and Figure 55 below shows there is strong correlation between cooking time
and choice of cooking fuel. It is unclear whether this is because cooking with charcoal takes more time, or
because charcoal was the preferred fuel for longer-cooking dishes. This preference echoes other cooking diaries
studies, which found that traditional stoves were favoured for ‘heavy’ foods that take over an hour to cook such
as beans, tripe and beans & maize stew (Leary, Scott, Serenje, et al. 2019; Scott et al. 2019b, 2019a). People also
tended to see these foods as too expensive to cook on LPG because they use more fuel than other foods, even
if the cost of that LPG was actually lower than the cost of the charcoal required to cook the same dish. This
perception could have been reinforced by the fact that people could physically see how much charcoal was
being used per dish, whereas until PAYG LPG, gas consumption was a mystery.www.mecs.org.uk
Figure 54 Figure 53
Figure 55
These results agree with TS1, where customers were asked what foods were best cooked on LPG (Figure 56) and
what foods were best not cooked on LPG (Figure 57). A variety of foods fell into the former category, whereas
there was a strong consensus (84%) that beans should not be cooked on LPG.You can also read