Using machine learning for predicting intensive care unit resource use during the COVID 19 pandemic in Denmark - Nature
←
→
Page content transcription
If your browser does not render page correctly, please read the page content below
www.nature.com/scientificreports
OPEN Using machine learning
for predicting intensive care unit
resource use during the COVID‑19
pandemic in Denmark
Stephan Sloth Lorenzen1, Mads Nielsen1, Espen Jimenez‑Solem2,6,7,
Tonny Studsgaard Petersen2,6, Anders Perner3,6, Hans‑Christian Thorsen‑Meyer3,
Christian Igel1 & Martin Sillesen4,5,6*
The COVID-19 pandemic has put massive strains on hospitals, and tools to guide hospital planners in
resource allocation during the ebbs and flows of the pandemic are urgently needed. We investigate
whether machine learning (ML) can be used for predictions of intensive care requirements a fixed
number of days into the future. Retrospective design where health Records from 42,526 SARS-CoV-2
positive patients in Denmark was extracted. Random Forest (RF) models were trained to predict risk
of ICU admission and use of mechanical ventilation after n days (n = 1, 2, …, 15). An extended analysis
was provided for n = 5 and n = 10. Models predicted n-day risk of ICU admission with an area under
the receiver operator characteristic curve (ROC-AUC) between 0.981 and 0.995, and n-day risk of
use of ventilation with an ROC-AUC between 0.982 and 0.997. The corresponding n-day forecasting
models predicted the needed ICU capacity with a coefficient of determination (R2) between 0.334 and
0.989 and use of ventilation with an R2 between 0.446 and 0.973. The forecasting models performed
worst, when forecasting many days into the future (for large n). For n = 5, ICU capacity was predicted
with ROC-AUC 0.990 and R2 0.928, and use of ventilator was predicted with ROC-AUC 0.994 and R2
0.854. Random Forest-based modelling can be used for accurate n-day forecasting predictions of ICU
resource requirements, when n is not too large.
Since the outbreak of the COVID-19 pandemic in early 2020, almost 205 million confirmed cases and 4.3 million
deaths have occurred as a result of the SARS-CoV-2 infection worldwide1,2. The speed of viral spread combined
with hospital and governmental systems being ill-prepared for large-scale pandemic responses, created a situa-
tion where allocation of health care resources, including the mobilization of ad-hoc intensive care and isolation
units were urgently needed.
As hospital resources were redirected towards the COVID-19 response, elective visits and planned surgical
procedures quickly became the victim of collateral damage induced by the shift in health care resources, resulting
vercome3.
in a massive backlog of elective procedures that will likely take months or even years to o
As expected, the pandemic hit societies in waves, creating an ebb during the summertime where resources
could again be partly redirected towards other tasks. The choice of when to up or downscale the COVID-19
response thus quickly became a challenge for hospital planners, mobilizing resources at the time of pandemic
acceleration while re-routing physical as well as staff-resources during the months characterized by low infec-
tion rates.
1
Department of Computer Science, University of Copenhagen, Copenhagen, Denmark. 2Department of Clinical
Pharmacology, Copenhagen University Hospital, Bispebjerg, Copenhagen, Denmark. 3Department of Intensive
Care, Copenhagen University Hospital, Rigshospitalet, Copenhagen, Denmark. 4Department of Surgical
Gastroenterology, Copenhagen University Hospital, Rigshospitalet, Copenhagen, Denmark. 5Center for Surgical
Translational and Artificial Intelligence Research (CSTAR), Copenhagen University Hospital, Rigshospitalet,
Copenhagen, Denmark. 6Present address: Department of Clinical Medicine, University of Copenhagen,
Copenhagen, Denmark. 7Copenhagen Phase IV Unit (Phase4CPH), Department of Clinical Pharmacology, Center
for Clinical Research and Prevention, Copenhagen University Hospital, Bispebjerg and Frederiksberg, Copenhagen,
Denmark. *email: Martin.Sillesen@Regionh.dk
Scientific Reports | (2021) 11:18959 | https://doi.org/10.1038/s41598-021-98617-1 1
Vol.:(0123456789)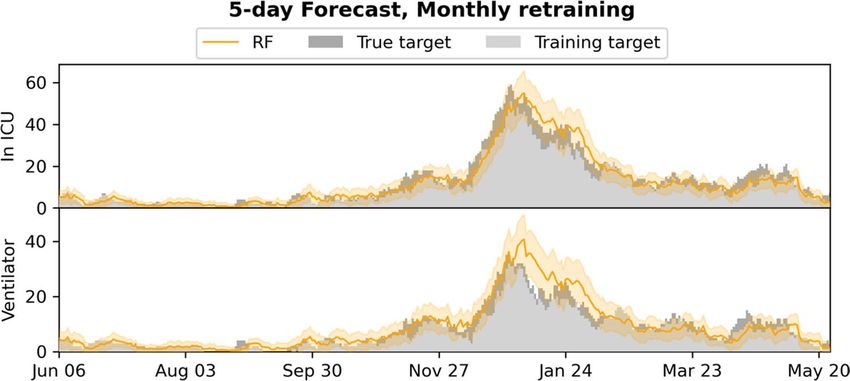
www.nature.com/scientificreports/
Deciding when to increase the resources for the pandemic response at the cost of the elective workload is,
however, a challenge. Such decisions are dependent on accurate prediction models capable of risk-stratifying
patients based on available health information on confirmation of SARS-CoV-2 infection, as well as ensuring
that these predictive models can adjust to changes in disease patterns as the pandemic progresses from the first
to subsequent waves of infection4,5. And indeed, according to a recent review by Becker et al. as of Sept 27, 2020,
there have been more than 5000 modelling analyses published in peer-reviewed journals, excluding preprint
servers, since the start of the e pidemic6. In contrast to mechanistic models, we and others have trained machine
learning (ML) models on electronic health record (EHR) data towards risk prediction on SARS-CoV-2 infection,
specifically targeting resource-requiring events such as hospitalization, ICU admission and use of mechanical
ventilation7–9. We found that accurate risk prediction of the individual patient (micro-prediction) can be per-
formed with a limited EHR dataset, thus opening the potential for predicting hospital resource requirements on
a population-wide scale (macro-prediction) in advance, based on available EHR data at the time of COVID-19
diagnosis.
Usual epidemiological modelling takes into account the number of infected patients, and, based on a small
number of constants, partial differential equations model the future development of the epidemic 10. While
providing insights into the role of macroscopic variables on the disease dynamics, such approaches have limited
ability to model shifts in epidemic constants arising from the underlying demography of the patients as well as
changes in the testing strategy. An approach based on the full medical history of all individuals tested positive
for SARS-CoV-2 has the potential to overcome these issues as shifts in the epidemic constants will be reflected
in the inputs, and by considering the more detailed information provided at the level of individuals—in contrast
to macroscopic variables at population level—it may allow for higher accuracy. We hypothesize that such an
approach modelling the epidemic severity development based on relevant clinical information can yield more
precise forecasting essential for the resource management in hospitals.
Thus, this study investigates whether the previously trained ML models9 can be retrained for the purpose of
n-day forecasting, capable of predicting the number COVID-19 related ICU admissions and use of mechanical
ventilation in a bi-regional cohort in Denmark. While the approach is also applicable to hospital admission in
theory, patients are often not known to the system in the n-day timeframe prior to admission (due to not yet
having been tested for SARS-CoV-2), and thus the method will likely be less precise. Similarly, the approach is
also applicable to the prediction of mortality within the n-day period, although forecasting the number of deaths
explicitly is less relevant in terms of determining the need for hospital resources. However, for completeness,
we investigated the approach for forecasting both hospital admission and mortality and included results in the
supplementary material.
We apply our suggested approach for various values of n = 1, 2, …, 15, and provide a more in-depth analysis
and evaluation of the 5- and 10-day forecasts, as we expect these to meet the tradeoff between a relevant window
for hospital planners with perceived retention of predictive accuracy.
Data
Data access and handling was carried out in accordance with national guidelines and regulations. The study
was approved by the relevant legal boards: the Danish Patient Safety Authority (Styrelsen for Patientsikkerhed,
approval #31-1521-257) and the Danish Data Protection Agency (Datatilsynet, approval #P-2020-320). Under
Danish law, these agencies provide the required legal approval for the handling of sensitive patient data, includ-
ing EHR data, without patient consent.
Cohort information. We conducted the study on health data extracted from the Danish Capital and Zea-
land region EHR system, covering approx. 2.5 million citizens in eastern Denmark. The extracted cohort con-
sisted of 42,526 patients tested positive for SARS-CoV-2 in both regions from March 3rd, 2020 to May 26th,
2021. Extracted patient data included age, Body Mass Index (BMI), sex, smoker/non-smoker status and diag-
noses. Extracted temporal data included time and date of SARS-Cov-2 PCR tests, hospital and ICU admissions
(due to COVID-19), use of mechanical ventilation, medications administered, laboratory tests performed, vital
signs recorded, and death where applicable.
Data set construction. For each patient, a timeline was constructed from the time of the first positive
SARS-CoV-2 test and until censoring. Patients were censored at the time of death, a negative SARS-CoV-2 PCR
test, 30 days without hospitalization (but 30 days after the positive test at the earliest), or at the time of cohort
extraction.
From each patient timeline, a set of snapshots was constructed, one for every 24 h. Each patient snapshot
consisted of the set of features extracted for the patient: age, sex, BMI, comorbidities (based on the ICD-10 and
ATC codes, for a full definition, please see9, smoker/non-smoker status, lab tests, and temporal features: time
since positive test result, time spent in hospital, time spent in ICU, and time on a ventilator. See Supplementary
Table 1 for a complete overview of features included. For each lab test and vital sign feature, we added the follow-
ing aggregated features to each snapshot, based on all tests/measurements prior to the timestamp of the snapshot:
• Most recent test/measurement,
• Mean of tests/measurements,
• Fitted slope of tests/measurements,
• Number of tests/measurements.
Scientific Reports | (2021) 11:18959 | https://doi.org/10.1038/s41598-021-98617-1 2
Vol:.(1234567890)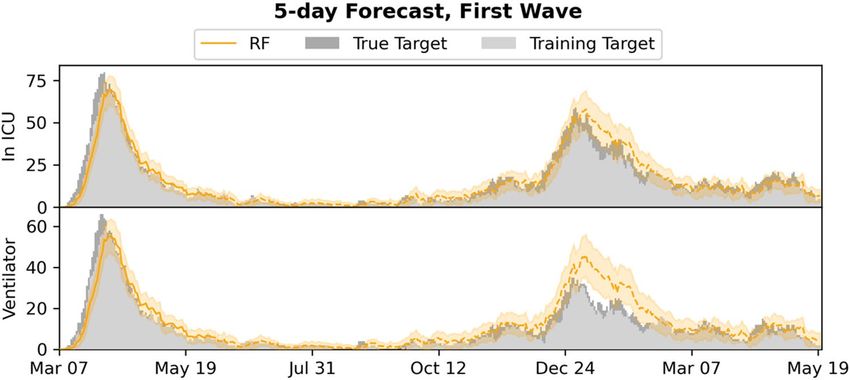
www.nature.com/scientificreports/
In total, 1,246,019 snapshots were created covering the set of patients in the timespan March 3rd, 2020 to
May 26th, 2021.
For each patient snapshot, we defined n-day forecast prediction targets for ICU admission and use of mechani-
cal ventilation. Each target described the n-day forecast for the patient, for instance whether the patient will be
in hospital n days later.
By summing targets for snapshots with the same date, we obtained corresponding population wide n-day
forecast training targets: The number of patients admitted to ICU n days from a given date, and the number of
patients on mechanical ventilation n days from a given date.
A limitation of constructing population wide n-day targets in this fashion is that they underestimate the
ground truth due to late arriving patients; any n-day target cannot include patients added to the dataset in the
n days after the prediction is made. This problem increases with n. To get a proper evaluation of our approach,
we thus also consider the true targets for each training target above, by summing over the actual admitted and
ventilated patients for each date.
Methods
Evaluation setup. We applied Random Forest (RF)11 models for n-day forecasting of ICU admission and
ventilator use for all patients with a positive SARS-CoV-2 test. We trained and evaluated the models in two dif-
ferent setups:
• Monthly retraining: To emulate the real-world use case in which models will be frequently retrained (possibly
daily), we fitted models on all (training) data until the first of a month and evaluated them on data for the
following month (test data), for each month starting with June 2020 and ending with May 2021. For instance,
models trained on data until June 1st were evaluated on data from June. Predictions from each month were
then pooled together to be used for evaluation over the entire period from June 1st until May 26th.
• First wave: The dataset was split in two: the first wave and subsequent waves (before and after June 1st). Mod-
els were fitted on the first wave (training data) and evaluated on the remaining data (test data). Predictions
from the entire second data set was used for evaluation in this setting.
Note, that in both setups, some patients may be present in both training and test partitions of data. This was
chosen as it reflects the real-world usage with frequent retraining, and thereby best estimates the real-world
performance.
For model fitting, missing BMI measurements were imputed based on the training data using k-nearest
neighbor imputation considering only patients of the same sex (k = 100). Missing in-hospital tests and measure-
ments were set to 0.
Model setup. We fitted random forests on the training set11,12, with each individual decision tree in the
ensemble trained on a bootstrap sample from the training set, leaving a set of out-of-bag (OOB) samples available
for evaluating the performance of the RF11.
We used 500 trees and considered all features in each split, using the Gini-impurity as splitting criterion. We
tuned the maximum tree depth (2, 4, 6 and 8) by performing grid search using the Receiver Operating Character-
istics Area Under the Curve (ROC-AUC) computed on the OOB samples as evaluation metric.
Population wide (macro) forecasts were obtained from the individual (micro) prediction models by sum-
mation over the predicted probabilities for all individual patients for a given timestamp. Furthermore, we also
computed the 95% confidence intervals (CI) by considering individual predictions as dichotomous Bernoulli
variables and then summing their variances.
Evaluation metrics. We evaluated the population wide forecast models by computing the coefficient of
determination (R2) and the maximum error (ME) between the predictions and the true targets. Furthermore,
we constructed plots of the true target and the forecast trajectory for both ICU admissions and ventilator use,
including in the plots the training targets and the 95% CIs for the outputs.
We also evaluated the micro models for making individual predictions by computing the ROC-AUC scores
over all test set predictions, as well as plotting the ROC curves.
We computed 95% confidence intervals for both R 2 and ROC-AUC scores by bootstrapping. Furthermore, the
performance of the RF for predicting individual outcomes was compared to the baseline using the deLong t est13.
Baseline comparison models. We considered three baseline models:
• A standard logistic regression (LogR) micro-level model fitted to the individual patients and applied in the
same fashion as the RF to make population wide forecasts. Continuous features were Z-normalized before
the model was applied.
• A static micro-level model, which for each individual patient simply outputs the current state of the patient,
that is, it predicts hospitalization if the patient is currently in hospital.
• A standard linear regression (LinR) macro-level model fitted directly on the true target curves (ICU admission
or ventilated patients); for predicting the number of patients admitted to ICU or ventilated at day D + n, the
model input was the number of patients at days D, D-1, D-2, D-4, D-8, and D-12. In contrast to our approach
and the above baselines, this model was fitted on the true targets, which is possible because it works directly
on the population level.
Scientific Reports | (2021) 11:18959 | https://doi.org/10.1038/s41598-021-98617-1 3
Vol.:(0123456789)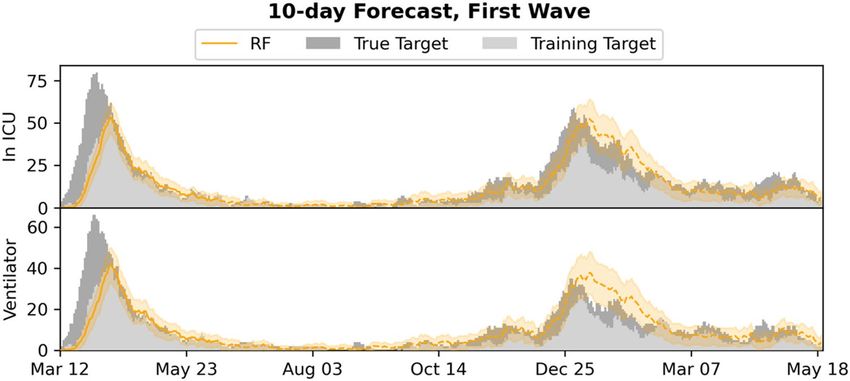
www.nature.com/scientificreports/
Patient state #Patients #Snapshots
Infected 42,526 1,246,019
In hospital 7271 216,685
In ICU 657 17,370
Table 1. An overview of the data sets and the number of patients in different states: patients tested positive
with SARS-CoV-2, patients admitted to hospital, and patients admitted to ICU.
Figure 1. Distribution of patient 24-h snapshots during the period (March 2020–May 2021) considered in the
study.
Results
Demographics. Table 1 presents an overview of the data set, including the number of hospitalized, ICU
admitted and ventilated patients. Figure 1 shows the distribution of snapshots over time. Patients were observed
to change state multiple times during the observed time period for both ICU and ventilator use. Table 2 reports
median, interquartile range (for continuous features) and percentage (for binary features) for age, sex, BMI, and
comorbidities in each of the three data sets. The percentages of missing features are listed in Supplementary
Table 1, including the percentages of missing features for the subset of patients in hospital.
Monthly retrained. Figure 2 plots the R2 and ME for the n-day forecasts (n = 1, 2, …, 15) for the RF model.
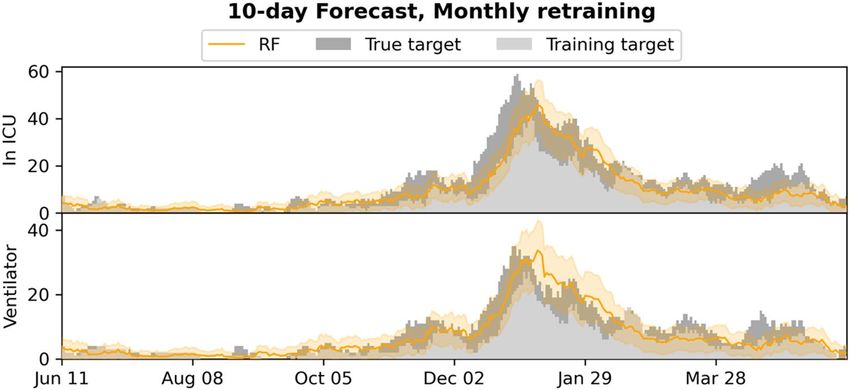
Figures 3 and 4 show the 5- and 10-day forecasts versus the training and the true targets respectively. The RF was
found to perform very well when retrained monthly when n is not too large. As n increased, the performance
decreased. In particular, the RF model obtained an R2 of 0.928 and 0.854 for 5-day forecasting of ICU admission
and ventilator use respectively, with performance dropping to 0.756 and 0.784 for 10-day forecasts.
Supplementary Figs. 1 and 2 plot the baseline forecasts for n-day forecasts respectively (n = 1, 2, …, 15). Sup-
plementary Tables 2, 3, 4, and 5 present numerical results for the RF model and the baselines, including also
results for hospital admission (Supplementary Table 2) and mortality (Supplementary Table 5), with targets
constructed in a similar fashion to the targets for ICU and ventilator. In general, RF performed better than the
baseline models for predicting ICU admission and ventilation, when n was small. In particular, RF outperformed
all other models on both targets for 5-day forecasts. For 10-day ICU admission forecasts, the RF exhibited similar
performance to the LinR model and was outperformed by the LogR model.
First wave. 2 and ME for the n-day forecasts (n = 1, 2, …, 15) for the RF model. Figures 6
Figure 5 plots the R
and 7 show the 5- and 10-day forecasts versus the training and true targets for both the first wave (training data)
and the subsequent waves (test data). The model was found to generalize well to the subsequent waves, with
performance in general decreasing as n was increased. For 5- and 10-day ICU admission forecasts, the model
obtained R2s of 0.940 and 0.851 respectively. For ventilator use, the corresponding R2s were 0.649 and 0.747,
showing an increase with n.
Supplementary Figs. 3 and 4 plot the baseline forecasts for the 5- and 10-day forecasts respectively. Sup-
plementary Tables 6, 7, 8, and 9 present numerical results for the RF model and the baselines, including results
for hospital admission (Supplementary Table 6) and mortality (Supplementary Table 9). The RF outperformed
Scientific Reports | (2021) 11:18959 | https://doi.org/10.1038/s41598-021-98617-1 4
Vol:.(1234567890)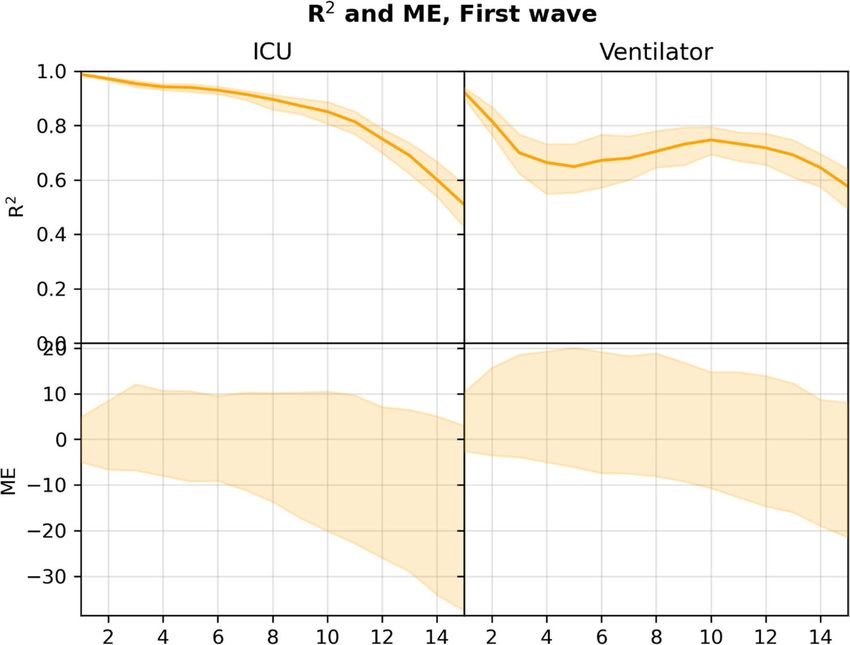
www.nature.com/scientificreports/

                                             Not admitted to
                          Infected           hospital                Admitted to hospital   Not admitted to ICU   Admitted to ICU    Survivor           Non-survivor
#Patients                 42,526             35,255                  7271                   6614                  657                40,872             1540
Age                       44 (27–61)         39 (24–55)              70 (54–81)             70 (53–81)            68 (58–75)         43 (26–59)         83 (76–90)
Body mass index           24.7 (20.9–28.9)   24.1 (20.1–28.3)        26.1 (22.8–30.2)       25.9 (22.7–30.1)      27.6 (24.1–32.0)   24.7 (20.8–29.0)   24.4 (21.4–28.1)
Male                      44.1%              42.0%                   54.2%                  52.6%                 70.3%              43.8%              52.0%
Diabetes                  8.0%               3.2%                    31.1%                  26.3%                 79.9%              6.9%               36.4%
Ischemic heart disease    1.8%               0.6%                    7.6%                   7.2%                  11.6%              1.6%               9.0%
Heart failure             0.1%               0.0%                    0.3%                   0.3%                  0.3%               0.1%               0.3%
Arrhythmia                2.0%               0.5%                    8.9%                   8.3%                  14.2%              1.4%               16.1%
Stroke                    3.5%               2.1%                    10.4%                  10.6%                 7.8%               3.0%               16.7%
Asthma                    6.8%               4.2%                    19.5%                  19.2%                 22.4%              6.2%               22.5%
Arthritis                 0.7%               0.5%                    1.6%                   1.6%                  1.7%               0.6%               2.0%
Osteoporosis              2.7%               1.6%                    8.0%                   8.2%                  6.1%               2.4%               12.1%
Dementia                  2.2%               1.7%                    5.1%                   5.5%                  0.8%               1.8%               14.2%
Severe mental disorder    1.0%               0.8%                    2.1%                   2.0%                  2.6%               1.0%               1.8%
Immuno-deficiencies       0.1%               0.1%                    0.1%                   0.1%                  0.6%               0.1%               0.1%
Neurological manifesta-
                          8.8%               7.3%                    16.3%                  16.5%                 14.2%              8.2%               23.8%
tions
Cancer                    5.0%               3.1%                    14.0%                  14.2%                 12.8%              4.3%               21.2%
Chronic kidney failure    1.1%               0.4%                    4.8%                   4.7%                  5.3%               0.9%               7.3%
Dialysis                  0.2%               0.1%                    1.0%                   1.0%                  1.2%               0.2%               1.1%
Hypertension              13.6%              6.4%                    48.7%                  45.9%                 77.0%              12.0%              56.5%
Smoker                    17.7%              18.2%                   16.7%                  17.1%                 12.5%              17.8%              17.6%

                                       Table 2.  Data set statistics: basic patient information (BMI, age, sex), patient comorbidities and smoker/non-
                                       smoker status. For binary variables, we report the occurrence in percent; for continuous variables, we report
                                       the median and interquartile range.

                                       Figure 2.  R2 and 95% confidence interval (top), and ME (bottom) for n-day forecasts using the RF model in
                                       the monthly retrained setting, computed on the pooled predictions for the months after June 2020. Numerical
                                       results are given in Supplementary Tables 3 and 4.

Scientific Reports |      (2021) 11:18959 |                     https://doi.org/10.1038/s41598-021-98617-1                                                                 5

                                                                                                                                                                  Vol.:(0123456789)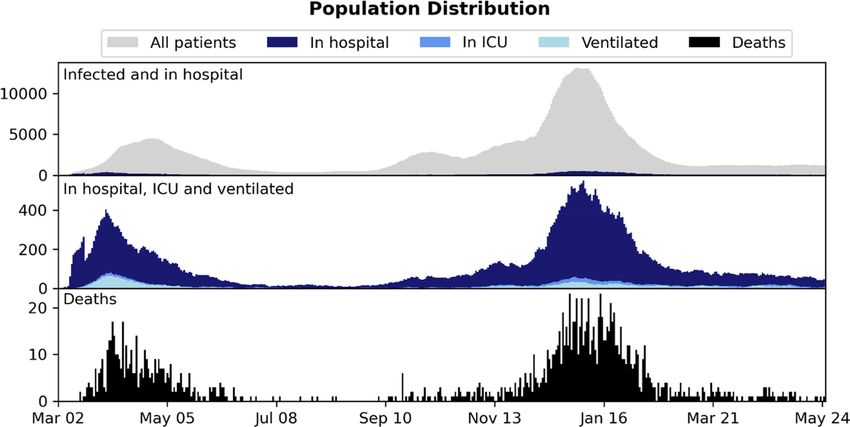
www.nature.com/scientificreports/

                                            Figure 3.  5-day forecasts of admission to ICU and use of mechanical ventilation, compared to the training and
                                            true targets in the monthly retrained setting. The estimated 95% confidence intervals are shown.

                                            Figure 4.  10-day forecasts of admission to ICU and use of mechanical ventilation, compared to the training
                                            and true targets in the monthly retrained setting. The estimated 95% confidence intervals are shown.

                                            all baselines for predicting ICU admission for n < 12, while the static model was in general better for predicting
                                            ventilator use for small n. For 5- and 10-day ICU admission, RF performed best (without overlap of the 95%
                                            CIs); in particular it outperformed the population level LinR model.

                                            Individual forecasts. Supplementary Table 10 reports ROC-AUC for the individual n-day predictions
                                            (n = 1, 2, …, 15) for the macro models RF and LogR when retrained monthly, including results for prediction of
                                            hospital admission and mortality. Supplementary Figs. 5 and 6 show the ROC curves for n = 5, 10. For all n-day
                                            forecasting targets, the RF was found to obtain ROC-AUC scores above 0.95 and was found to perform signifi-
                                            cantly better than LogR (p < 0.0001) by application of the deLong test.

                                            Discussion
                                            In this study, we demonstrate how COVID-19 micro-predictions made at the level of the individual SARS-CoV-2
                                            positive patient, can be extrapolated to a population-wide macro-prediction by modelling incremental patient
                                            data as this becomes available in the EHR system. Based on evaluation in a cohort with 42,526 SARS-CoV-2 posi-
                                            tive patients, we find that, using an RF, accurate n-day forecasting of ICU admissions and ventilator use can be
                                            achieved using initial datapoints including age, sex, BMI and comorbidities with additional datapoints including
                                            lab tests and vital parameters added as these become available. As expected, the results generally degraded as n
                                            was increased, but models provided good fits for n = 5 and even n = 10. When using regular retraining, the RF
                                            approach generally outperformed all baseline methods; among 5- and 10-day forecasts, only logistic regression
                                            performed better for 5-day ICU admission forecasts, as explained below. The setting with regular retraining best
                                            resembles the expected real-life deployment, during which the model will be retrained on the latest available data
                                            even more frequently. When only a single model trained on the first wave was used, the RF still generalized well
                                            for n-day forecasting admission to ICU and use of ventilation, beating most baselines when n < 12, including

          Scientific Reports |   (2021) 11:18959 |               https://doi.org/10.1038/s41598-021-98617-1                                                 6

Vol:.(1234567890)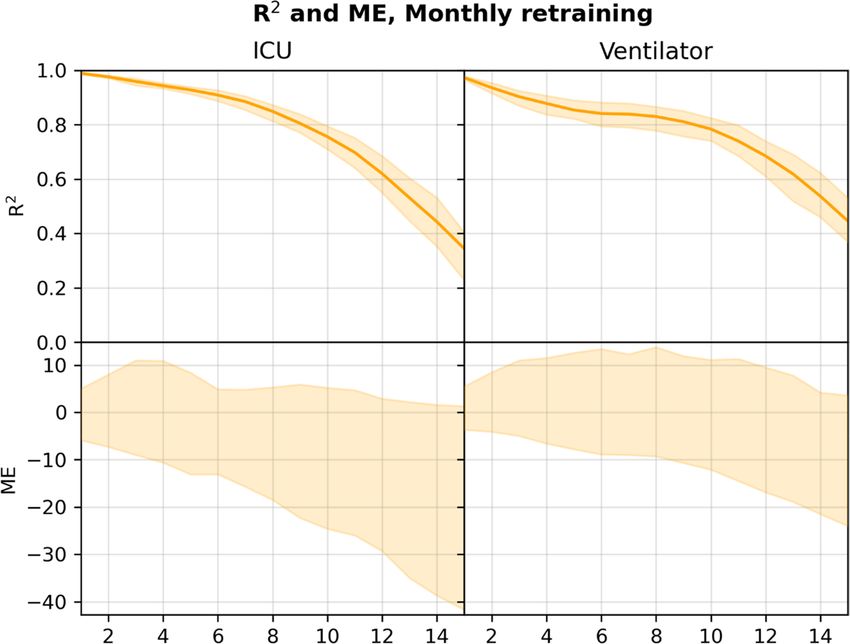
www.nature.com/scientificreports/

                                  Figure 5.  R2 and 95% confidence interval (top), and ME (bottom) for n-day forecasts using the RF model in
                                  the first wave setting, computed on the pooled predictions for the months after June 2020. Numerical results are
                                  given in Supplementary Tables 7 and 8.

                                  Figure 6.  5-day forecasts of admission to ICU and use of mechanical ventilation, compared to the training
                                  and true targets in the first wave setting. Predictions and targets for both the first wave (training data) and the
                                  subsequent waves (test data, dashed) are shown, as well as the 95% confidence intervals.

                                  the macro-level LinR model, confirming that, in this case, the micro-to-macro approach handles shifts in the
                                  distribution (on the macro/population level) better.
                                      While we reported results for only monthly retraining, the data processing and RF implementation is so
                                  efficient that the models can be retrained on the entire cohort daily as new data arrives, allowing for real-time
                                  deployment of the most up-to-date models.
                                      The system is currently limited by missing access to early SARS-CoV-2 tests, which means patients are not
                                  included in the input early, leading to the model producing underestimates of the true admission/ventilation
                                  numbers. This can be seen by inspection of the plots of the forecast trajectories and training/true targets (e.g.,
                                  Figs. 2 and 3). The model consistently underestimates the true targets due to the training targets being under-
                                  estimates themselves. The problem increases with the number of days n we look ahead in the forecasts, as a
                                  patient is less likely to be in the system, when predicting many days ahead; this can also be seen in Figs. 2 and 5,

Scientific Reports |   (2021) 11:18959 |               https://doi.org/10.1038/s41598-021-98617-1                                                       7

                                                                                                                                                 Vol.:(0123456789)
www.nature.com/scientificreports/
Figure 7. 10-day forecasts of admission to ICU and use of mechanical ventilation, compared to the training
and true targets in the first wave setting. Predictions and targets for both the first wave (training data) and the
subsequent waves (test data, dashed) are shown, as well as the 95% confidence intervals.
where the R 2 score degrades. We also evaluated the model for prediction of hospital admissions, but since many
patients are not confirmed positive until after admission, the issue was even more pronounced, and the model
severely underestimated the true admission numbers (see Supplementary Tables 2 and 6), even though the model
performed well for predicting for individual patients.
However, our focus is on ICU admission and use of ventilation, because constraints on ICU and ventilators
are one of the main issues in capacity planning in hospitals14– and for n sufficiently small, for instance for the
5- and 10-day ICU and ventilator forecasts, the training targets and the true targets were fairly close, leading to
good model performance and useable forecasts, with true targets often within the 95% CI.
When looking at the prediction accuracy on the individual level, LogR performed worse than RF. In our
experiments, the logistic regression had a tendency to overestimate the individual risks, that is, the training
targets. The training targets themselves being underestimates of the true targets, this sometimes led to LogR
giving better results on the true values, despite being less accurate on the individual level; for instance, for 10-day
forecasting of ICU admission.
The problem that the training targets underestimate the true targets may be reduced by access to earlier SARS-
CoV-2 testing. While the Danish test capacity during and after the second wave was improved and patients in
general have been tested early (before hospital admission), we only have access to tests performed by the regional
test system and not by private vendors or the national test centers. Thus, we only have access to a limited num-
ber of positive tests before admission and for many of the patients we only have a confirmatory in-hospital test,
leading to a very short time between test and hospital admission, and thus the discrepancy between the targets
and actual number of ICU admitted or ventilated patients.
We expect the accuracy of the micro-to-macro approach to increase with access to these early tests, which
might even make hospital admission forecasting feasible, however this will rarely be possible due to the number
of different providers of COVID-19 tests. A more feasible alternative would be adjustment of predictions by use
of macro model predictions, for instance by estimation of the total number of infected expected to arrive within
the n-day forecasting window.
The findings mirror previously published results from the United Kingdom COVID-19 Capacity Planning and
Analysis System (CPAS)15. In contrast to the CPAS system, our model captures patients at the time of their posi-
tive SARS-CoV-2 test result, with the ability to extract EHR information for all patients irrespective of hospital
admission status. Even when we lack access to the early tests for many patients, this allows us to forecast ICU
admission and ventilator use, even for non-hospitalized patients. This approach is feasible due to data sharing
between the EHR system and Danish national registries, where detailed information on diagnoses codes, previous
hospital admissions and pharmaceutical use is available for all Danish citizens. As such, the system can model
basic demographic and healthcare datapoints even for non-hospitalized patients, which aids the prediction of
need for hospital admission on a population-wide scale. However, as mentioned, the approach is limited by
patients with late positive test results. In practice, the hospitalization model has to be adjusted, for instance by
extending the model by modelling COVID-19 spread as done by CPAS and then adjusting the hospitalization
model accordingly. Even better would be access to the early Danish PCR tests performed outside of the hospitals,
which we hypothesize will alleviate the problem.
Our approach differs from conventional epidemiological analyses, where modelling is based on the number
of patients tested positive, calculated infection rates and social mobility models for a specific infection during a
pandemic with subsequent f orecasting16. The generalization ability and performance of the RF model between the
first and subsequent COVID-19 waves of 2020 and 2021 show the potential of modelling risk predictions at the
individual level based on EHR data with subsequent extrapolation to population wide modelling in this as well as
future pandemics. Furthermore, the approach could be ported to other disease settings, including a hospital-wide
ICU admission forecasting, provided relevant disease modalities could be modelled by dedicated ML systems.
Scientific Reports | (2021) 11:18959 | https://doi.org/10.1038/s41598-021-98617-1 8
Vol:.(1234567890)www.nature.com/scientificreports/
Pivotal for the success of this approach is, however, an ability to rapidly mobilize EHR data for the purpose of
ML modelling, thus indicating the need for maintaining updated data transfer protocols from the EHR system to
a High-Performance Computing (HPC) platform capable of training ML models in a secure environment. Such
EHR and HPC integration should ideally be maintained even between pandemic surges, owing to the often-rapid
spread and unknown features of pandemics.
Furthermore, accumulating data indicates that the patient characteristics of the COVID-19 pandemic change
from the first to subsequent waves. Indeed, reports have indicated that the second wave was characterized by an
altered disease spectrum and updated treatment p rotocols17, resulting in potentially milder disease trajectories
5
with lower ICU and ventilator requirements , while the current third wave is expected to be affected by the
increasing rate of vaccination in the Danish population. As such, effective forecasting models need to be robust
towards demographic fluctuations, which is exemplified in our approach, where the predictive performances of
the models were retained for both first, second and third wave patients in this study. Furthermore, these fluctua-
tions can be addressed by frequent model retraining, as evidenced by the improved performance of the monthly
retraining method demonstrated here. While demographics may change, the pandemic progression carry the
inherent risk of mutations in the viral genome altering the disease severity, as is seen SARS-CoV-2 variations
such as the D614G and B117, the latter being the dominant strain in the current third wave of the pandemic in
both Denmark and neighboring countries18,19. As such, predictive models could ideally be dynamically retrained
on emerging data from multiple data sources, including potentials such as viral sequencing data in combination
with EHR data.
Furthermore, adding additional data feeds (e.g., imaging data) to hybrid prediction models could potentially
augment the value of such systems, which has been suggested by previous studies20–22. The caveat is, however, that
such systems require integration of healthcare and population specific data, enabling extraction of EHR data on
a community wide rather than a hospital specific scale. Healthcare systems operating as individual units rather
than covering the entirety of a regional population, may thus not be optimally suited for real-time deployment
of these prediction models.
This study has several limitations. First, we model data retrospectively and have not demonstrated a pro-
spective value in this study. As such, although accurate on retrospective data predictions, novel features of a
potential next COVID-19 wave could affect model performance. Furthermore, we model a selected subset of
patient-derived variables based on previous experience9, although other data points could affect the model’s
classification ability.
Secondly, we have not performed external validation on a separate cohort. This, however, may not be desirable
due to several factors: The model should be trained to forecast locally, and transferring to different healthcare
systems with different social and geographical factors would require retraining of the model to capture these
effects. We have also recently demonstrated that transferring COVID-19 ML prediction models between health
care systems internationally results in a reduction of the classification precision, presumably due to inherent
differences between healthcare systems even though patient demographics are c omparable9.
Thirdly, as mentioned, the model could benefit from either adjustment based on macro predictions, or access
to earlier SARS-CoV-2 tests for Danish patients, before deployment. This might also make hospital admission
feasible.
In conclusion, this study demonstrates that transferring ML based patient level predictions for COVID-19 to
a population wide-scale for the purpose of n-day resource use predictions, is feasible and should be considered
for the current and future pandemic events.
Data availability
Data used for the purpose of this manuscript cannot be publicly shared due to patient confidentiality issues.
Received: 31 March 2021; Accepted: 8 September 2021
References
1. WHO. Weekly Operational Report Jan 11th. https://www.who.int/publications/m/item/weekly-operational-update-on-covid-19---
11-januar y-2021. Accessed 11 Jan 2021.
2. Bauer, J. et al. Access to intensive care in 14 European countries: A spatial analysis of intensive care need and capacity in the light
of COVID-19. Intensive Care Med. 46(11), 2026–2034 (2020).
3. Deana, C. et al. Learning from the Italian experience during COVID-19 pandemic waves: Be prepared and mind some crucial
aspects. Acta Biomed. Atenei Parmensis. 92(2), e2021097 (2021).
4. Iftimie, S. et al. First and second waves of coronavirus disease-19: A comparative study in hospitalized patients in Reus, Spain.
medRxiv 2020, 2020 (2020).
5. Saito, S., Asai, Y., Matsunaga, N., et al. First and second COVID-19 waves in Japan: A comparison of disease severity and charac-
teristics. J. Infect. (2020).
6. Becker, A. D. et al. Development and dissemination of infectious disease dynamic transmission models during the COVID-19
pandemic: What can we learn from other pathogens and how can we move forward?. Lancet Digit. Health. 3(1), e41–e50 (2021).
7. Soltan, A. A. S. et al. Rapid triage for COVID-19 using routine clinical data for patients attending hospital: Development and
prospective validation of an artificial intelligence screening test. Lancet Digit. Health. 3(2), e78–e87 (2021).
8. An, C. et al. Machine learning prediction for mortality of patients diagnosed with COVID-19: A nationwide Korean cohort study.
Sci. Rep. 10(1), 18716 (2020).
9. Jimenez-Solem, E. et al. Developing and validating COVID-19 adverse outcome risk prediction models from a bi-national European
cohort of 5594 patients. Sci. Rep. 11(1), 3246 (2021).
10. Liu, Z., Magal, P., Seydi, O. & Webb, G. A COVID-19 epidemic model with latency period. Infect. Dis. Model. 5, 323–337 (2020).
11. Breiman, L. Random forests. Mach. Learn. 45(1), 5–32 (2001).
12. Breiman, L. Bagging predictors. Mach. Learn. 24(2), 123–140 (1996).
Scientific Reports | (2021) 11:18959 | https://doi.org/10.1038/s41598-021-98617-1 9
Vol.:(0123456789)www.nature.com/scientificreports/
13. DeLong, E. R., DeLong, D. M. & Clarke-Pearson, D. L. Comparing the areas under two or more correlated receiver operating
characteristic curves: A nonparametric approach. Biometrics 44(3), 837–845 (1988).
14. Ranney, M. L., Griffeth, V. & Jha, A. K. Critical supply shortages—The need for ventilators and personal protective equipment
during the covid-19 pandemic. N. Engl. J. Med. 382(18), e41 (2020).
15. Qian, Z., Alaa, A. M. & van der Schaar, M. CPAS: The UK’s national machine learning-based hospital capacity planning system
for COVID-19. Mach. Learn. 110(1), 15–35 (2021).
16. Cacciapaglia, G., Cot, C. & Sannino, F. Second wave COVID-19 pandemics in Europe: A temporal playbook. Sci. Rep. 10(1),
15514–15514 (2020).
17. Contou, D. et al. Comparison between first and second wave among critically ill COVID-19 patients admitted to a French ICU:
No prognostic improvement during the second wave?. Crit. Care. 25(1), 3 (2021).
18. Lauring, A.S., & Hodcroft, E.B. Genetic variants of SARS-CoV-2—What do they mean? JAMA. (2021).
19. Volz, E. et al. Evaluating the effects of SARS-CoV-2 spike mutation D614G on transmissibility and pathogenicity. Cell 184(1),
64-75.e11 (2021).
20. Burian, E. et al. Intensive care risk estimation in COVID-19 pneumonia based on clinical and imaging parameters: Experiences
from the Munich cohort. J. Clin. Med. 9(5), 11 (2020).
21. Oh, Y., Park, S., & Ye, J.C. Deep learning COVID-19 features on CXR using limited training data sets. IEEE Trans. Med. Imaging.
(2020).
22. Li, L. et al. Using artificial intelligence to detect COVID-19 and community-acquired pneumonia based on pulmonary CT: Evalu-
ation of the diagnostic accuracy. Radiology 296(2), E65-e71 (2020).
Acknowledgements
We gratefully acknowledge the support of the Novo Nordisk Foundation through grants #NNF20SA0062879
and #NNF19OC0055183 to MS and #NNF20SA0062879 to MN. The foundation took no part in project design,
data handling and manuscript preparation.
Author contributions
S.S.L., M.N., E.J.S., T.S.P., A.P., H.C.T.M., C.I. and M.S. participated in study conception. S.S.L., M.N. and C.I.
performed model construction and validation. S.S.L. and M.S. drafted the original manuscript which was criti-
cally reviewed by all authors. All authors have read and approved the final manuscript.
Funding
The study was funded by grants from the Novo Nordisk Foundation to MS (#NNF20SA0062879 and
#NNF19OC0055183) and MN (#NNF20SA0062879). The foundation took no part in project design, data han-
dling and manuscript preparation.
Competing interests
The authors declare no competing interests.
Additional information
Supplementary Information The online version contains supplementary material available at https://doi.org/
10.1038/s41598-021-98617-1.
Correspondence and requests for materials should be addressed to M.S.
Reprints and permissions information is available at www.nature.com/reprints.
Publisher’s note Springer Nature remains neutral with regard to jurisdictional claims in published maps and
institutional affiliations.
Open Access This article is licensed under a Creative Commons Attribution 4.0 International
License, which permits use, sharing, adaptation, distribution and reproduction in any medium or
format, as long as you give appropriate credit to the original author(s) and the source, provide a link to the
Creative Commons licence, and indicate if changes were made. The images or other third party material in this
article are included in the article’s Creative Commons licence, unless indicated otherwise in a credit line to the
material. If material is not included in the article’s Creative Commons licence and your intended use is not
permitted by statutory regulation or exceeds the permitted use, you will need to obtain permission directly from
the copyright holder. To view a copy of this licence, visit http://creativecommons.org/licenses/by/4.0/.
© The Author(s) 2021
Scientific Reports | (2021) 11:18959 | https://doi.org/10.1038/s41598-021-98617-1 10
Vol:.(1234567890)You can also read